Expansion Planning Using Heat Maps
Problem: Need to Transform New Product Success into New Market Opportunities
ABC Furniture manufacturing manufactures and distributes furniture through show rooms across the Eastern USA. The ABC reclining chair profits have proved to be significant and the company is interested in developing the market further. The best way to accomplish this is to either build showrooms or partner with showrooms in underserved areas.
Solution: Visualize Sales with MBO Heat Map - Find ZIP Codes for Growth
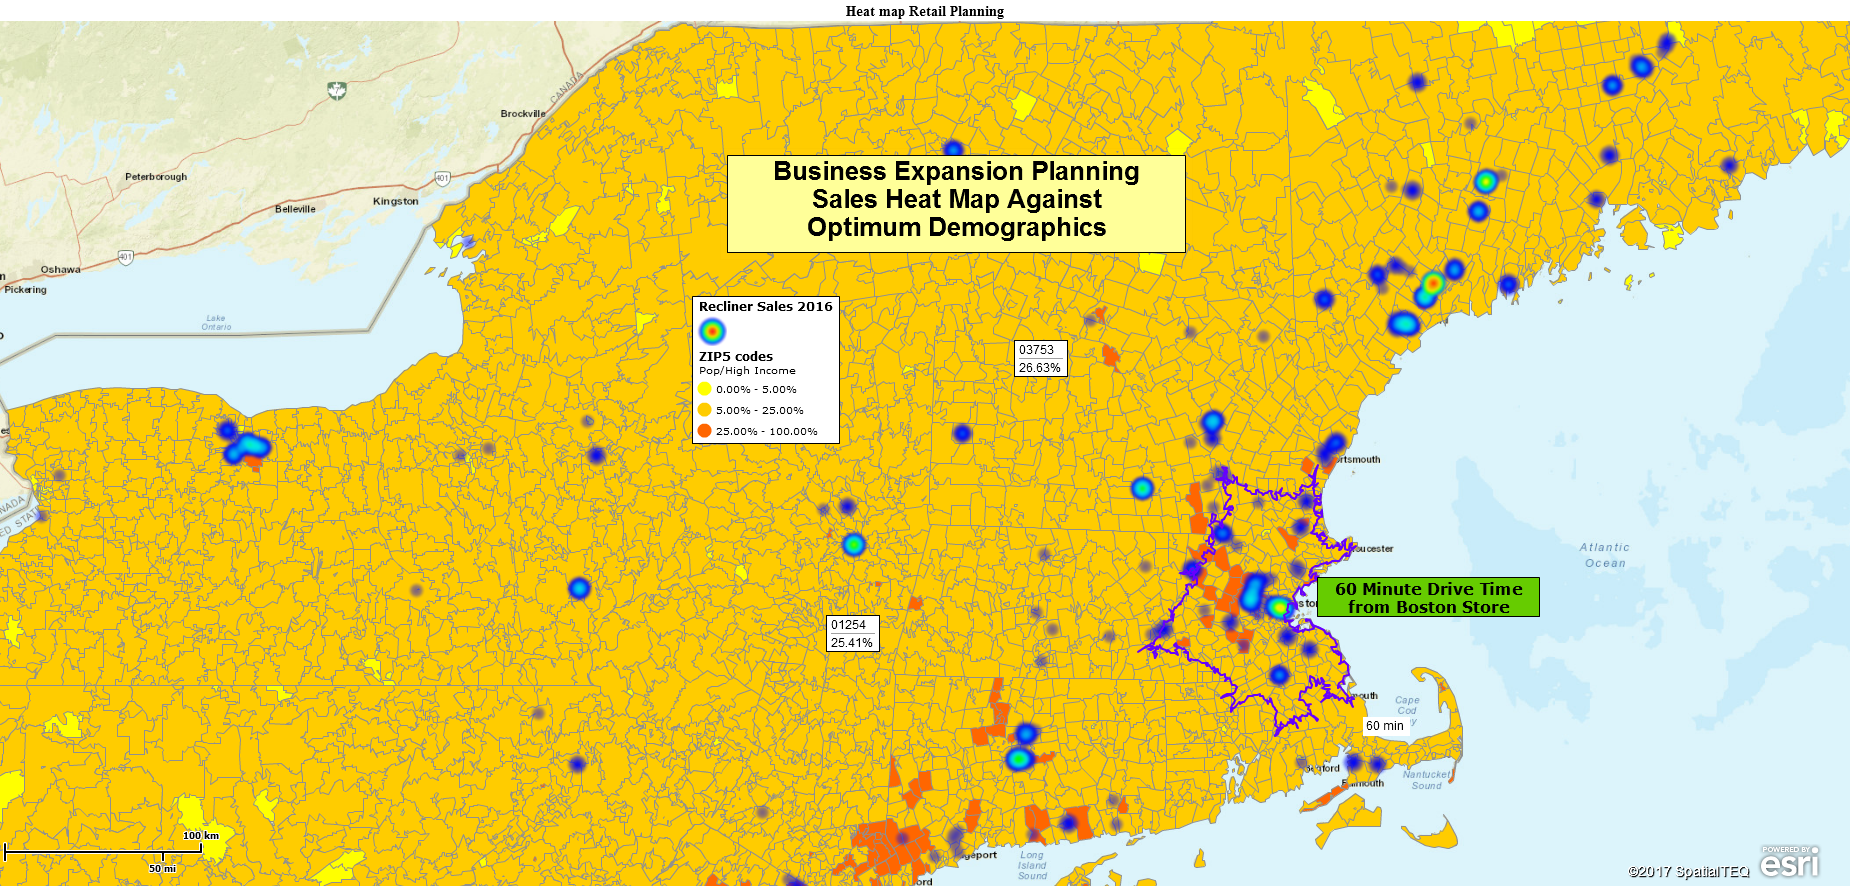
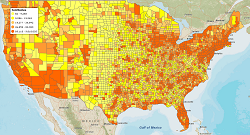
ABC uses MapBusinessOnline to graphically display where sales most often occur, and by omission, where they do not occur at all. The MBO ZIP code layer is turned on and color coded to reflect ZIP codes with the highest Median Income per Population, a ratio calculation. These rust red colored ZIP codes should be the best target areas for growth.
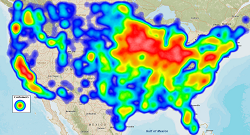
Next, a dataset of 2016 recliner sales by outlet address is imported into MBO and turned into a Heat Map layer. The brighter blue hot spots reflect areas of intense sales, the cooler darker spots show less sales, and again by omission, reflect areas with no sales that are under consideration for better representation.
How to Create a Retail Sales Heat Map
- Make sure your data records have at least two columns. One column for location and a second column with numeric data describing your subject – in this case, sales of recliners
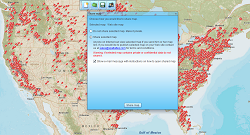
- Import your location or address based dataset into MapBusinessOnline
- Click the Heat Map Button on the Master Toolbar

- Select your target data set and make sure the numeric data column is selected
- Choose an appropriate color scheme and an intensity setting
- Process your heat map
To display the heat map against a demographic scheme:
- Turn on the ZIP code layer
- In Map & Data, hover over the ZIP code layer and click the Edit Gear. Choose Manage Calculated Data Columns. Add a Data Column, name it, and pick the operation parameters – Overall Population/High Med Income
- Use the Color Code Map button, accessing your Calculated Data option (from 2) and color code ZIP codes to best reflect your target market
Your best ZIP codes for new showrooms supporting new sales opportunities will be ZIP codes with optimum demographics and no sales activity, and nearby ZIP codes with optimum demographics close to areas with maximum sales activity, perhaps within a specific drive time distance of existing stores – for example an hour’s drive away.
Learn How Our Customers are Succeeding with MapBusinessOnline

"MapBusinessOnline.com has been an amazing tool for our company. It helps us to be more effective and efficient in our processes. It also provides a necessary tool for clear, concise communications with our team through visualization and supporting data."
Kim Scroggins
Map Coordinator
Leisure Pools
"I have been using MapBusinessOnline for about 8 months and couldn’t be happier with the services it provides. I have employees and myself who map around 250 routes monthly for our sales team. The interface is easy-to-use and the abilities are exactly what I need. My sales team finds the maps and step by step routes easy to follow and accurate. My store lists change every quarter and the uploading system allows me to quickly upload a new list and categorize the account by priority using colors and shapes. I have also used the heat mapping capabilities and found those easy to customize and quick to use. As with any advanced software, this does take a week or two to learn the more complex features, but it is well worth the time invested. This is the software I would have designed if I was to create one myself. Great job!!!"
Bill Hanavan
Director of Operations
Strategic Retail Solutions


"You guys are awesome! I used the MapBusinessOnline trial to get promoted to a sales position within my company. I showed them how I would work my territory with great MBO printed maps that showed projected sales dollars by account locations. I got the Job!"
Jeff Krieger
Territory Manager
Mizuno USA
Popular MapBusinessOnline features
Emphasize customers density with heat maps
Color code maps by ZIP code, county, or state
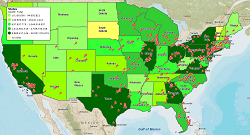
Display business data against demographic maps
Share business maps