Visualize Customers on a Map
As a new sales manager, Buddy Woods needed to make sure he understood how his customer base is distributed across the USA. He also wanted to make sure his sales associates had ready access to the same information. After all, knowing your customer is a critical element of selling.
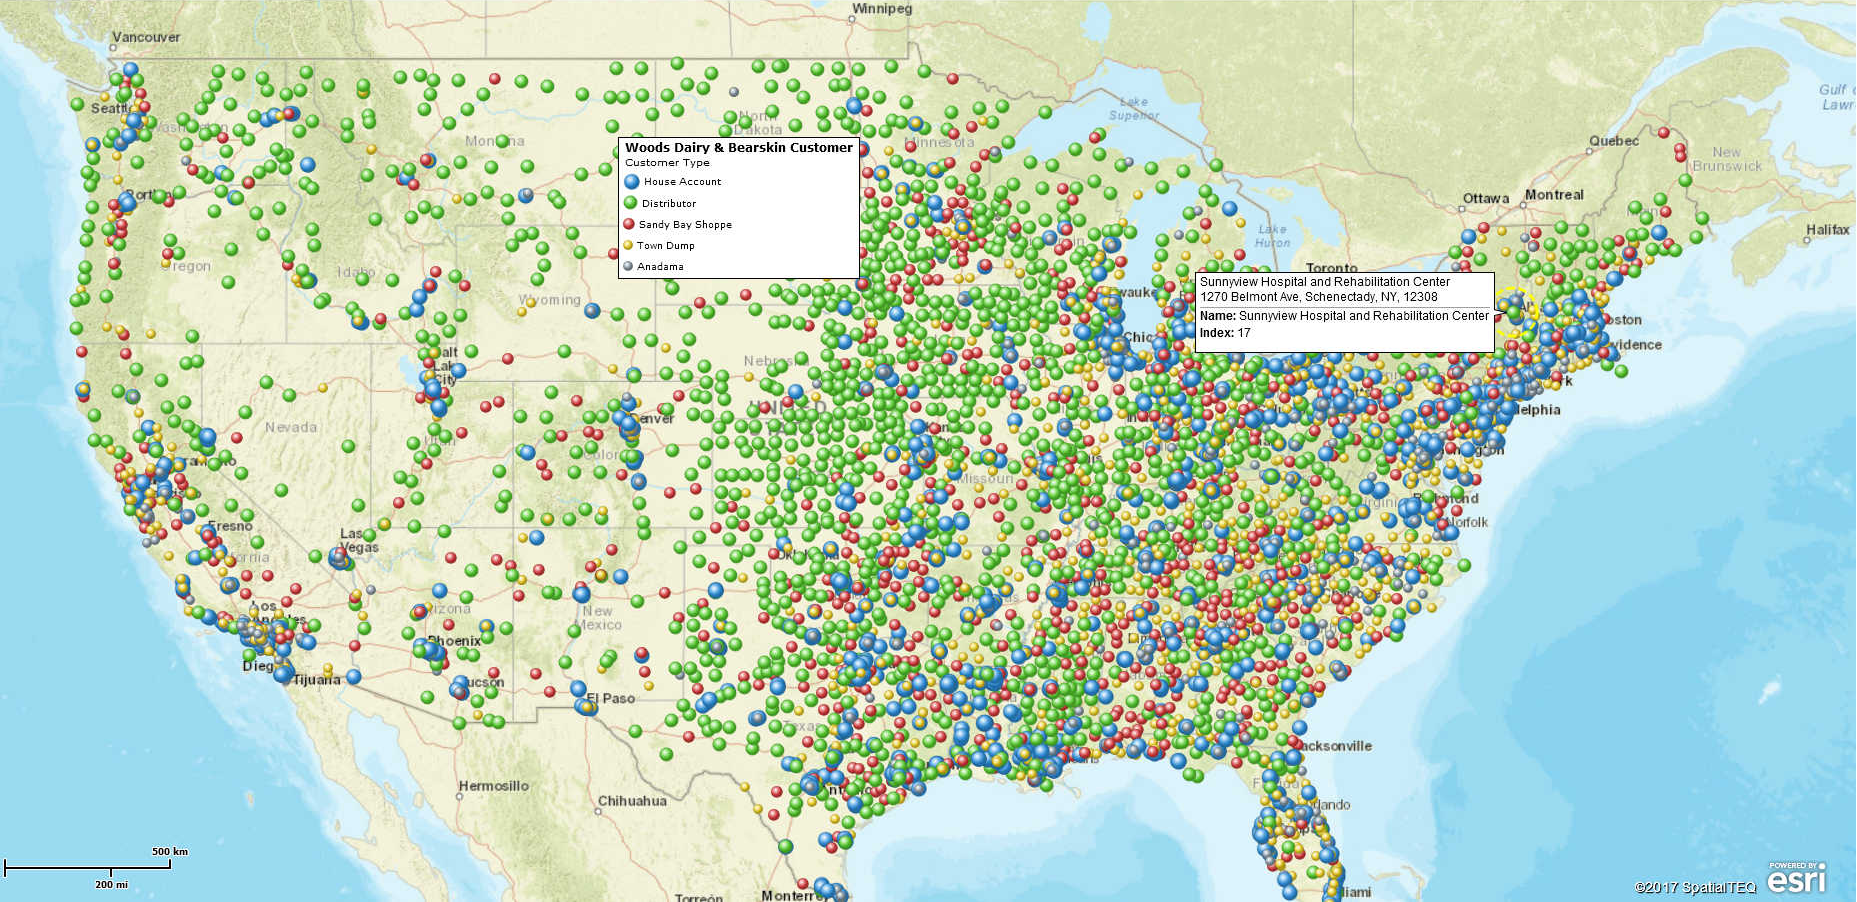
Problem: A sales manager desires a broad map visualization of all customers across the USA to share with his staff. He’d like them color coded or symbolized to reflect customer type and he would like to include labels noting 2016 Sales, Key Contact, and Phone number.
Solution: Import a customer address spreadsheet into business mapping software, such as MapBusinessOnline. Include a column for customer type: house account, bio tech, distributor, and reseller. Adjust labeling options through the import process and using the color code by symbol button choose or import a symbol of your choice.
Seeing is Understanding - Know Your Customer
Buddy first job was to sit down with his best technical sales people and make sure the data was available. It required a little bit of clean up and a few more location components to the data. His predecessor had only required ZIP codes location data. Buddy knew that was problematic for data accurate visualizations. If he imported only ZIP codes onto the business map he’d get multiple points piled on top of one another.
Import Your Customers
Our sales manager asked his admin to collect and update addresses for all customers. That way he’d see an accurate distribution of all customer across the map. MBO allows importing up to 250,000 records per map.
With the data cleaned up Buddy let his admin import the data into MapBusinessOnline. 
- Create an Excel spreadsheet where each row is an address location. Make sure the location information is broken out in separate columns for Name, Address, City, State and ZIP code
- Make sure your column headings are labeled
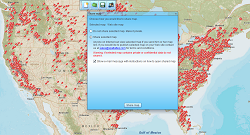
- Click the Import or Plot button in the mapping application
- Pay attention to confirm address columns are placed where they should be
- Be sure the MBO “Name” field matches the appropriate Customer Name field in your data
- Adjust labeling options to your liking
- Click Plot to place the points on the map
Color and Symbol Assignment
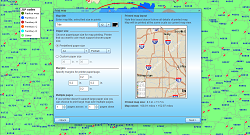
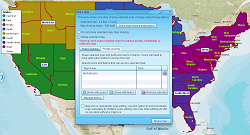
With the customer data on the map, Sales Manager Wood’s administrator chose an appropriate symbol for all customers and color coded and sized the symbols to reflect customer type. Color coding points is easy, starting with clicking the Color Code with Symbols button: 
- Select your data if there is more than one import data set available on the map project
- Check Summary only if you want to summarize by county, state or ZIP code. Buddy does not want to summarize.
- Choose the column of your data controlling color coding
- Choose a range if necessary (for numeric value color coding)
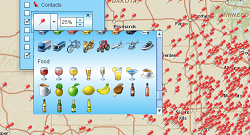
- Choose your desired symbols and adjust size or color as required
- Choose a scheme for No Data in the controlling field
- Click Done or Preview
Data point color coding can be easily adjusted by simply revisiting the process.
Maps Are for Sharing
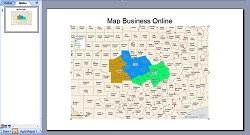
Buddy made a few suggestions and in short order his map was done and his customer visualization was ready to be shared. Buddy used MBO MapShare to publicly share his business map customer visualization through interactive web maps with his sales team. With MBO for teams, sharing is included in the subscription.
Buddy’s team, for the first time, could easily click on an MBO map link and see the entire customer breakdown. They were able to look up customer records by name or ZIP code, query customer contact info and view other data that Buddy shared.
Now that’s a sales team.
Learn How Our Customers are Succeeding with MapBusinessOnline

Billy Taylor of Stop Hunger Now, one the world’s great nonprofit organizations said:
"Thanks for the great product, I use it all the time in our non-profit."
Billy and his team use MBO to create regional lists from their organizational data. MBO is a great data segmentation tool supporting market analysis. Users can segment data geographically and append a variety of data layers to exported results.
Billy Taylor
Director
Stop Hunger Now

"I just wanted to say thank you for this amazing mapping tool! I've tried a number of sales territory map solutions and this is by far the best. I just (finally!) switched over from MapPoint and this is so much better, I wish I had switched sooner. Your videos and blog are also really helpful, though most things I have figured out on my own. It looks like I also have a lot more to discover as I explore the data visualization tools. Thanks again!"
Andrea Harrison
Business Analyst
Brainlab, Inc.
"I had an excellent experience with MapBusinessOnline because my company works in the agriculture industry and makes maps showing where our fields are and these maps need to be viewed and shared in a database. Your product seemed to fit our needs. Overall good support, ease of use, and quality of maps created!"
Seneca Foods

Popular MapBusinessOnline features
Build fast map visualizations of your business data
Visualize business data on map with various symbols
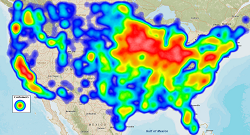
Emphasize customers density with heat maps
Create powerful reports and presentations with maps
Share business maps
Share editable maps with your sales force
Print large format map views