Prepare data for plotting
Usually customer or business data comes in the format supported by MapBusinessOnline. Importing such data is a no-brainer. Make sure that your data matches the simple rules defined below:
- Address information must be split into Street address, City, State, and ZIP code columns. You don’t need all the columns to be present in your file. Usually Street address, City, and State are enough, or you can have just Street address and ZIP code. Note that MapBusinessOnline can plot by ZIP code alone. It also supports a variety of other geographic identifiers including but not limited to City & state, latitude & longitude, or county FIPS code.
- Each row in data file must correspond to one and only one customer, dealer, store, POS, or business record. That is more advanced requirement and you don’t have to observe it to get data plotted successfully. Just be informed that MapBusinessOnline converts each row from a file into a location on map. This way if you have record duplicates then more than one location will be plotted for a business entity.
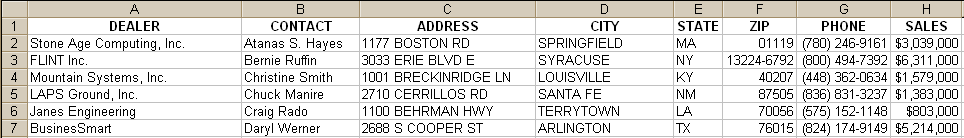
Here is an example of data file that fully corresponds to all MapBusinessOnline requirements:
On another hand the data demonstrated on the picture below doesn’t match second requirement of MapBusinessOnline format:
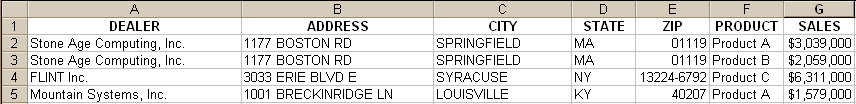
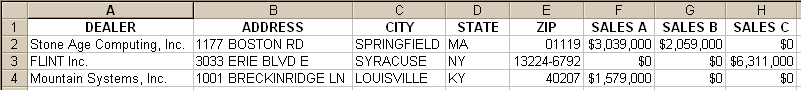
If you plot the file in MapBusinessOnline, you will get two locations on map for Stone Age Computing instead of one. This is because you have products listed as records and not as columns. To fix the problem you need to re-organize your data. You can use a pivot table in Microsoft Excel or shuffle data manually but at the end you will need to format the dataset as following. The picture below shows that we have added Sales A, Sales B, and Sales C columns for respective product sales to our data sheet. Now the data is in the format acceptable by MapBusinessOnline:
That’s it! Never hesitate to Contact us if you need help with data sheet re-organization.