Aggregate demographic data in circle
This article describes how to summarize demographic data for a map radius.
Related article: View demographic data
- Choose center location of demographic data query. Simply enter address, city, or ZIP code into search box and click binocular icon.

- Click circle icon on the found location mini-toolbar.

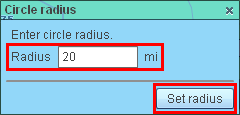
- Enter radius required and click ‘Set radius’ button.
- The circle of specified radius will be added to map. You may want to zoom out to see the circle in full. Just click the magnifying glass icon on the circle’s mini-toolbar.

- Click sigma icon on the circle’s mini-toolbar. That will start ‘Summarize data’ wizard.

- In the first dialog of the wizard choose variables to add to demographic data report. Left side of the dialog shows all available demographic variables, while right side shows those you have added to report. Hold shift key to select multiple data variables. Move data variables between left and right side with arrow buttons. Use up and down buttons to reorder variables in report. Click ‘Next’ when ready.

- MapBusinessOnline will start summarizing data and will show demographic data report in the following dialog box. Click ‘Add to map’ to add this report to map as a text object. Click ‘Export file’ to save demographic report in CSV file.

- In the following dialog click ‘Save report’. File dialog will popup for you to save the demographic data report.


