View demographic data
This article describes how to add demographic data to a map and to view demographic data in Data window.
Related article: Color code map or territories
MapBusinessOnline comes with various demographic data variables that are regularly updated. You can use demographic data to make better business decisions, to analyze your market, to select better locations for new business facilities, or to balance sales territories.
- First of all you may start by adding required demographic data to Data window. Open Data window if it’s not already open by clicking this icon on MapBusinessOnline toolbar.

- In Data window select map layer to view demographics for. In the example below we selected ZIP codes.
Click ‘Add data’ button on Data window’s status line.

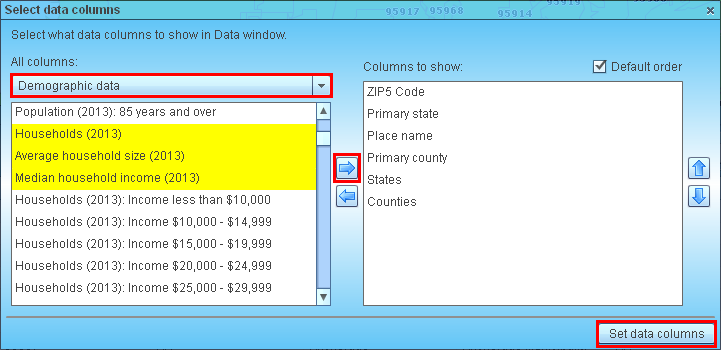
- ‘Select data columns’ dialog will popup. In the dialog select Demographic data group.
Select desired data variables. You can use shift key to select multiple variables.
Click right arrow button to add selected variables to Data window. Finally click ‘Set data columns’ button.

- Selected demographic variables will be added to Data window. You may want to scroll Data window to the right to see the data.
- Now as you have selected demographic data in Data window you may want to add demographic data to map. One way to do that is to color code map using demographics. See this link for more details.
In this article we will show how to add demographic data to labels on map.
- First of all prepare your map. Go to Map & Data window (if it’s not open click the tab with blue arrow on the map’s left), select Custom template, turn off map layers that may obscure the desired map layer view, and turn on the map layer. We setup counties map in the example below.

- Open map layer properties page. In Map & Data window move mouse over map layer you want to label and click gear icon.

- In the ‘Manage map and data’ dialog that will popup, select ‘Labels’ tab and click ‘Format labels’ button.

- Select ‘Auto-labels’ tab in ‘Format labels’ dialog. Check the box marked ‘#1’. Choose ‘Demographic data’ and desired demographic variable. You may also edit prefix to appear in a label for selected demographic variable.
Click ‘Change labels’ button.

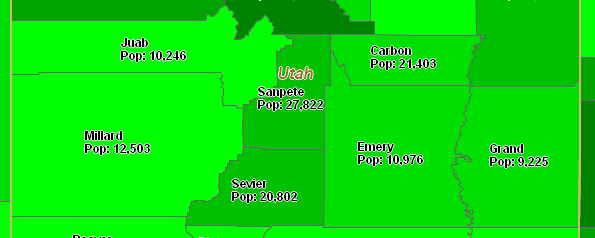
- Now you can see labels on map with selected demographic data. You may need to zoom in to see the labels. Or change zoom level from which labels are visible: Customize map layer labels.

- From the same ‘Format labels’ dialog you can add demographic data to sales territory labels. Open the dialog for the map layer used to align your territories.
Select ‘Territory labels’ tab. Check the box marked ‘Total #1’. Choose ‘Demographic data’ and a demographic variable. Edit prefix to appear in a territory label for selected demographic variable.
Click ‘Change labels’ button.


