Agricultural-Consulting-Firm
Background
Agriculture industry communications consulting firms can be found in any section of the United States. These small businesses focus on supporting agricultural businesses with marketing and communication advice. Several of these agencies recently discovered that MapBusinessOnline is the best business mapping solution for visualizing USDA geographic data, available from government websites.
Challenge
An anonymous agriculture consulting firm has multiple agri-business clients requiring map visualizations of crop production results. To share data describing agricultural production, food security, rural development, nutrition, natural resources, regional food systems, USDA posts data at Data.gov. Visualizing publicly available USDA agricultural map data can be both frustrating and limited in scope. The software typically required to view published geodata is often expensive and can require trained GIS technicians.
Some of the agency's clients in the agricultural business needed access to USDA crop production maps in a hurry. The agency manager required a tool that her general business users could access, learn, and afford. Fortunately, she discovered MapBusinessOnline while searching for an affordable solution to this business map related challenge.
Solution
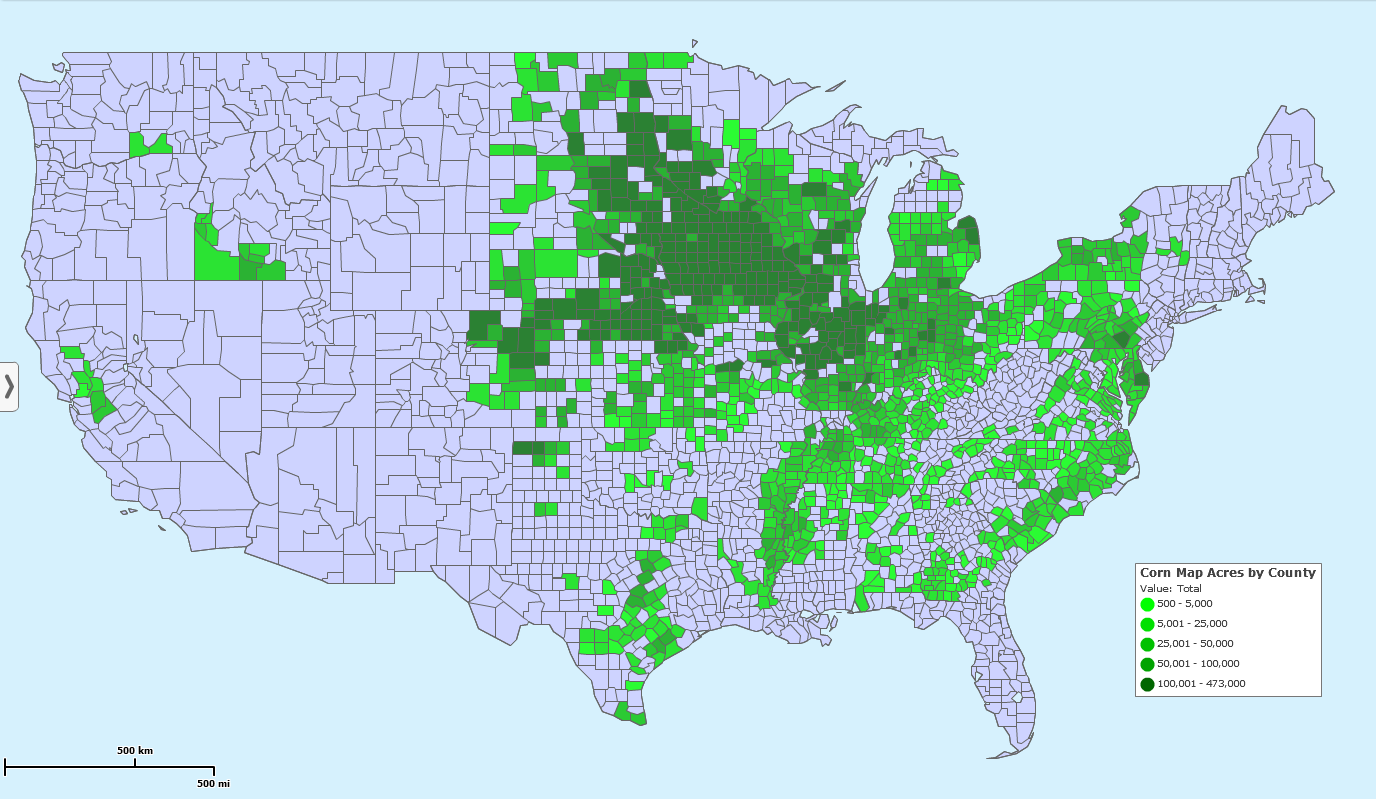
The agency's manager (let’s call her Lisa) imported map data that reflected her requirement for Corn Acres Planted by County from the USDA National Agricultural Statistics Service (NASS) site. Her goal was to display this data for the mid-western USA area by color-shaded counties like the USDA example on their website.
She downloaded the source data, in Excel format, from the NASS site to her desktop. The USDA data was then imported into MapBusinessOnline as point data by county. The government provided geodata was not complicated:
Once imported, the point data was then turned off, and the county map layer was color coated to reflect planted corn acreages. The map legend was adjusted to reflect the information the AG consulting manager's clients required. Other map layer color shades were tweaked to help the planted counties stand out in a meaningful way.
Corn Acres Planted by County
Results
Armed with mapping software that can affordably and easily create agriculture maps from USDA map data, Lisa can help her clients visualize agricultural trends impacting crops and in a variety of locations across the nation.
MapBusinessOnline maps are easily shared as interactive maps and include analysis capabilities as well as a full Census demographic library of data to apply to analysis projects. Lisa's clients could choose to accept map output from Sage VC or invest in a copy of MapBusinessOnline to create their own agricultural maps. The software includes a full library of US Census demographic data as well as access to business listings, enabling a full featured market analysis tool.


