Health Maintenance Organization
Background
Millions of Americans are provided with health care insurance coverage through their employers or through Federal and State health care services. It is imperative for healthcare providers and insurers to manage and account for healthcare services across the beneficiary base. Cloud-based business mapping tools are often used to display the geographic extent of Health Maintenance Organization (HMO) coverages and assure members are getting requisite care. Business maps for healthcare are used:
- Confirm all insured beneficiaries are properly covered based on home address and need
- Assure that accurate maps display where to go to get specific medical services
- Share network service provider locations with coverage areas clearly displayed
- Provide coverage options for displaced beneficiaries in the event of emergencies
Challenge
Create compelling and informative business maps that accurately illustrate healthcare coverage areas for all covered HMO beneficiaries. These maps must display:
- Areas of Service - geographical HMO network areas roughly as 40-mile radius around an authorized major treatment facility (MTF) where primary benefits are offered
- Out of Service Options – treatment facility options for the areas beyond the 40-mile radius Area of Service
- Out of Network Options - based on coverage rules, the map displays healthcare treatment facilities regardless of HMO network affiliation
Each map reflects the geographical extent of healthcare Network coverage for all HMO network beneficiaries.
Solution
Using MapBusinessOnline, the HMO map maker(s) develop a series of business maps displaying network coverage areas delineated by a 40-mile radius area from the center coordinates of the primary network medical facility, usually a hospital. The map maker is not required to carry a degree in geography or GIS mapping, but she understands the intricacies of each HMO network mapping requirement enough to create clear, uncluttered maps that quickly inform constituents and clients about Network coverages areas.
An ex-MapPoint user, this particular map maker turned to MapBusinessOnline as Microsoft exited the mapping software space. The MapPoint replacement software supported her requirement for territory mapping, map sharing, and demographic map visualizations. MapBusinessOnline included tutorial videos, blogs with advice on building compelling business maps, and hands on technical support.
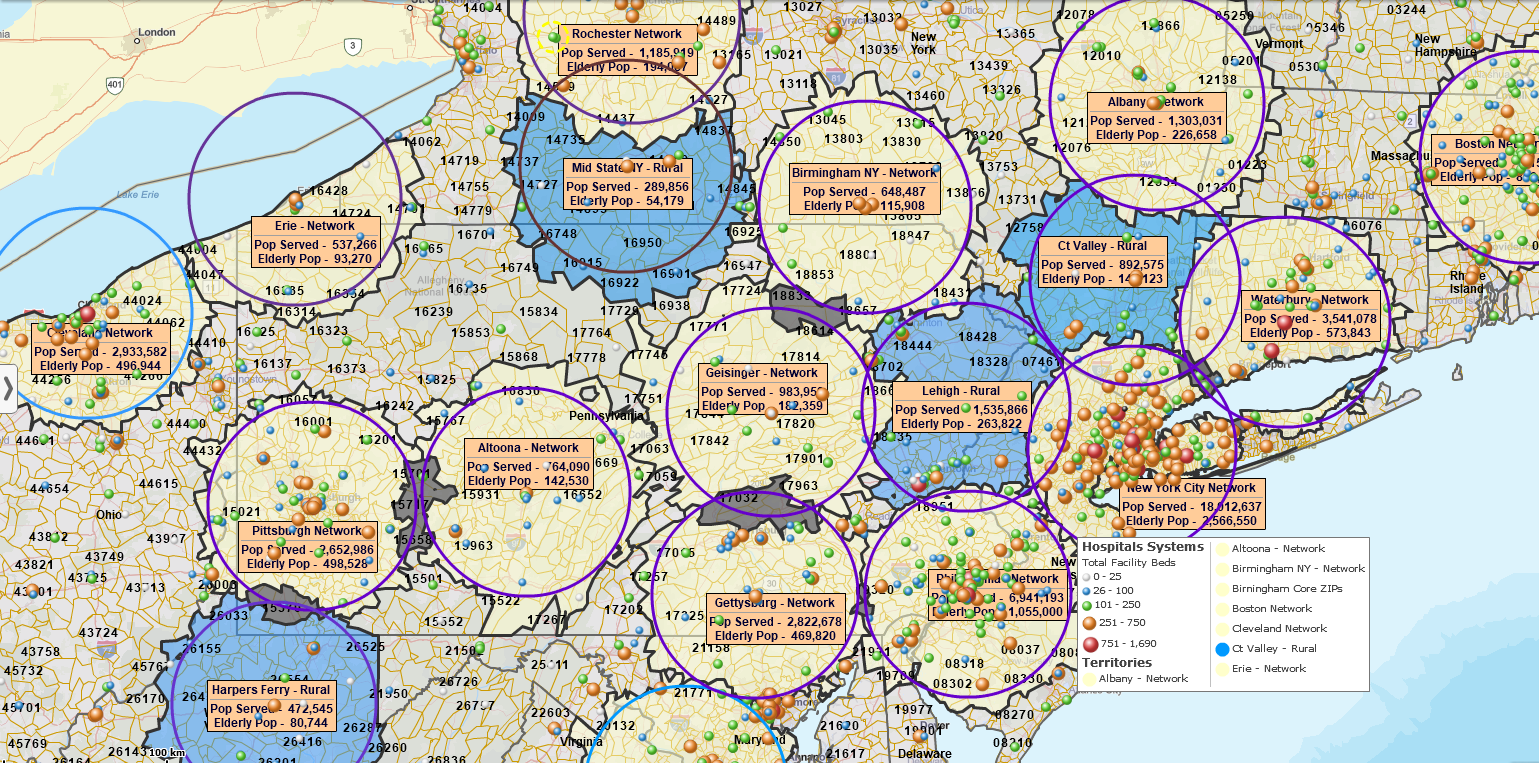
Coverage Areas Maps
The map maker used MapBusinessOnline Standard to generate HMO ZIP code coverage areas based on a 40-mile radius surrounding the major medical center location. HMO coverage areas or territories are developed using ZIP codes, bolding certain ZIP code labels and color shading the coverage area to designate healthcare coverage geographies; all while not overwhelming the map viewer with superfluous detail. Boundaries are shaded in black. The 40-mile radius circles are colored purple. Areas with yellow fill designate core coverage areas, while blue areas designate rural coverage areas that may not provide complete medical services for all beneficiaries.
A well-planned coverage area map that shows complex coverages while not overwhelming the viewer
Careful attention to map background selection, color shading of map layers, and label font and color are just some of the details involved in creating a compelling and informative healthcare coverage map. The parent map is saved as a Map Template, the baseline for further HMO map development, preserving the integrity and invested work of the original territory map.
With a baseline map established, the map maker can create off-shoot maps that describe health care eligibility statistics for critical areas of interest, or for areas with unique coverage challenges, like rural areas or areas prone to emergencies. ZIP codes, color-code by population, reflect eligible population densities around a given HMO or medical center.
Coverage area ZIP codes can be color-shaded based on MapBusinessOnline Census demographic data to display population densities by ZIP code or to show actual beneficiary densities from imported lists of home addresses – private data and not shown here.
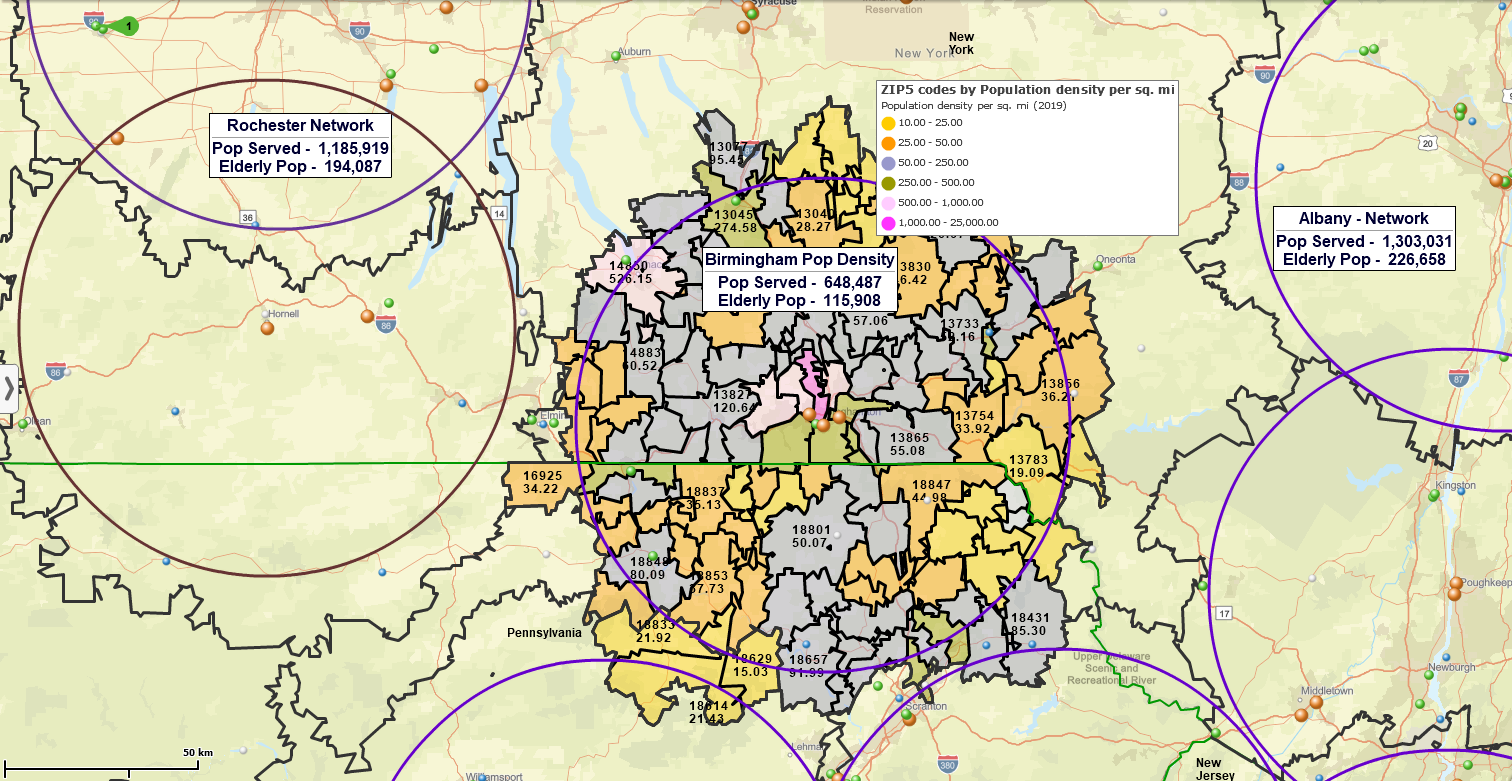
Network area view displaying population densities by ZIP Code
During natural disasters or emergencies (hurricane, floods, fires, etc.), population density maps are essential as they serve to quickly identify at-risk populations (by ZIP code or Counties). In addition, medical planners can precisely identify all major medical facilities at-risk and more precisely project availability of healthcare medical resources. This is especially critical for beneficiaries who may be displaced throughout the USA seeking healthcare outside of their usual HMO network.
Market Analysis by Drive Time
An additional Map view, essential to the process of right-sizing medical clinic enrollment, was generated using MapBusinessOnline Pro Market Analysis. All clinics under this analysis are queried by drive time polygon to determine the exact number of beneficiaries living within a specific drive time area from the clinic's 40-mile radius boundary.
MapBusinessOnline provides a platform for easy-import of location or address-based data. In our map maker's case, these imported data layers include both clinic availability and health network beneficiaries. MapBusinessOnline Pro Search and Segment operations, with driving time and distance analysis capability, are applied to generate drive time polygons that inform planners of existing healthcare coverage areas and potential future coverage area requirements. Once drive time coverage areas or territories are established, population data is added to the analysis to create precise distance calculations by ZIP code based on population densities. Actual healthcare beneficiary home address data can be added to generate more accurate drive time calculations.
Results
With a selection of maps created and stored for use, our map maker is ready to answer location and population-based inquiries about the healthcare beneficiaries’ coverage expectations and to match healthcare coverage requirements by need and proximity. These inquiries could be generated by insurance coverage planners, by the medical community, or by single clients or groups of beneficiaries. Usually coverage questions can be answered using existing map views, but at times may require new or derivative maps to determine answers.
MapBusinessOnline results or reporting output can be generated in several formats:
- Informative map visualizations shared on paper, or as image files and interactive web maps
- Exportable data reports in CSV format
- Live map demonstrations for onsite meetings or online web-share meetings
Regardless of the healthcare and population coverage inquiries, our HMO map maker has a set of map visualizations at the ready to begin answering complex questions about insurance coverage for all beneficiaries of this insurance company's products and services.


