Seattle Gymnastics
Background
Seattle Gymnastics (SGA) is a Seattle-based gymnastics instruction and training business with a focus on providing children ages one to eighteen-years-old with recreational and competitive gymnastics training. With four extremely successful facilities in the Seattle area, the management team at Seattle Gymnastics began to consider the possibility of expansion beyond Washington state. But what are the most lucrative and kid friendly new markets for their business expansion?
Challenge
Seattle Gymnastics needed to conduct market research to determine the top three or four urban areas around the USA most likely to replicate the success they had experienced in Seattle.
MapBusinessOnline was asked to conduct the market analysis as a custom job. The process outlined below is achievable through a subscription to MapBusinessOnline Pro.
Solution
The MapBusinessOnline Market Analysis process entailed three key steps:
- Generate a baseline map visualization of the existing business to verify critical market criteria.
- Identify the top cities for growth based on SGA existing business demographics.
- Construct a nationwide business map and report that recommends areas for expansion.
1. A Map Visualization of Seattle
The first step in the process was to create a map visualization of SGA's current business within MapBusinessOnline. SGA provided a list of just under 17,000 customer addresses which were uploaded into MapBusinessOnline. The address locations of SGA's three current Seattle facilities were also geocoded on to a business map. This gave us a great sense of the company's existing coverage area as a dot density map view concentrated largely in downtown Seattle.
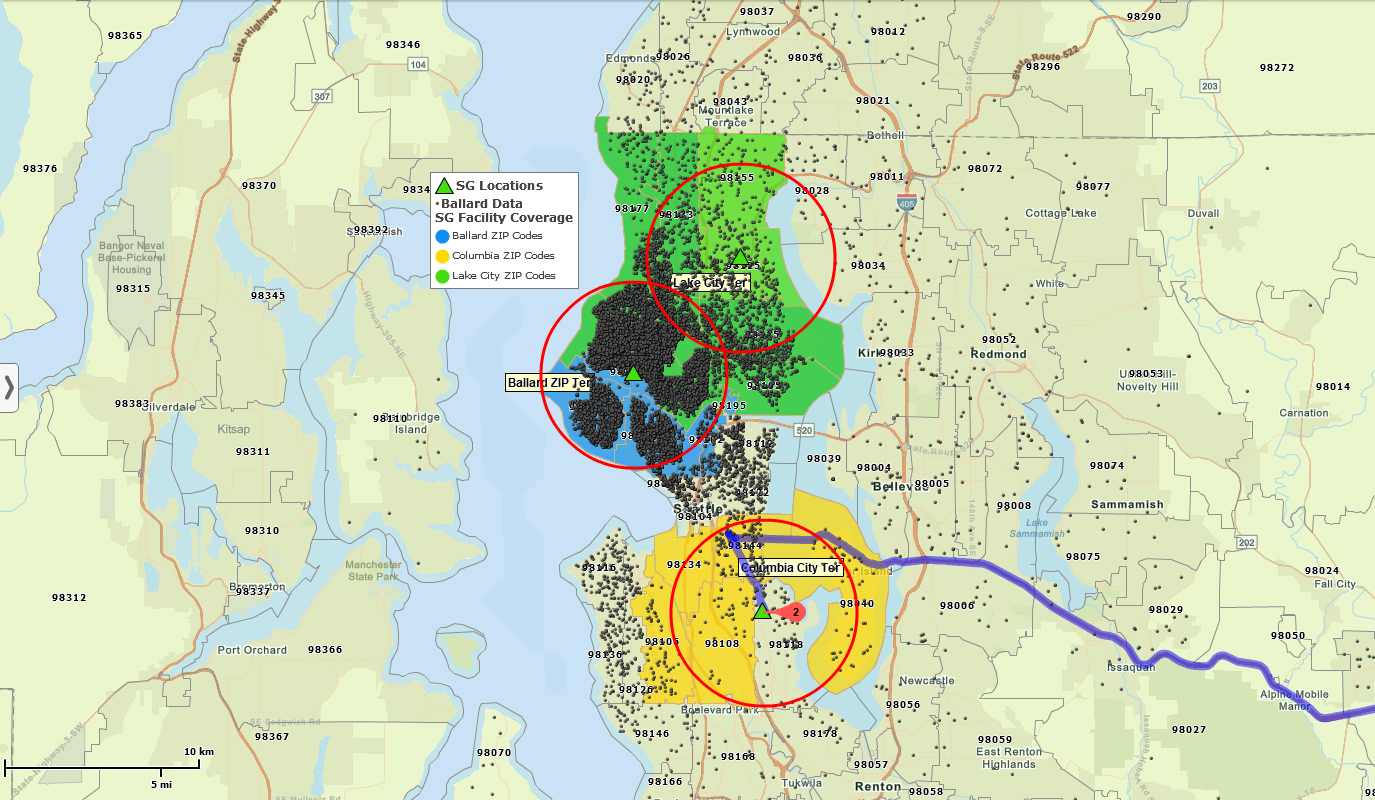
We plotted three-mile radius searches around each facility location. Using these circles, we estimated the area's population of high-income households and the population of girls ages one to fifteen, accessing Census published data layers that are included and summarized within MapBusinessOnline. We chose SGA's Ballard site as the optimum business model location because the dot density map indicated most customers lived close to that facility and it contained a high concentration of females ages one through fifteen. It was noted that most SGA parents would not drive more than 15 minutes to drop off kids for gymnastic sessions, 15-minute drive time happens to correlate nicely with our circles on the Seattle peninsulas.
The owner of Seattle Gymnastics reviewed the map visualization and confirmed that it reflected their existing business. This verification step is important for building client trust in the mapping tools and to make sure the initial mapping model passes the smell test. Map-based market analysis is reliable, but a dedicated manager's perspective could suggest additional data points to consider.
2. Identify the Top Cities for Growth
Once our SGA map visualization assumptions were confirmed a full USA map-based market analysis was created. MapBusinessOnline calculated data column tools summed multiple demographic categories supporting SGA business – the top two categories were: high-income levels, and the population of girls ages one through fifteen. These summed Census layers were assigned to both ZIP code and City Limits map layers.
MapBusinessOnline's City Limits map layer was filtered by income to isolate 127 cities with large concentrations of very high-income earners. These cities are the USA hot spots for expendable income. It's important to remember that high income 'cities' are often suburbs of major cities.
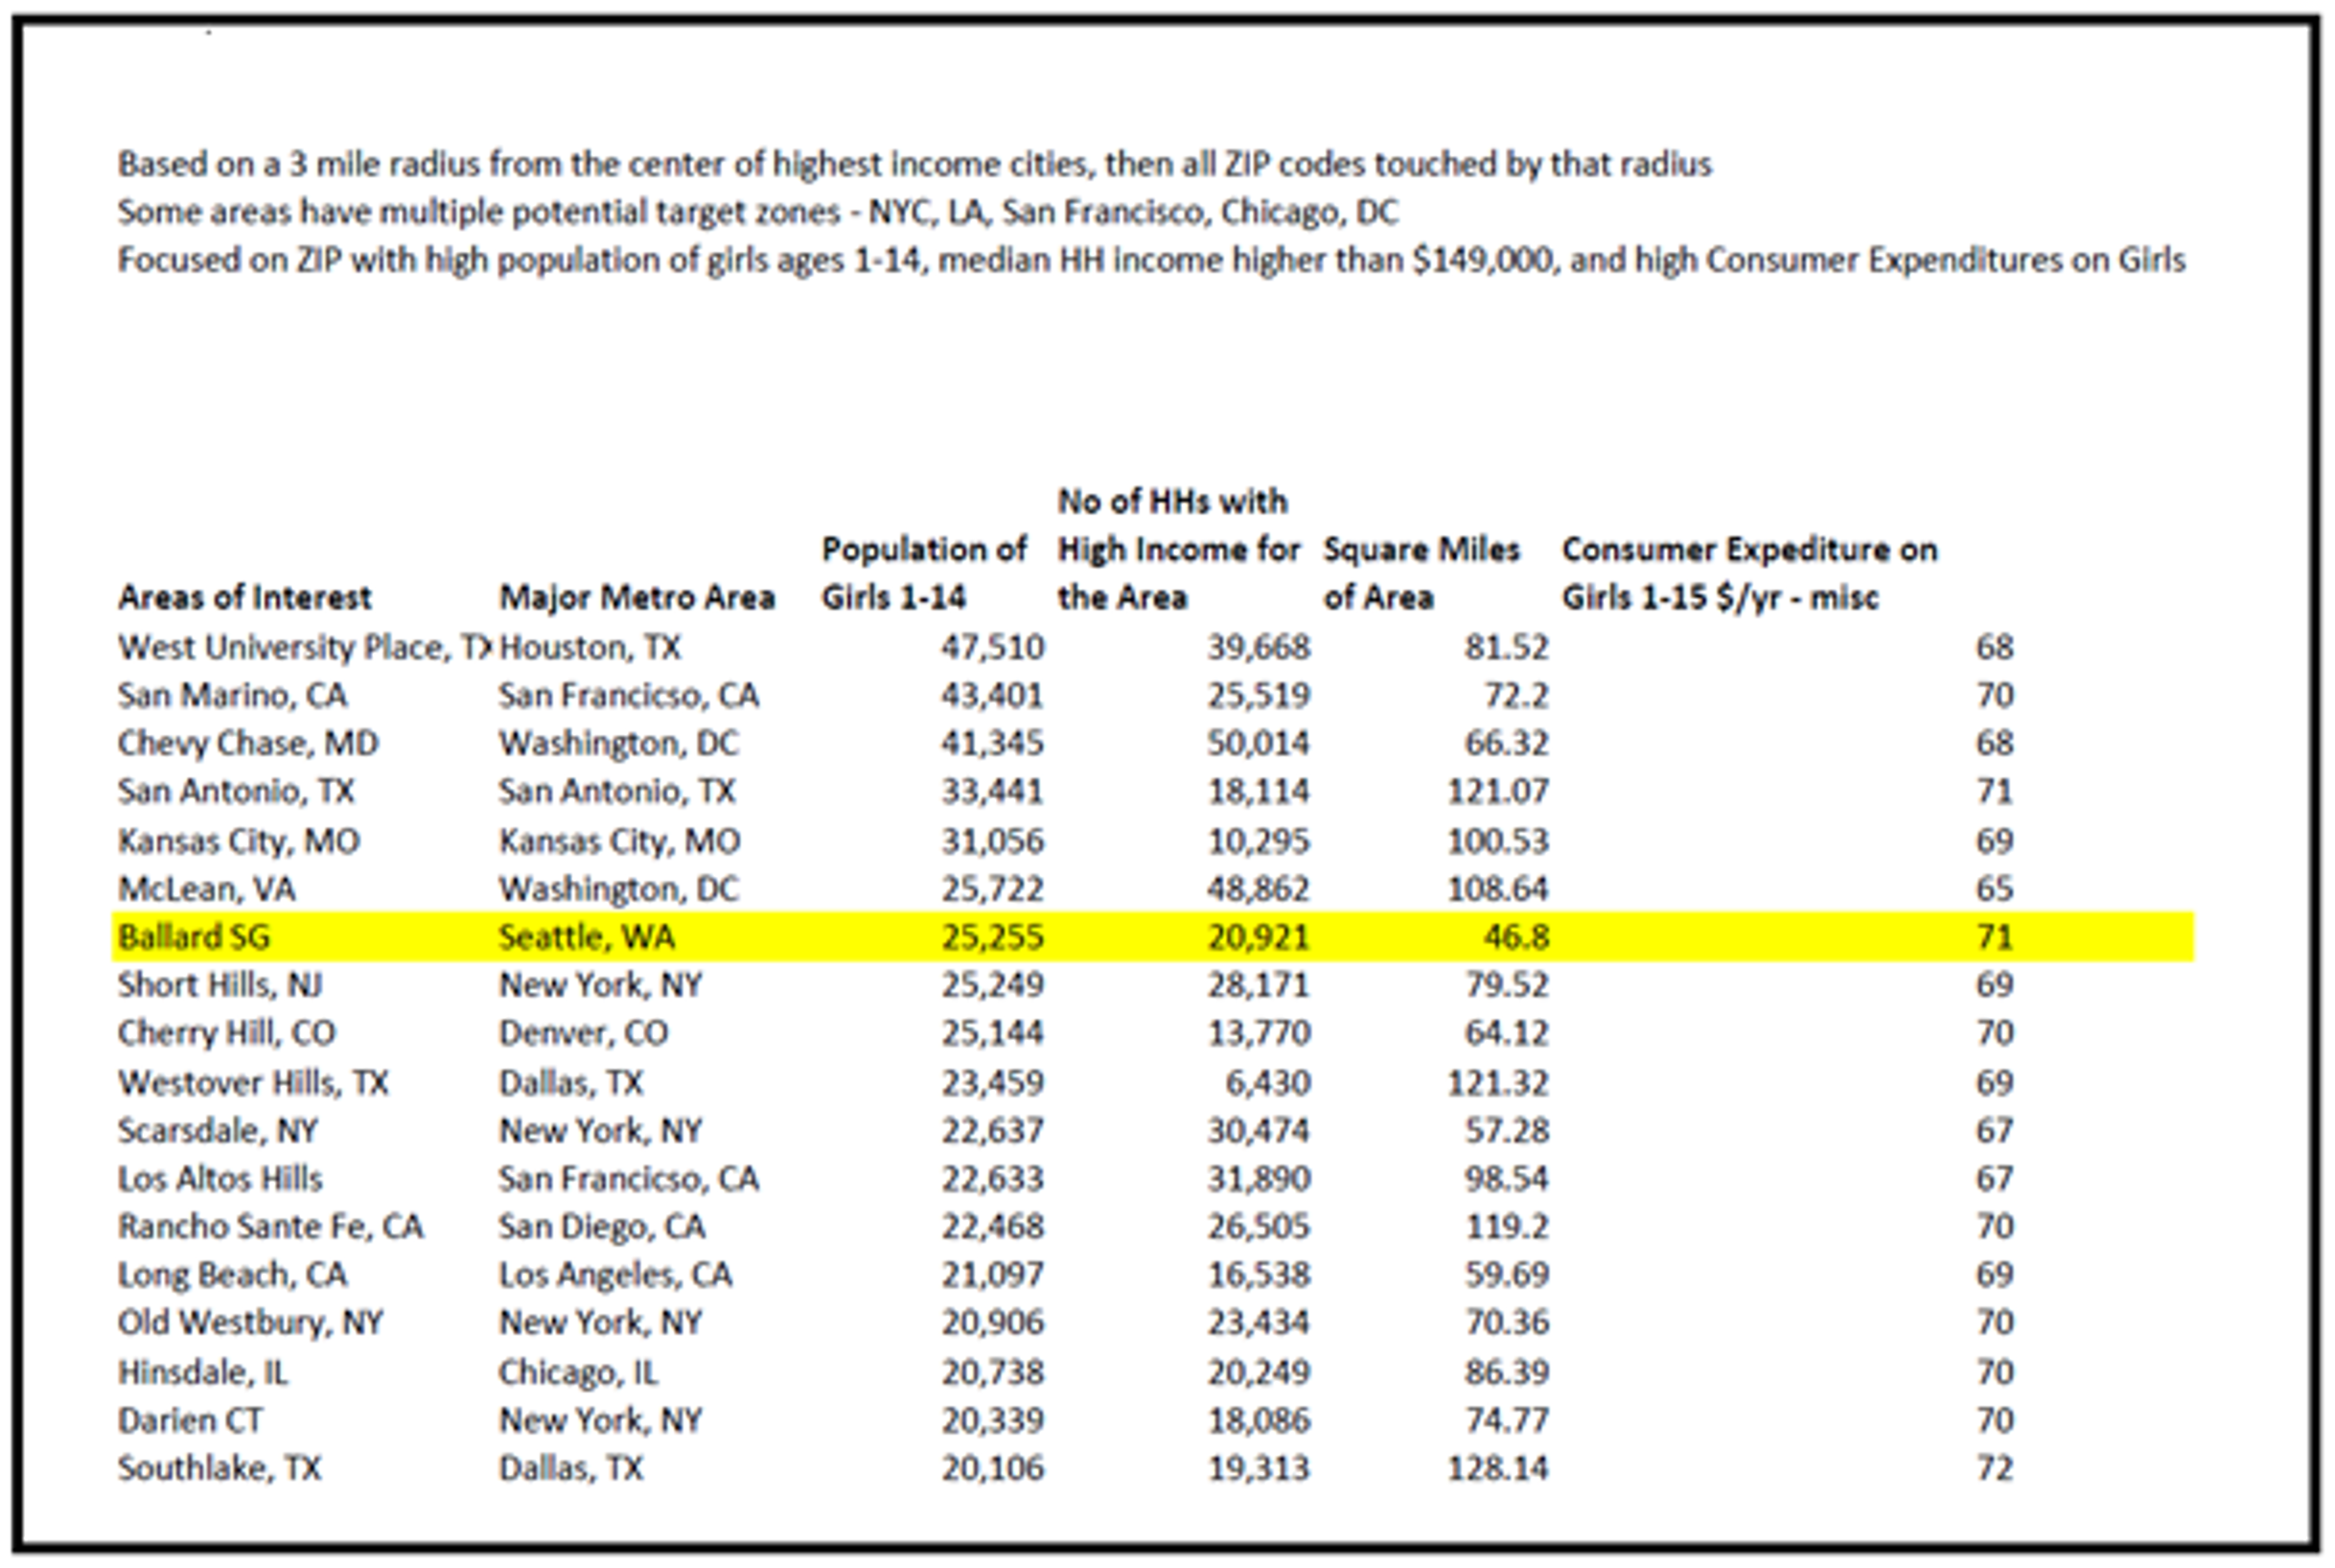
Using the top 127 cities as a baseline, MapBusinessOnline Pro Market Analysis tools were used to plot 15-minute drive time polygon searches around each city center simultaneously. Many urban areas had overlapping polygons on the map – an indicator that we had identified the most fertile ground for gymnastics centers. Choosing centrally located polygons for balance, a territory of ZIP codes was generated for the optimum city areas. A few urban areas had more than one territory to accommodate broader areas of high population and income – New York City, Washington DC, and San Diego have sprawling commuter feeder cities.
Each ZIP code-based territory view included an analysis/data view with the population of girls and the population of high-income households displayed as tabular data. The most lucrative territories had their ZIP code components adjusted up or down to optimize the population and income targets. Focusing primarily on the number of girls per territory, the city territories were ranked and then filtered. We ended up with twenty-eight best candidate cities list for a Seattle Gymnastic expansion.
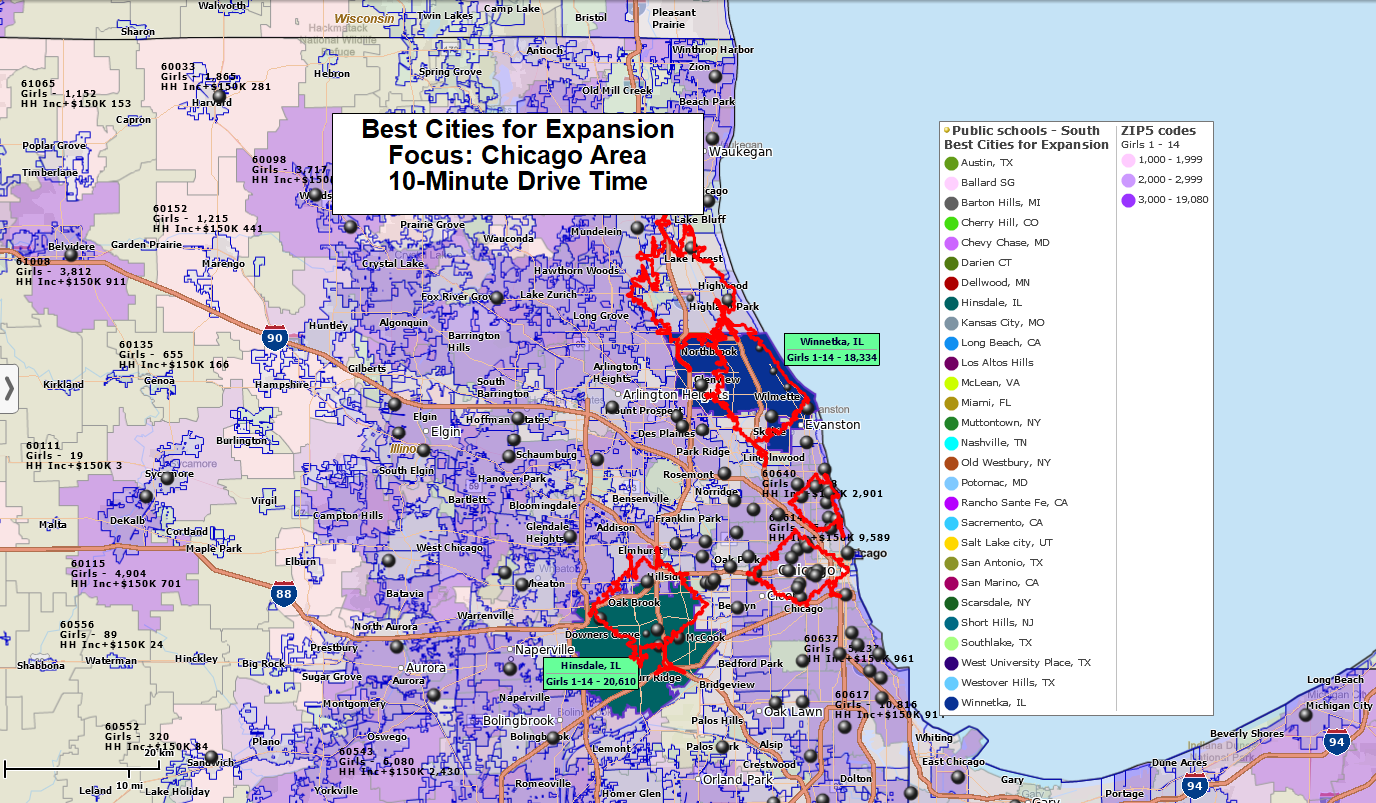
Chicago metropolitan area. Normal drive time in RED, rush hour drive time in BLUE. Two optimum territory recommendations using MapBusinessOnline Pro.
3. A Summary Report & Map Analysis
The results of the MapBusinessOnline Market Analysis suggested twenty-eight expansion city candidates. One of those cities happened to be Seattle, which was important for comparison purposes. It's always nice when your lab work confirms your hypothesis.
A summarized Market Analysis Report was exported out of MapBusinessOnline that included suggested territories for specific cities. An interactive web-map was available as were multiple map images at various zoom levels. The application itself, with the saved MapBusinessOnline market analysis, is also available for presentations either as MapBusinessOnline live use or as a shared map URL.
Results
MapBusinessOnline provided several market analysis perspectives that answered the initial question, where should SGA locate their next sets of service facilities? The map analysis final reporting included:
- A comprehensive and interactive map analysis highlighting the most viable cities for expansion
- An output report, with city-by-city details of optimum demographics supporting expansion
- The opportunity to continue to use the tool and add additional key data layers to the analysis, such as school districts, and other critical resources the SGA team might consider – low rent districts, cleaning services, etc.
A map-based market analysis will typically incorporate a variety of data inputs tied to locations on a map. A well-crafted geographic assessment presents overlays of demographic realities, business location data, organized driving time areas or radius searches, all overlaid against an accurate map of an area of interest. No other market analysis methodology provides such a detailed and visual perspective tied to the actual data.
The Seattle Gymnastics Chairman reviewed the results and was thrilled with the opportunities noted, many of which confirmed their gut instincts on what cities to expand to first, like Chevy Chase. But there were surprises too. San Antonio was one area that had not been considered but ended up as one of the twenty-eight filtered cities.
It's now up to the SGA team to pick their best four cities for expansion, taking into consideration competitive businesses, industry-related employee pools, and other industry factors.


