MapBusinessOnline newsletter – February 2021
Take Your Business Map to the Next Level - New Webinar on March 4, 2021
Please join our new webinar all about adding layers and data to your business map. We'll pick up where we left off on our last webinar and talk about some of the best ways to add value to a business map:
- Adding new Map Layers
- Adding relevant demographic information & business data
- Using Calculated Data Columns to update imported data
- Color-coding by Circles
Color-Coding MapBusinessOnline Territory Maps
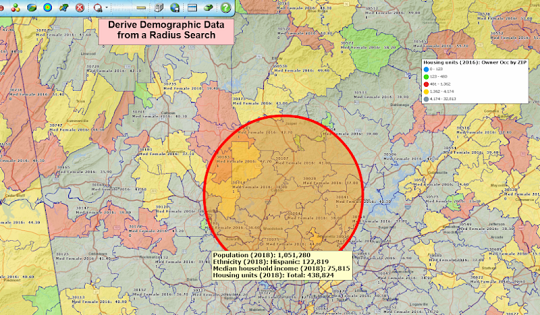
Sales territory maps in MapBusinessOnline can be color-coded to reflect related business data such as sales histories or demographic data layers, including population or median income for territory areas.
Business map users will find territory map color-coding useful for:
- Quickly communicating the most important territory element to map viewers
- Tying territory maps to Census Demographic data categories, which are often used to assign and balance territory alignments
- Creating color-coded territories based on imported business data. Imported sales or cost-of-goods-sold data can be motivating factors for sales territory users
Examples of why MapBusinessOnline users color-code territories:
- Sales Manager – Color-code by imported sales data to show sales activity by ZIP code or county, answering the question, "Where are my sales?"
- Franchise Marketer – Color-code franchise territories by availability, answering the question, "What franchise areas are available for sale?"
- Retail Sales Analyst – Color-code territories by population or household income. This process can define successful market area characteristics for profiling
- Political Analyst – Color-code Census tracts by the eligible voting population for planning and redistricting negotiations
- County Clerk – Color-code counties to show year-over-year population growth. Helps with tax planning
- Marketing Analyst – Color-code territories based on key demographic metrics to determine the most lucrative new markets for expansion
Color-coded sales territory maps define accountability and engage the map viewer quickly with the most critical data element highlighted. The below map displays large county-based territories, color-coded by median household income.
Read more about color-coding here.
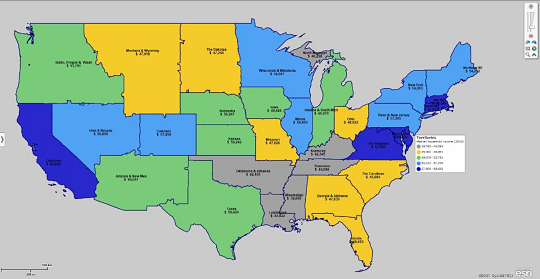
Territories Color-Coded by Median Income
MapBusinessOnline Tips & Tricks
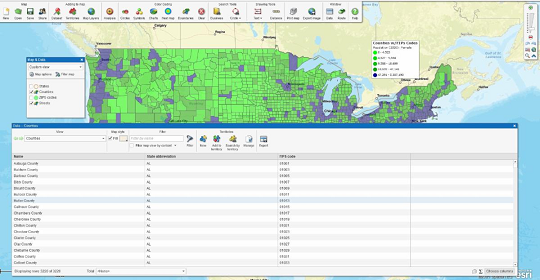
Extracting FIPS Codes – MapBusinessOnline State, County, and Census Tract layers include government-designated FIPS codes. MapBusinessOnline users can extract those FIPS codes for use outside of the application.
FIPS codes are government-assigned numbers used to organize administrative districts for analysis.
- In the Data Window, dropdown to the Map Layer containing the FIPS codes you'd like to export (Counties, States, or Census Tracts)
- Use the right-most button on the Data Window toolbar to export the map layer data as a CSV file.
You can also export the FIPS data layers by Territory:
- Once again, in the Data Window dropdown and select the Map Layer containing the FIPS codes you seek (Counties, States, or Census Tracts)
- Along the Data Window Toolbar, Click the Search by Territory, Yellow Puzzle Piece button.
- Choose from the export options listed.
- Use the right-most button on the Data Window toolbar to export the map layer data as a CSV file.


