MapBusinessOnline newsletter – June 2020
Political Mapping with MapBusinessOnline
Sometimes I read demographic data statistics and they stay with me. In thinking about a subject for this month's blog I researched some of the Census Bureau data on voter registrations. Specifically, I wanted to show some information by Congressional District. After all, it is a Presidential Election year and MapBusinessOnline does include the Congressional District Map Layer.
In looking at the state of Maine congressional district voter characteristics, I was struck by the fact that the second congressional district – the one up north – showed that 9% of the voters did not have a High School degree.
I pulled up MapBusinessOnline and by using Calculated Data Columns I was able to approximate that calculation across all US congressional districts. I had to use 2017 Demographic Data, which more closely matched the Census Bureau voter data. Our two most recent year layers are projections and that skewed my initial results.
What I found was that it is not unusual across the nation to show districts with 10% of the voters lacking a high school degree. Food for thought, I guess.
Conducting the same analysis over a fifty-year period might be interesting. Read more in this month's blog on Demographic Data in politics.
And here's a link to the Census Bureau's voter data.
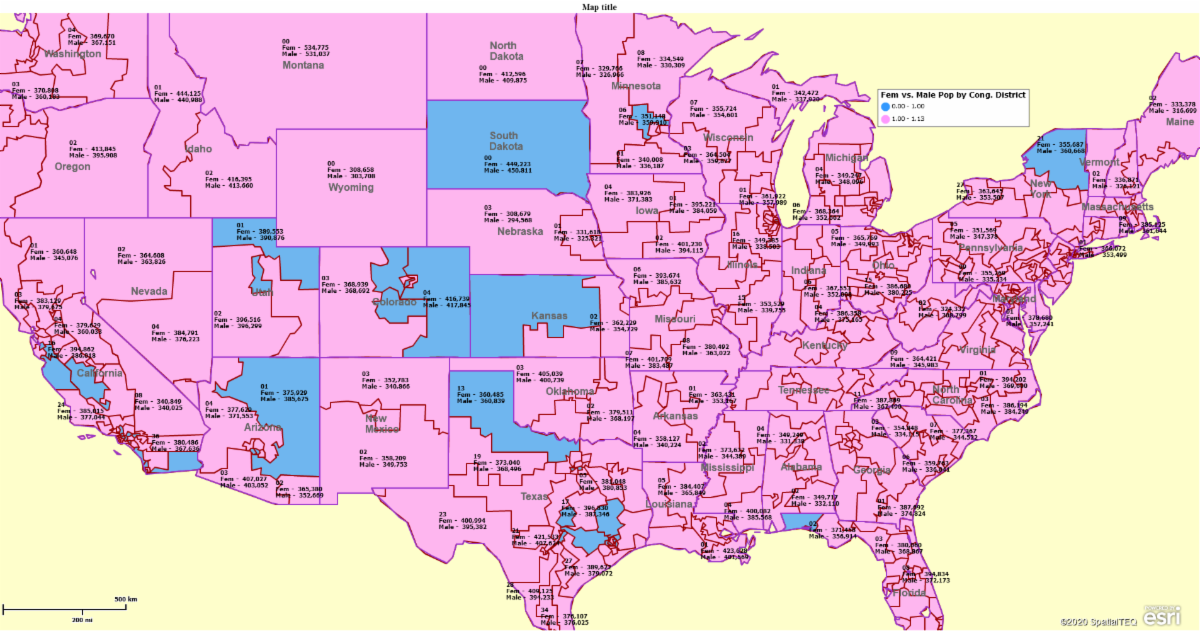
The sample map below shows all districts in pink where female registered voters outnumber male registered voters.
Adobe Flash Player Obsolescence Update
Access to the Web Browser Version of MapBusinessOnline
As most of you know by now, at the end of 2020 Adobe will be cancelling support for Adobe Flash Player. Consequently, MapBusinessOnline developers have secured better ways to render your business maps.
First and foremost, make sure to download the MapBusinessOnline Map App. Available for Mac and PC this pathway for accessing your business mapping is the optimum user experience. It is what Jason and I use every day. Remember, the Map App:
- It's included with your subscription
- It negates the need for Adobe Flash Player
- All your friends are using it!
- Extremely fast install download
- It's still a cloud-based service requiring Internet access
- Download the Map App here
This month we will release a free, downloadable app for free viewing and map sharing. This means the shared map experience will improve for your view-only audiences. They will no longer have to update Adobe Flash Player to view a shared map.
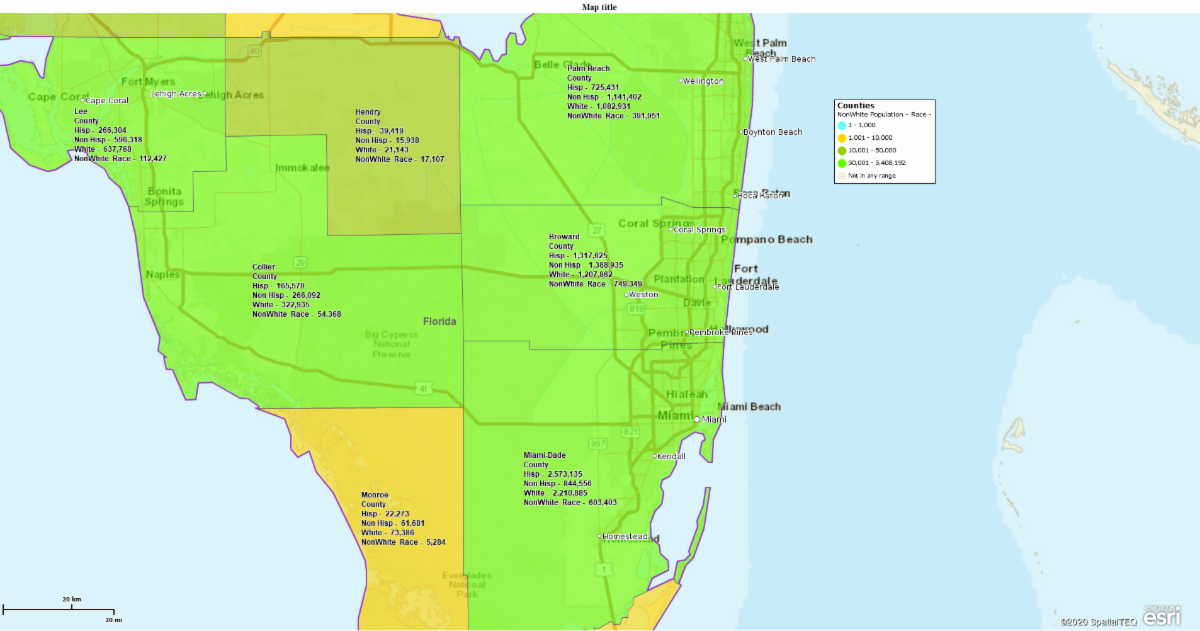
Another political map below. This one begins to show ethnicity and race differences by County.
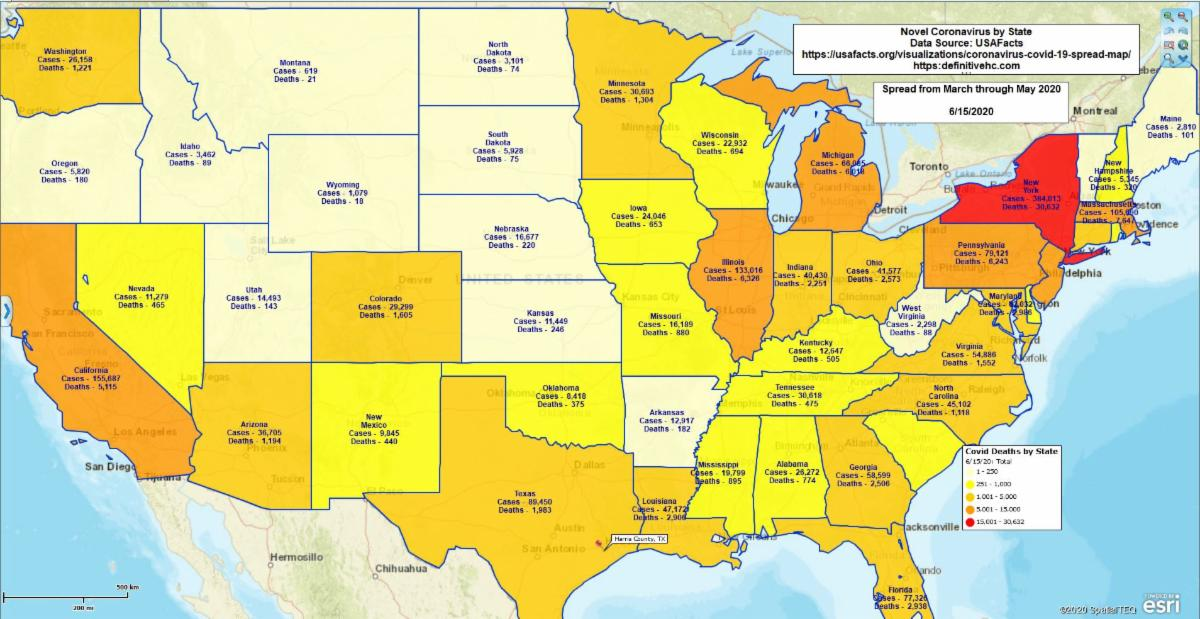
MapBusinessOnline Tips & Tricks - What I Learned Posting a Daily COVID Map
Recently, I've had to post a daily map. Doing it every day, more or less, forced me to get efficient at the process. Here are some of the tips I learned:
- Every so often, delete the old datasets you've imported into MapBusinessOnline. Limiting data layers reduces chaos on the map
- Focus on your core data points and make sure to highlight them the same way with every map. For this map I shows Deaths by State visually and total Cases by State Labels. I haven't, for example, introduced testing
- States have been color-coded by the number of deaths. I found yellow shades, to orange shades, to bright red lent the appropriate level of intensity to the map
- I reimported the data daily and reconfigured the color shading manually without a Unique ID auto process. I did this because of the nature of the data. It didn't lend itself to auto updates
- Keep Map Title, Legend Text, and other map text concise and to-the-point. Change only the date, if possible. Keep your map content brief