Print Large Format Map Documents
Create a Large Custom Printable Map
Business mapping software users often communicate with maps. And sometimes a really big printable map communicates the big picture most effectively. MapBusinessOnline includes the ability to save your map view in a PDF format to print large format wall maps.
Typical uses of large format wall maps are call center environments that want to show field sales rep locations or sales activity across the USA; public safety emergency processes like missing persons search results or emergency resource locations; or natural resource planning operations describing energy resources over a large area.
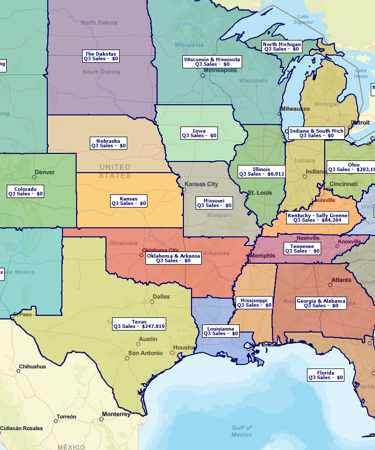
Print Large Format Maps to Show Customers, Sales Progress, Market areas, or Territory Assignments
MapBusinessOnline business mapping software provides a flexible method of saving your large map view to a PDF. Choose between a what-you-see-is-what-you-get print preview or a print based on a hand drawn rectangle preview. Either way, you can easily establish just the right perspective for your target map area before you commit to a plotter print.
Take your finished PDF file to a graphics specialist, your plotter department or a FedEx Office shop to get your final map for hanging.
Print large format maps. Export large printable maps in Adobe® PDF format. No need for expensive equipment. Print large maps on multiple pages with your home or office printer. Print compelling wall maps up to 5 feet x 5 feet in size.
- Create business maps using your imported business data, Census demographic data, or 3rd party business data.
- Symbolize and color-code your map data as required.
- Choose the zoom level that sets the appropriate level of detail for printed map.
- Choose the map size that establishes a bounding regional rectangle in portrait or landscape print view and includes your target business data.
- Choose “Save Map as PDF” print option. Select from paper preferences, adjust margins, and choose plotter or multi-page printing options.
See MapBusinessOnline in Action
Request a demo
Learn How Our Customers are Succeeding with MapBusinessOnline
Billy Taylor of Stop Hunger Now, one the world’s great nonprofit organizations said:
"Thanks for the great product, I use it all the time in our non-profit."
Billy and his team use MBO to create regional lists from their organizational data. MBO is a great data segmentation tool supporting market analysis. Users can segment data geographically and append a variety of data layers to exported results.
Billy Taylor
Director
Stop Hunger Now


"This software is a game changer for me in the workplace. Easy to use tools and a fast system to do the job efficiently and effectively every time. I’ve been able to build more territories with confidence, bringing my team more growth opportunities for 2019"
Daina C.
Franchise Development Manager
Amada Franchise, Inc.


"We used MapPoint for years and desperately needed a replacement solution. This one fits the bill and is actually much better in many ways. Especially in a team environment. We do logistics with routing technicians to jobs for roll outs. This helps our team working thousands of sites over multi month projects. Also, easy to manage licenses for users.
Example business case would be taking 3000 locations, and planning how you will have multiple different technicians visit an area or region of these locations over 3 months. Each visit will take x amount of time. They only work certain hours of the day, and you have to plan in drive time, so the day actually makes sense and the route is efficient."
Jay Walker
IT Director
Network Engineering Technologies
Popular MapBusinessOnline features
Print large format map views

Print large maps to use in presentations and project plans. Save maps as PDF files to print as large as 60” x 60” customer maps. Supports multiple pages option to use your home or office printer for large wall maps.
Create state or regional map views

Filter map view to show only selected states or regions. Create local maps that display only certain counties or ZIP codes from your market area or within a radius.
Build fast map visualizations of your business data

Map business data from various sources by street address, city name, ZIP code, or latitude and longitude. Plot 250,000 or more locations on a map at once. All you need to start is a spreadsheet with business data.
Visualize business data on map with various symbols

Assign specific symbols, colors, and sizes to your data points on map. Choose from a wide variety of symbols or create your own. Visually define customers and prospects across multiple locations using symbols color coding.
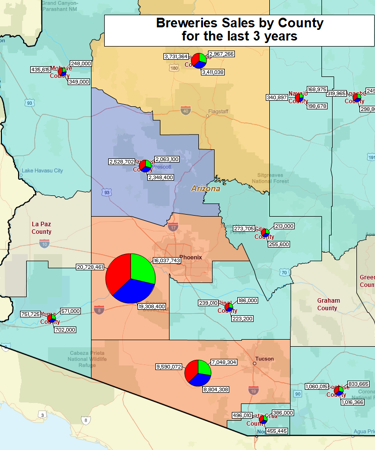
Illustrate business data on map with charts

Graphically depict your business data on a map using pie or bar charts. Use charts to show sales by product, invoices due vs. paid, products ordered vs. shipped, and sales by customer demographics.
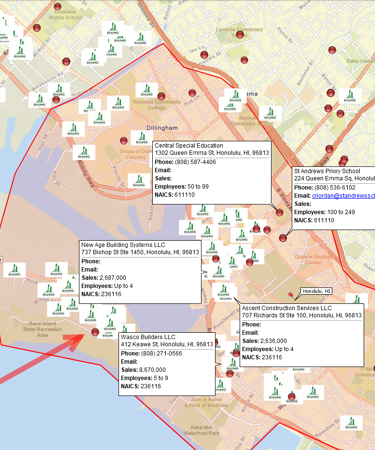
Label your business data using flexible callouts

Show more than one callout on map at a time. Add notes to individual map callouts. Change callouts orientation for better map layouts. Customize callouts look & feel.
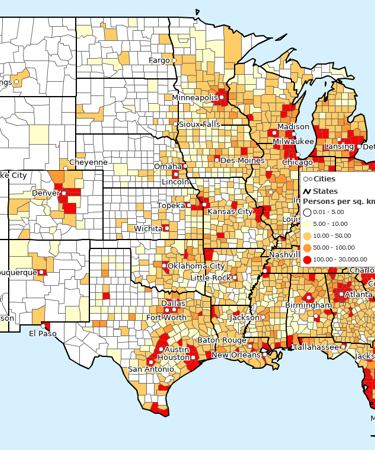
Color code maps by ZIP code, county, or state

Import business data by ZIP code to show it geographically. Create colorful maps for business analysis that connect real Census data to locations on the ground.
Design and visualize sales territories

Use our sales territory mapping software to create sales territories by ZIP code, county, or state. Aggregate demographics and sales data by territory. Search business data inside sales territories. Highlight territory overlap.
Display business data against demographic maps

Categorize geographic areas by population or household income. Explore new markets, business patterns, or social trends against color coded Census maps for business and competitor analysis.


