Build Your Demographic Maps with the Leading Business Map Software
Don't Miss the Benefit of Demographic Maps
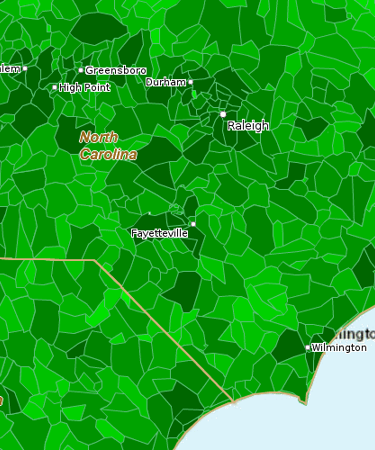
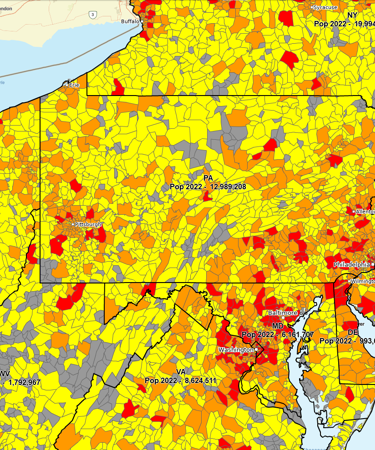
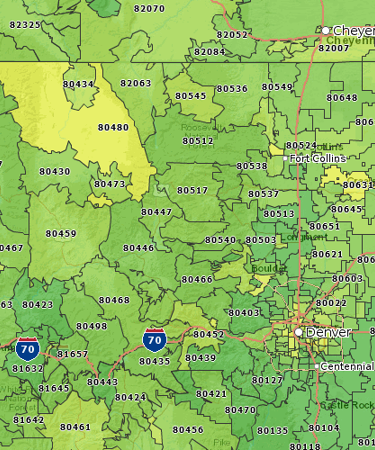
In today's highly competitive business environment, you need to take advantage of every tool at your disposal to establish and maintain an edge in the marketplace. Make better decisions with demographic mapping software. MapBusinessOnline includes population, household income, and other demographic data by ZIP code or county. Compare your sales numbers, mail response rates, or fund-raising efforts against demographic maps and identify previously hidden opportunities and potential challenges.
Use Our Demographic Mapping Software to:
- Build color-coded demographic maps by ZIP code, county or states to highlight demographic data trends.
- Choose between population, income, household, economic and other data compiled from various sources. Learn more…
- Build demographic maps using purchased and licensed 3rd party data sources to explore specific vertical industries, retail or medical data.
- Import your business data: customers, sales or fund raising, and display that information on the map.
- Compare your business data to household income and other demographic data by ZIP code to reveal market opportunities.
- Find places for new stores or service locations. Explore new markets and expand your business.
- Query ZIP codes that have the same demographics as your current user base.
- Share maps views through map presentations, printed maps, or interactive map views.
- Export demographics data to use in other marketing and sales planning programs.
Use Location Awareness to Enhance Your Business Intelligence
Use MapBusinessOnline software for demographic mapping by ZIP code, or create color-coded Census tract maps for business planning. By plotting key demographic data on a map, you can more easily visualize the customer, prospect, sales and resource locations in your critical business area. Let a digital map inform your business planning strategies. Leverage the power of location in your business planning.
Choose Demographic Mapping Software from MapBusinessOnline
Mapping demographics by ZIP code, county or state is a powerful tool for your business. MapBusinessOnline software makes demographic mapping a simple process. We offer a wealth of free demographic data options that can be customized to meet your specific requirements. We value the input of our customers and do our best to incorporate our customers' feature suggestions. You aren't going to find any other mapping companies that pay closer attention to feature requests than MapBusinessOnline!
Our nearly two decades of experience enables us to provide superior business mapping solutions backed by world-class one-one-one technical support. At our prices we make demographic mapping software solution highly affordable.
Interested in taking our demographic mapping software for a test drive? Start using MapBusinessOnline without risk by taking advantage of our no-obligations FREE trial today!
See MapBusinessOnline in Action
Request a demo
MVP Sports Clubs is a sports and health facility management and development company with operations in Central Florida and West Michigan. MVP uses MapBusinessOnline to construct demographic map profiles of a radius surrounding each of their many sports clubs. Such market analysis helps MBO users develop a better understanding of their business which makes strategic planning more effective.
"MBO users develop a better understanding of their business which makes strategic planning more effective."
Mark Hope
Business Manager
MVP Sports

Prison Fellowship — Prison Fellowship® trains and inspires churches and communities-inside and outside of prison-to support the restoration of those affected by incarceration. PFM uses MapBusinessOnline Team Edition to create a variety of maps that track the placement of constituents and describe the demographic background of placement areas for further study and understanding.
"We love MBO, especially the ability to share maps with non-license holders for viewing!"
Business Manager
Prison Fellowship


"I have had the pleasure of using MapBusinessOnline for the past 5 years and it is an excellent and affordable tool for my clients. I am a franchise consultant, and many of my clients are just starting to get into franchising. The first main question many of them have is they don’t know the demographics around their current location, so they don’t know how to create territories for their franchisees. I am able to easily utilize MapBusinessOnline to draw a prototype territory around their existing location, do a deep dive into the many different demographics that MapBusinessOnline offers, and help the client determine the basics of their new territories, including mileage, population, household count, purchasing habits and age distributions. This tool has been so helpful that many of our clients obtain their own accounts as they begin to sell franchises and grow their business. Thank you, MapBusinessOnline, for providing such a helpful tool that is affordable and easy to use!"
Colette Bell
Director of Business Development
SMB Franchise Advisors
Popular MapBusinessOnline features
Display business data against demographic maps

Categorize geographic areas by population or household income. Explore new markets, business patterns, or social trends against color coded Census maps for business and competitor analysis.
Color code maps by ZIP code, county, or state

Import business data by ZIP code to show it geographically. Create colorful maps for business analysis that connect real Census data to locations on the ground.
Search business data in full-featured tabular view

With our demographic mapping software, you can filter business data by the demographic criteria that most directly affects your business and view your search results on an accurate webmap.
Share business maps

Create interactive maps and share with friends, colleagues, dealers, customers, prospects or vendors. Share territory maps. Email saved JPEG and PNG files or embed map files in PowerPoint presentations. Includes PDF export for larger print formats.
Generate demographic reports and maps for a radius

Setup target area by radius or rings and create demographic maps and reports to help reveal new business opportunities.
Use radius & demographic maps to create marketing campaigns

MapBusinessOnline demographic mapping software allows you to conduct spatial and demographic customer searches and organize your search results into exportable marketing lists.


