Web Maps for Market Analysis
to Start Using Maps in Market Analysis – Take a FREE Trial
Using our interactive web maps for market analysis offers a number of important business benefits including:
- Customer data visualizations against ZIP code demographics to better understand where marketing efforts are working and where they are not.
- Create business maps that help you more clearly identify marketing opportunities – like where you are not doing business.
- More accurately determine the size of a specific market and evaluate its growth potential.
- Deploy all available sales/marketing resources based on sales results by area.
- Expose niche markets that provide excellent opportunities for duplication elsewhere.
- Compare of your current business data with demographic data to help determine appropriate sales activities.
- Assign stock or custom symbols to help you clearly identify categories in your data points.
- Identify specific marketing areas by drive time polygons that reflect sales people and customer drive times.
- Gauge the effectiveness of a specific marketing strategy or campaign by ZIP code, county or other map layers.
- Create radius searches of data around specific population centers to enhance market segmentation and develop marketing campaigns.
- Develop sharable maps that improve collaboration among your team and colleagues.
- Determine areas where your business locations could be vulnerable to competitors attempting to steal your market share.
- Increase your location awareness by using maps to visualize the prospects, customers, sales and resources around specific business locations.
Supplement Market Analysis with Fresh, Location-Based Perspectives
Recently a longtime, deeply experienced marketing vice president said, “When business is good, sales gets the credit. When business is bad, marketing gets laid-off.” While such insights may have a measure of truth to them, it is a fact that consistent marketing will drive sales. Even in a down economy marketing can expose niche markets where targeted sales efforts can be best leveraged. Marketers do this through detailed market analysis of demographic segments, by testing customer lists and prospect lists, and in some cases by thinking about markets geographically. Business mapping applications, now available at very affordable rates, can supplement market analysis with fresh, location-based perspectives, perhaps exposing that competitive edge to help your company increase sales and keep the marketing people from getting laid-off.
Today’s mapping tools are becoming cloud based services offering features that would have been reserved for premium desktop map applications just a few years ago. Google Maps and Google Earth helped commoditize the web mapping industry and democratize the use of web maps for all. Add to this the fact that a cloud service has minimal impact on any IT department, and a savvy marketing manager should seek to leverage powerful location-based software tools to her advantage.
Visualize Your Business
It all starts with you list of customers. An accurate and up-to-date customer address list is all you need to leverage that primary web map advantage. Your CRM software typically exports contacts as an Excel spreadsheet or CSV file. Import your contact spreadsheet into MapBusinessOnline and visualize your customers against a map view.
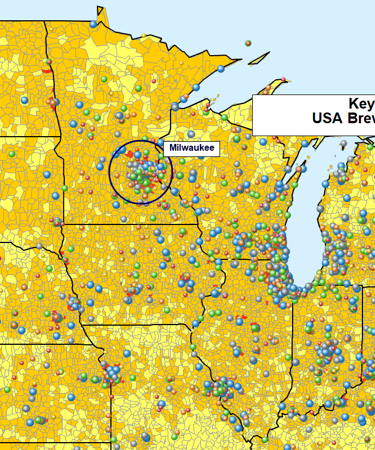
Once imported, sit back and view your customers. Think about where they are located. Change the map background to reflect different map views – zoomed-in, full nation view, county maps, or ZP code maps. Are your contacts clustered in certain urban areas, while absent or widely scattered in other areas? What does that tell you about your business? Can you find data about your competitor’s geographic placements?
Now import your sales dollars by region. Display these views against your mapped customer list. It should make sense. Are there anomalies? What do they mean?
All imported data can be symbolized and color-coded to enhance its effective visualization. Show customers in green and prospects in blue. Display and symbolize important resources to your target market, for example, hospitals and clinics within 25 miles of a long-term care center. Web maps worth your time will provide easy visualization tools that make your data tell a story quickly and easily.
Supplemental Business Data
US Census Bureau demographic data may be free or reasonably affordable through a variety sources. A good web map service will provide key demographic information to supplement your map views. When you view your customer sales information against a metro area map displaying population densities does the correlation indicate proper sales coverage? What happens when you introduce a spreadsheet showing your competitor’s market strengths?
As you can see, with just these very basic map visualizations market analysis begins to expose patterns and trends in your data. The more accurate and pertinent your imported data is, the more information you will be able to derive. Complementary published business datasets for mapping include retail sales data, employment statistics, and home values. Specific industry data is usually available to expose opportunities in your core business areas.
Sales Data & Radius Maps
Customer sales data viewed geographically may suggest new locations that are worth testing. For instance, a successful campaign in Boston might indicate opportunities in Albany, New York City and Portland, Maine. Viewed geographically, business data will suggest natural territory segmentation that can help organize your business. Territories can be created easily based on ZIP code, county or state segmentations.
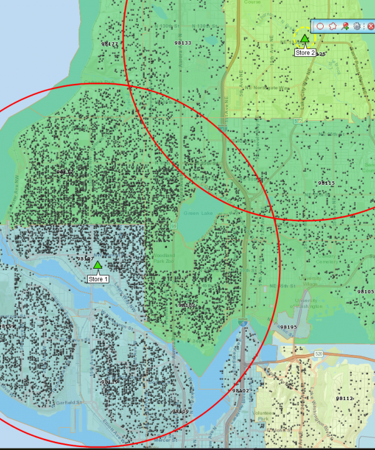
A purchased list of prospects might cover the entire country. With a web mapping application, you can import that list of addresses and create radius searches of the data around population centers. Then you should be able to export that subset data list into Excel for use in third party marketing software. Marketing messages can be tweaked based on location, or events can be advertized within a specific driving distance of the event location. Location is leveraged to improve response rates while controlling costs.
Share Maps
Once you’ve created a map based on your business data, use it to make your point in marketing analysis and sales presentations, or during business meetings. Nothing tells a story like a map. Business mapping applications let you save map views as JPEG, PNG, PDF files, or URLs. This makes it easy to embed the map view in a Power Point presentation or to print a large formatted version of your map to hang on a wall. Picture a busy call center where phone reps need to quickly decide which outside sales person to assign customer visits to. A quick look at the wall map will answer that question.
People love maps. And you never know; your boss might put a hold on the next marketing lay-off when she sees the map you provided for the presentation. Who knows, the right map could even lead to a promotion.
Affordable market analysis maps to inform your business, right now.
Get Started with MapBusinessOnline Risk-Free
Register online for a FREE trial today!
Learn How Our Customers are Succeeding with MapBusinessOnline
"I had an excellent experience with MapBusinessOnline because my company works in the agriculture industry and makes maps showing where our fields are and these maps need to be viewed and shared in a database. Your product seemed to fit our needs. Overall good support, ease of use, and quality of maps created!"
Seneca Foods


"This software has been tremendously helpful in mapping out my company’s sales territories map. I have researched many other products, but no one came close to the ease of use of data customization options MapBusinessOnline provides. Also, their maps are extremely accurate and pleasing to the eye. Sales projections and territory expansions can be easily mapped out with this software. Most importantly, they provide free training and a vast number of video guides that have been extremely helpful. It is apparent that this company cares about their product and their customers. Really happy with it."
KC Cooley
Credit Manager
Crediauto Financial


"MapBusinessOnline is the only tool available that allowed our team the ability to create visual territories by zip code and then export the data into a spreadsheet. We were able to then populate our ERP system with that data/logic and create automated rules based on customer address zip codes. We cut out the manual process of inside sales entering incorrect freight delivery zones upon sales order entry. Now when sales orders are entered, we automatically populate the correct delivery zones that MBO allowed us to create. Ultimately, this is saving our company money and improving efficiency when shipping material to customers.
I highly recommend MBO, and we only have scratched the surface with what the solution can do."
Patrick Kloiber
Business Intelligence Manager
Palisades Holdings, Inc.
Popular MapBusinessOnline features
Perform market analysis for multiple sites

Search & segment data from multiple centers. Generate market area profiles. Find nearest store or pick up locations. Batch calculate distances, as well as driving times to multiple locations. Aggregate demographic data. Enrich a dataset with demographic or geographic variables.
Build fast map visualizations of your business data

Map business data from various sources by street address, city name, ZIP code, or latitude and longitude. Plot 250,000 or more locations on a map at once. All you need to start is a spreadsheet with business data.
Add drive time polygons to your market analysis tools

Create drive time polygons to identify actual market areas by hour of day and day of week. Explore your data within drive time areas. Improve direct mail campaigns.
Visualize business data on map with various symbols

Assign specific symbols, colors, and sizes to your data points on map. Choose from a wide variety of symbols or create your own. Visually define customers and prospects across multiple locations using symbols color coding.
Color code maps by ZIP code, county, or state

Import business data by ZIP code to show it geographically. Create colorful maps for business analysis that connect real Census data to locations on the ground.
Illustrate business data on map with charts

Graphically depict your business data on a map using pie or bar charts. Use charts to show sales by product, invoices due vs. paid, products ordered vs. shipped, and sales by customer demographics.
Emphasize customers density with heat maps

Highlight market areas that generate more business. Visually compare map areas for business potential. Select from a variety of heat map colors and options.
Use maps to create marketing campaigns

Search potential customers spatially and by demographics. Organize search results into marketing lists. Export marketing lists in Microsoft® Excel spreadsheets.
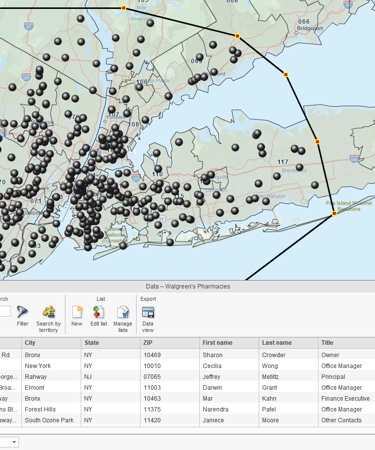
Search business data in full-featured tabular view

Search your data records by business name. Sort data view by any variable. Filter data by custom criteria. View search results on map.
Search data spatially with radius maps

Explore your data within circle or polygon areas. Organize search results into marketing lists or market areas. Export ZIP code demographics, territories, or marketing lists in Microsoft® Excel spreadsheets.
Create powerful reports and presentations with maps

Embed map images into reports. Use interactive maps for effective presentations. Export map as PDF to create large wall maps.


