Display Intuit QuickBooks Data on a Map
Put Your Customers and Sales Data on a Map
If you’re one of the many businesses that rely on Intuit QuickBooks, you’re in good company and well positioned to turn your customer and sales data into clear business maps with MapBusinessOnline:
- Color-code, create heat maps, customize symbols and labels. Get visual insights on sales trends and patterns.
- See where your best customers are concentrated and where sales are underperforming.
- Filter, aggregate, and segment customers to build targeted marketing and sales lists.
- Search your customer list by radius or drive-time area.
- Conduct market analysis by comparing sales with population, income, and other demographic variables.
- Plan efficient multi-stop routes to visit customers.
- Share interactive maps and reports with your team to improve planning and operations.
Import Thousands of QuickBooks Data Records
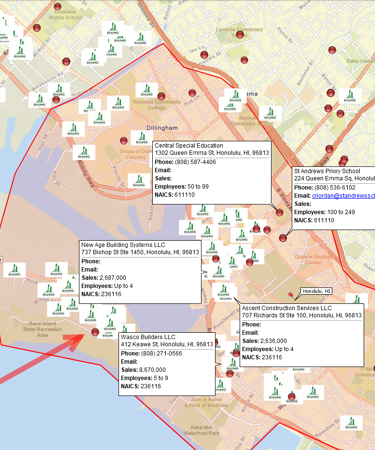
MapBusinessOnline lets you quickly plot hundreds of thousands of customer, employee and vendor locations on an insightful color-coded map.
Use QuickBooks reports to export customer, employee or vendor contact lists and sales data as CSV files, then import them into MapBusinessOnline in just a few clicks. You can combine multiple datasets on one map to get a complete view of your customers, vendors, sales and operations.
Important - Include separate address columns in your QuickBooks export: street, city, ZIP, state, and country. MapBusinessOnline needs these fields to place locations accurately on the map.
See MapBusinessOnline in Action
Request a demo
Learn How Our Customers are Succeeding with MapBusinessOnline
This leading national footwear brand manufacturer uses MapBusinessOnline to conduct retail coverage assessments nationwide. They loved MBO’s ability to provide both street level detail and USA wide high level views of points-of-sale. Importing location enabled address databases for symbolization and color shading is easy. New and planned stores can be added to the map market analysis as products are launched and mature.
"Importing location enabled address databases for symbolization and color shading is easy."
Todd Eichelberger
Sales Director
Adidas

DPS is the leading provider of timely, relevant and motivational promotional materials for automotive dealerships. Their business strategies drive customer loyalty and sales revenues. Their sales manager uses MBO to create and manage sales territories and describes MBO this way,
"The product is phenomenal and the support even better."
Dealer Product Services (DPS)


"We used MapPoint for years and desperately needed a replacement solution. This one fits the bill and is actually much better in many ways. Especially in a team environment. We do logistics with routing technicians to jobs for roll outs. This helps our team working thousands of sites over multi month projects. Also, easy to manage licenses for users.
Example business case would be taking 3000 locations, and planning how you will have multiple different technicians visit an area or region of these locations over 3 months. Each visit will take x amount of time. They only work certain hours of the day, and you have to plan in drive time, so the day actually makes sense and the route is efficient."
Jay Walker
IT Director
Network Engineering Technologies
Popular MapBusinessOnline features
Build fast map visualizations of your business data

Map business data from various sources by street address, city name, ZIP code, or latitude and longitude. Plot 250,000 or more locations on a map at once. All you need to start is a spreadsheet with business data.
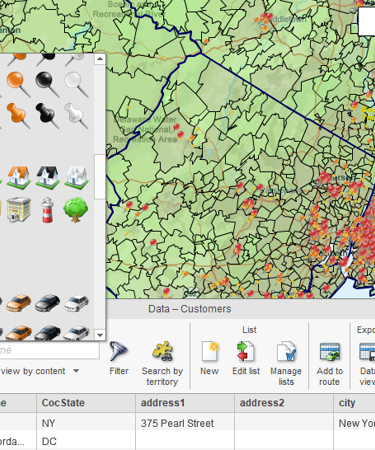
Visualize business data on map with various symbols

Assign specific symbols, colors, and sizes to your data points on map. Choose from a wide variety of symbols or create your own. Visually define customers and prospects across multiple locations using symbols color coding.
Color code maps by ZIP code, county, or state

Import business data by ZIP code to show it geographically. Create colorful maps for business analysis that connect real Census data to locations on the ground.
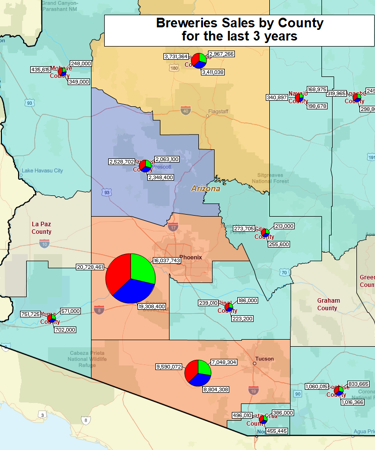
Illustrate business data on map with charts

Graphically depict your business data on a map using pie or bar charts. Use charts to show sales by product, invoices due vs. paid, products ordered vs. shipped, and sales by customer demographics.
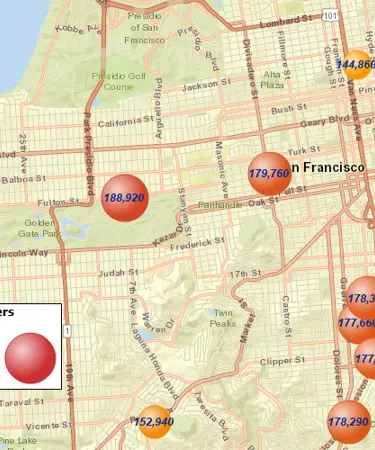
Emphasize customers density with heat maps

Highlight market areas that generate more business. Visually compare map areas for business potential. Select from a variety of heat map colors and options.
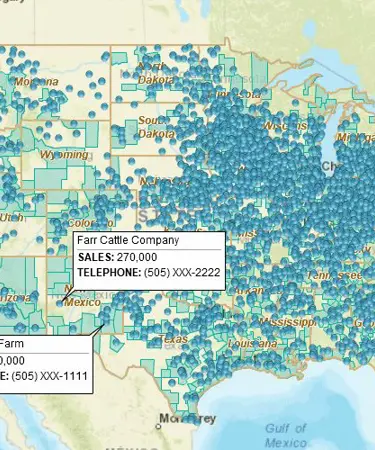
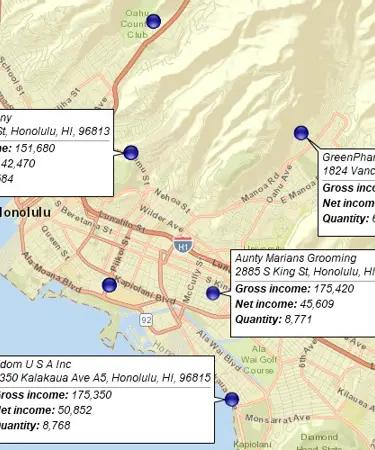
Label your business data using flexible callouts

Show more than one callout on map at a time. Add notes to individual map callouts. Change callouts orientation for better map layouts. Customize callouts look & feel.
Draw custom graphics and annotate maps

Draw circles, rectangles, polygons, and lines. Choose from a selection of line styles and fill colors. Identify map locations with text. Draw market areas and sales territories. Customize your business map.
Create powerful reports and presentations with maps

Embed map images into reports. Use interactive maps for effective presentations. Export map as PDF to create large wall maps.
Share business maps

Create interactive maps and share with friends, colleagues, dealers, customers, prospects or vendors. Share territory maps. Email saved JPEG and PNG files or embed map files in PowerPoint presentations. Includes PDF export for larger print formats.
Search data spatially with radius maps

Explore your data within circle or polygon areas. Organize search results into marketing lists or market areas. Export ZIP code demographics, territories, or marketing lists in Microsoft® Excel spreadsheets.
Search business data in full-featured tabular view

Search your data records by business name. Sort data view by any variable. Filter data by custom criteria. View search results on map.


