Calculated Data Columns
In MapBusinessOnline you can define new data column as a function of other existing data in a map layer or dataset. It works like an Excel formula except that in MBO you define the formula or script once at the data column level and not at each cell level. We call the formula-based columns Calculated columns. In the article we present several examples of calculated data columns such as custom age ranges and market penetration. We also demonstrate how to use MBO script language to define calculated columns with non-trivial logic.
Custom age ranges
MapBusinessOnline features a rich set of demographic data variables. Some variables are collected by a segment like age or income range. What if you need to combine several segments for your market analysis? For example, your typical customers are 20 – 29 years old, but MapBusinessOnline offers population data for 20 – 24 and 25 – 29 age segments separately. Silver bullet exists! You can use calculated data column to define the new age range.
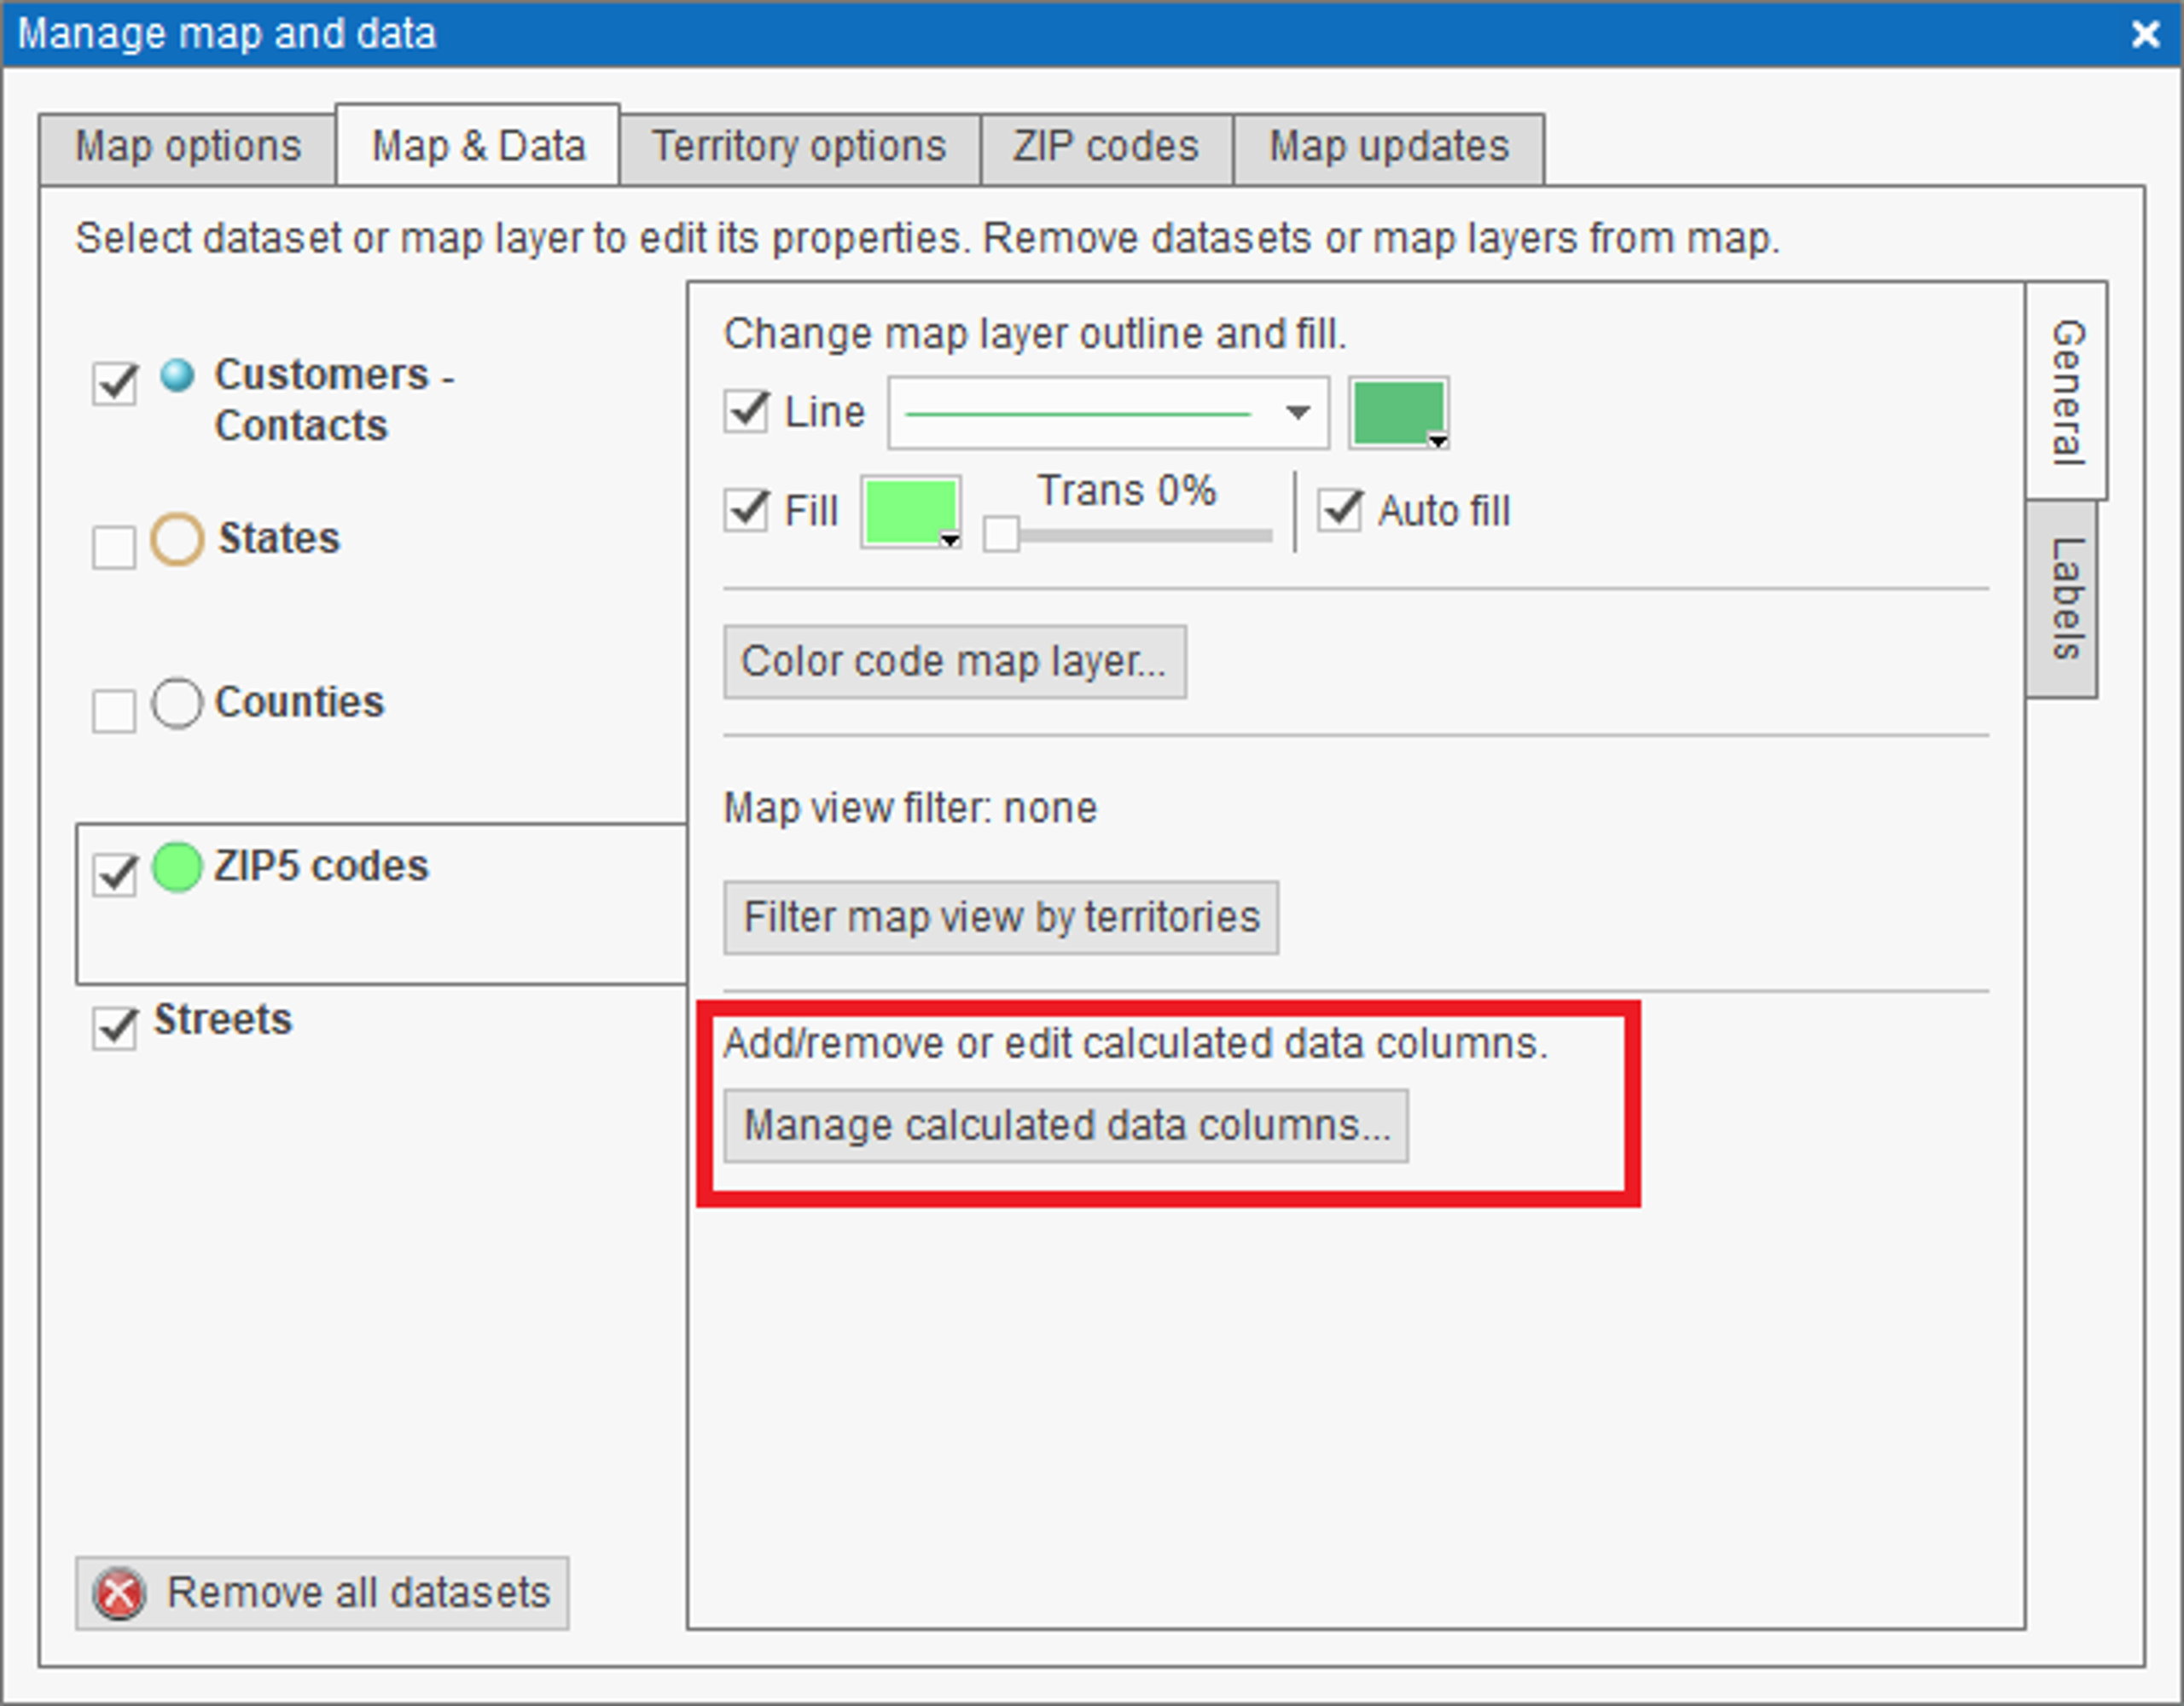
- Open Manage map and data dialog and select desired map layer (ZIP5 in our example).
- In the dialog click Manage calculated data columns button.
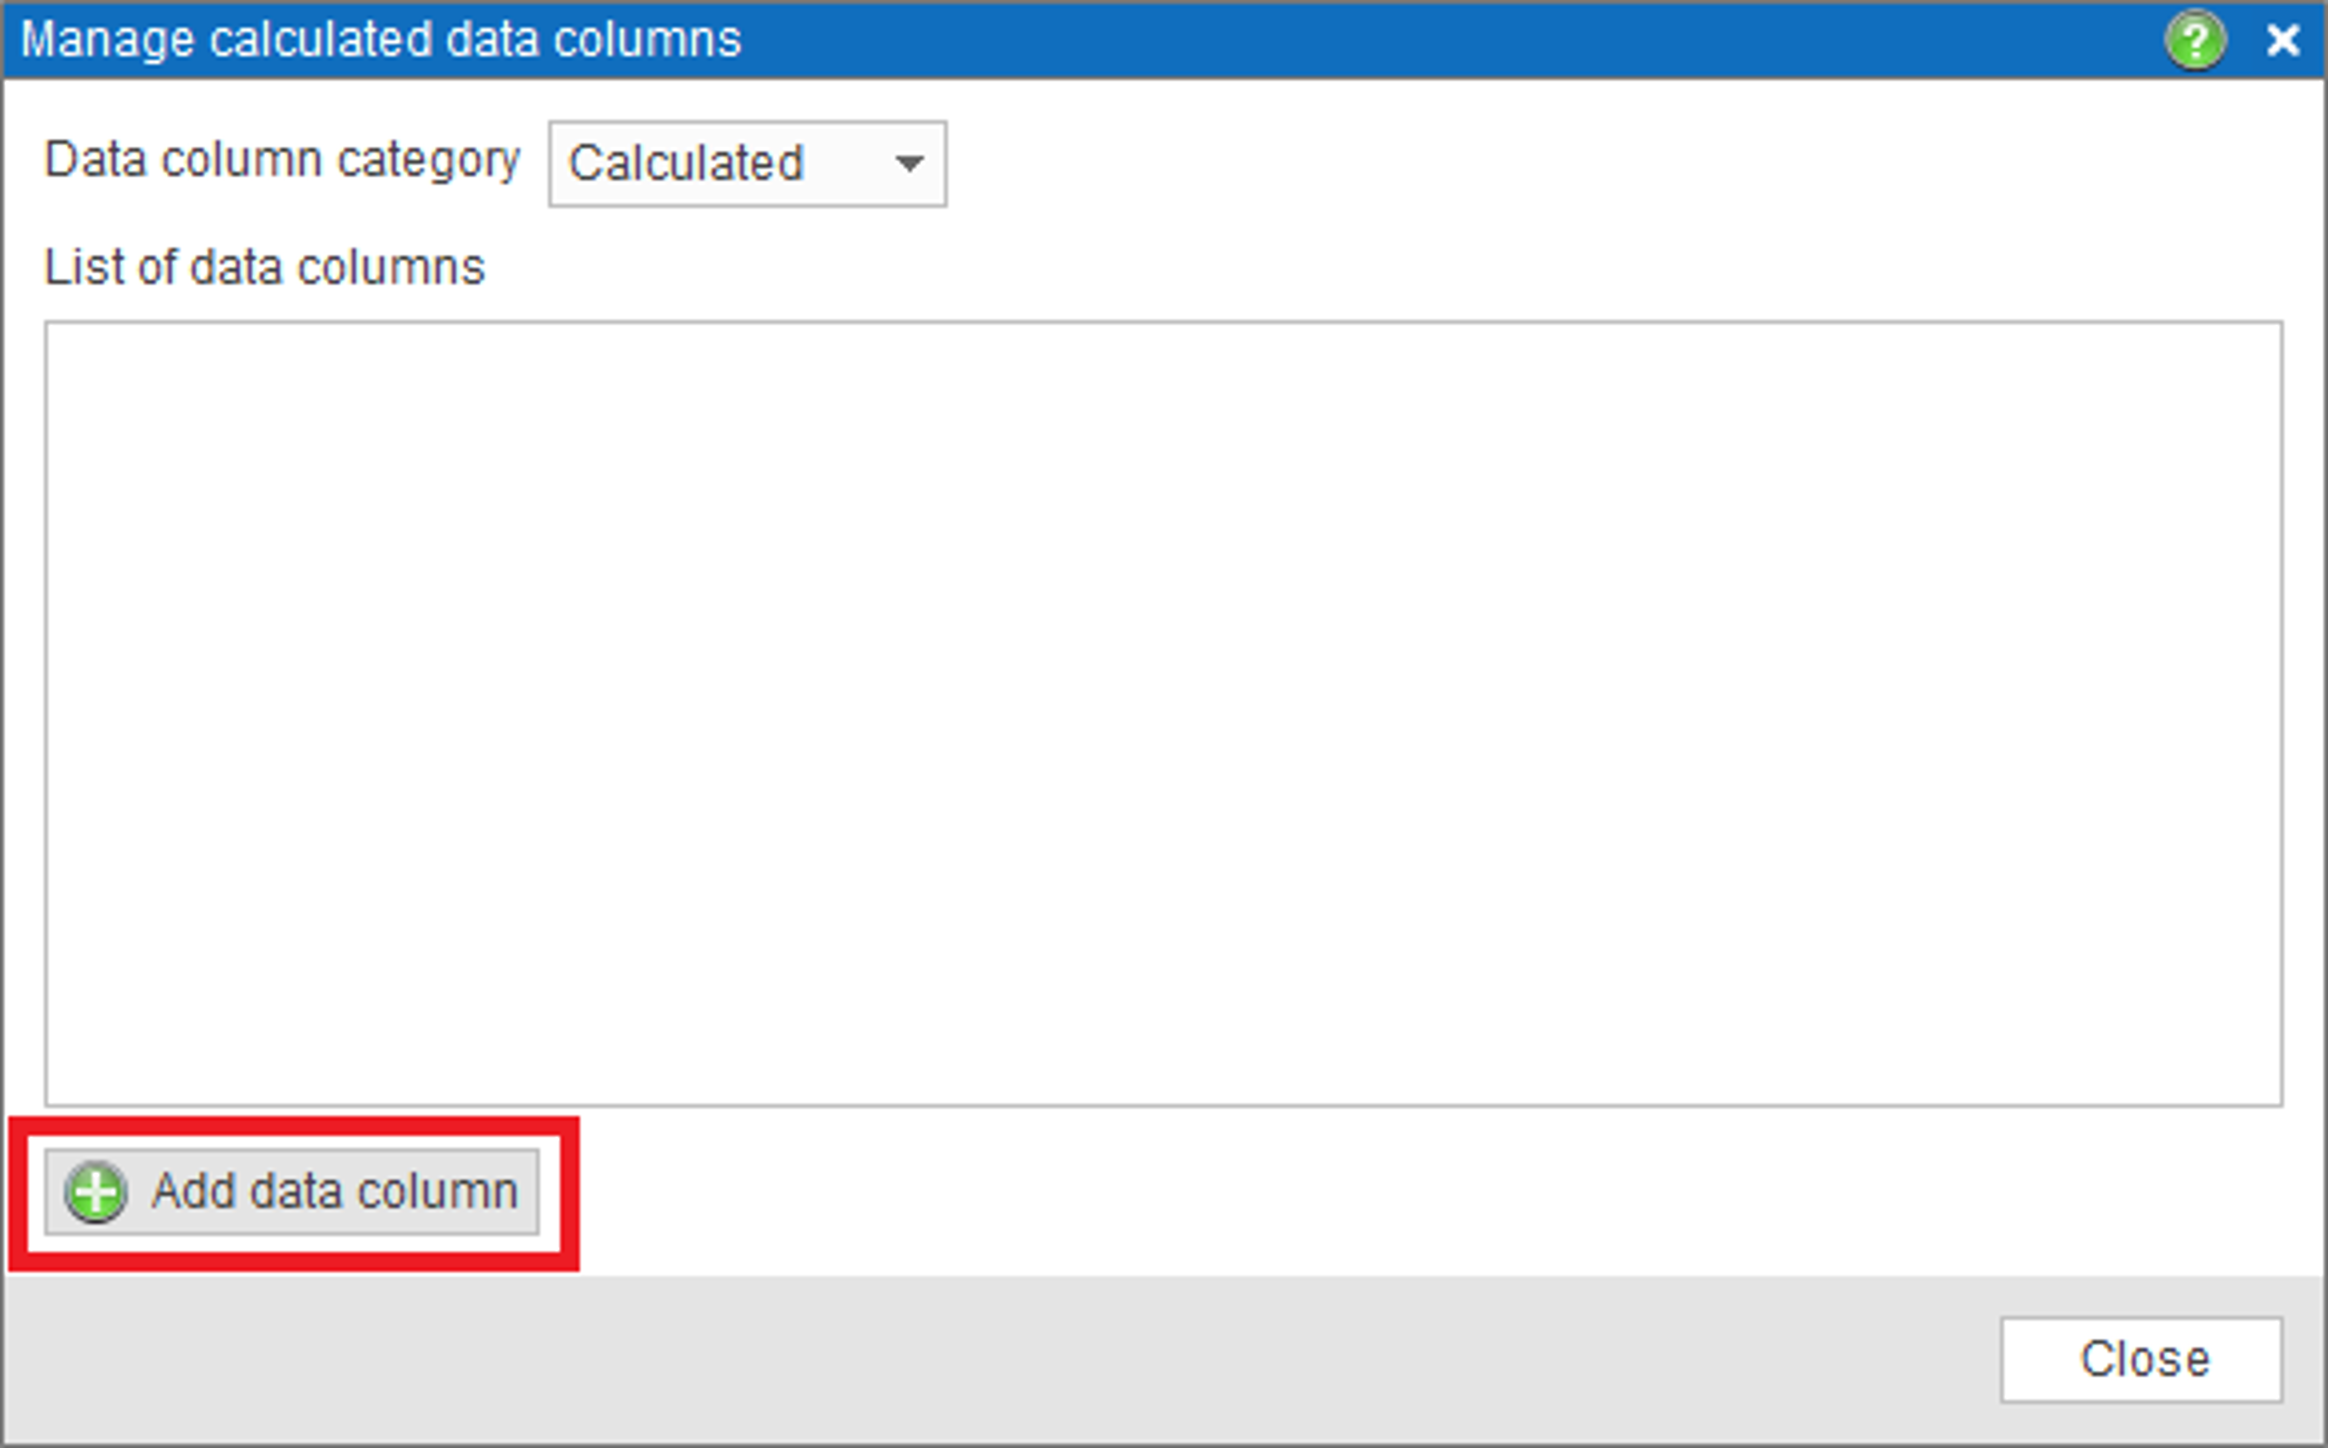
- Manage calculated data columns dialog with list of the columns will appear. Click Add data column button.
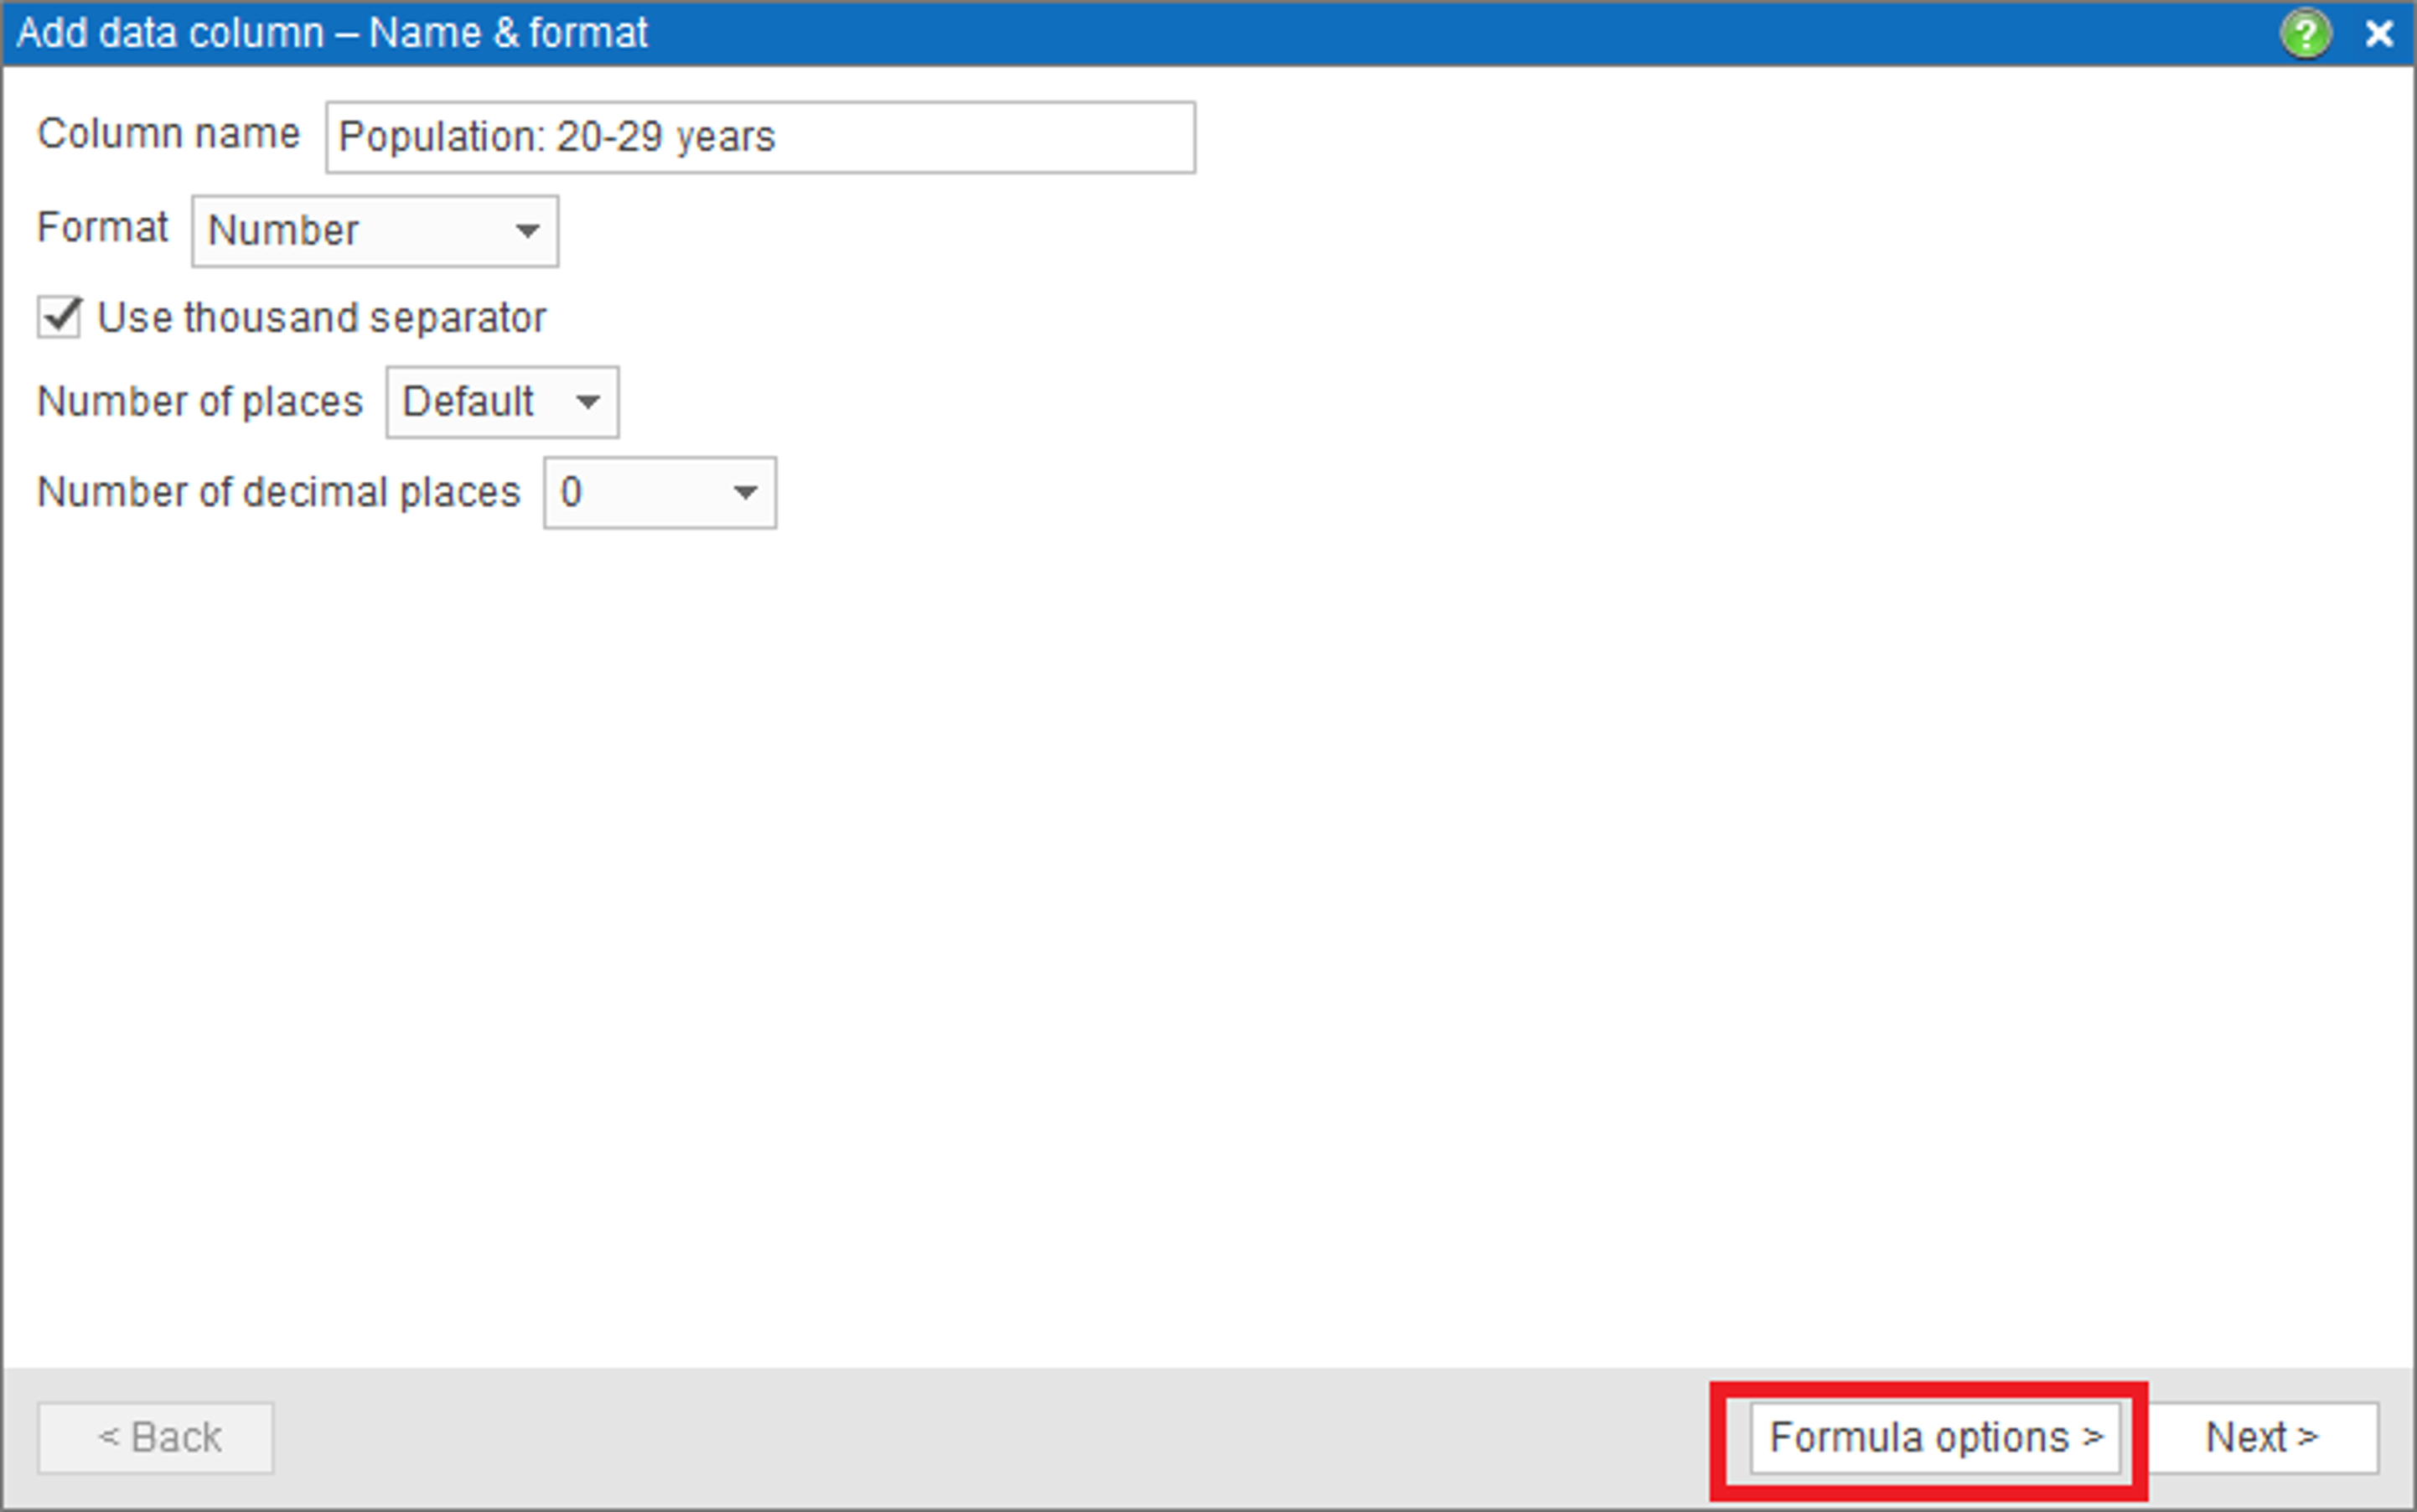
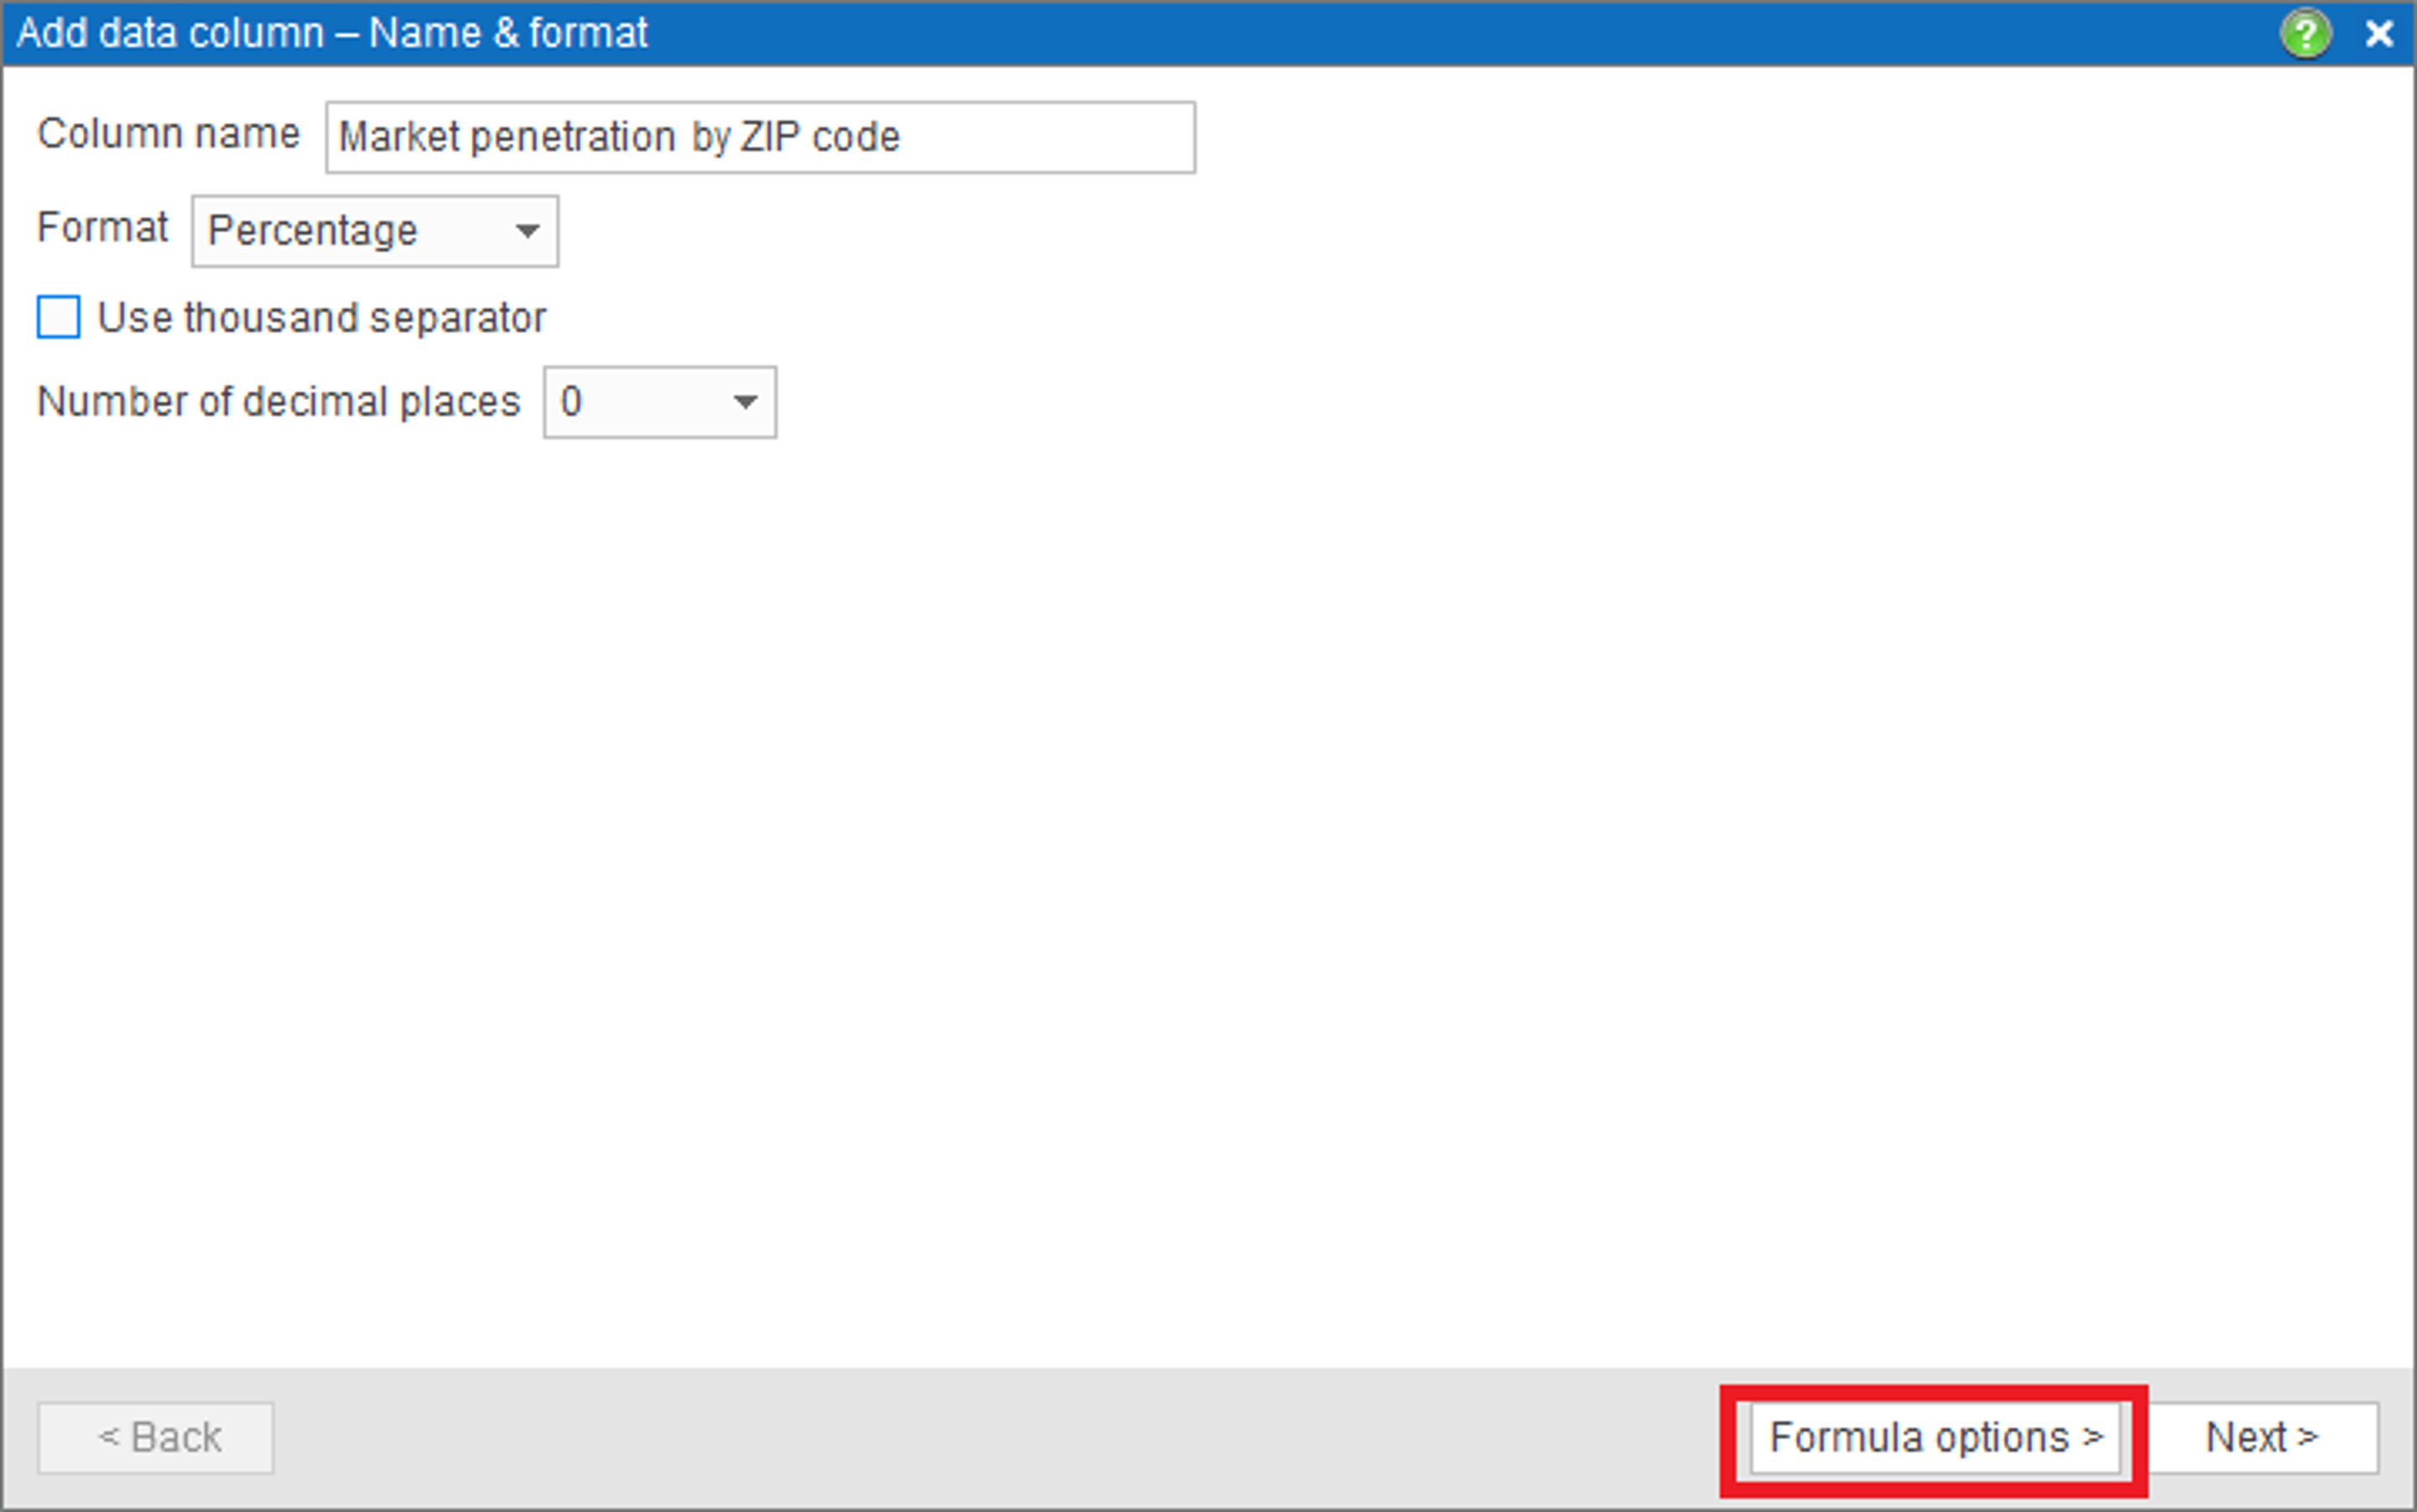
- In the first dialog of Add data column wizard that will start, type in the column name, and choose its format. Click Formula options button.
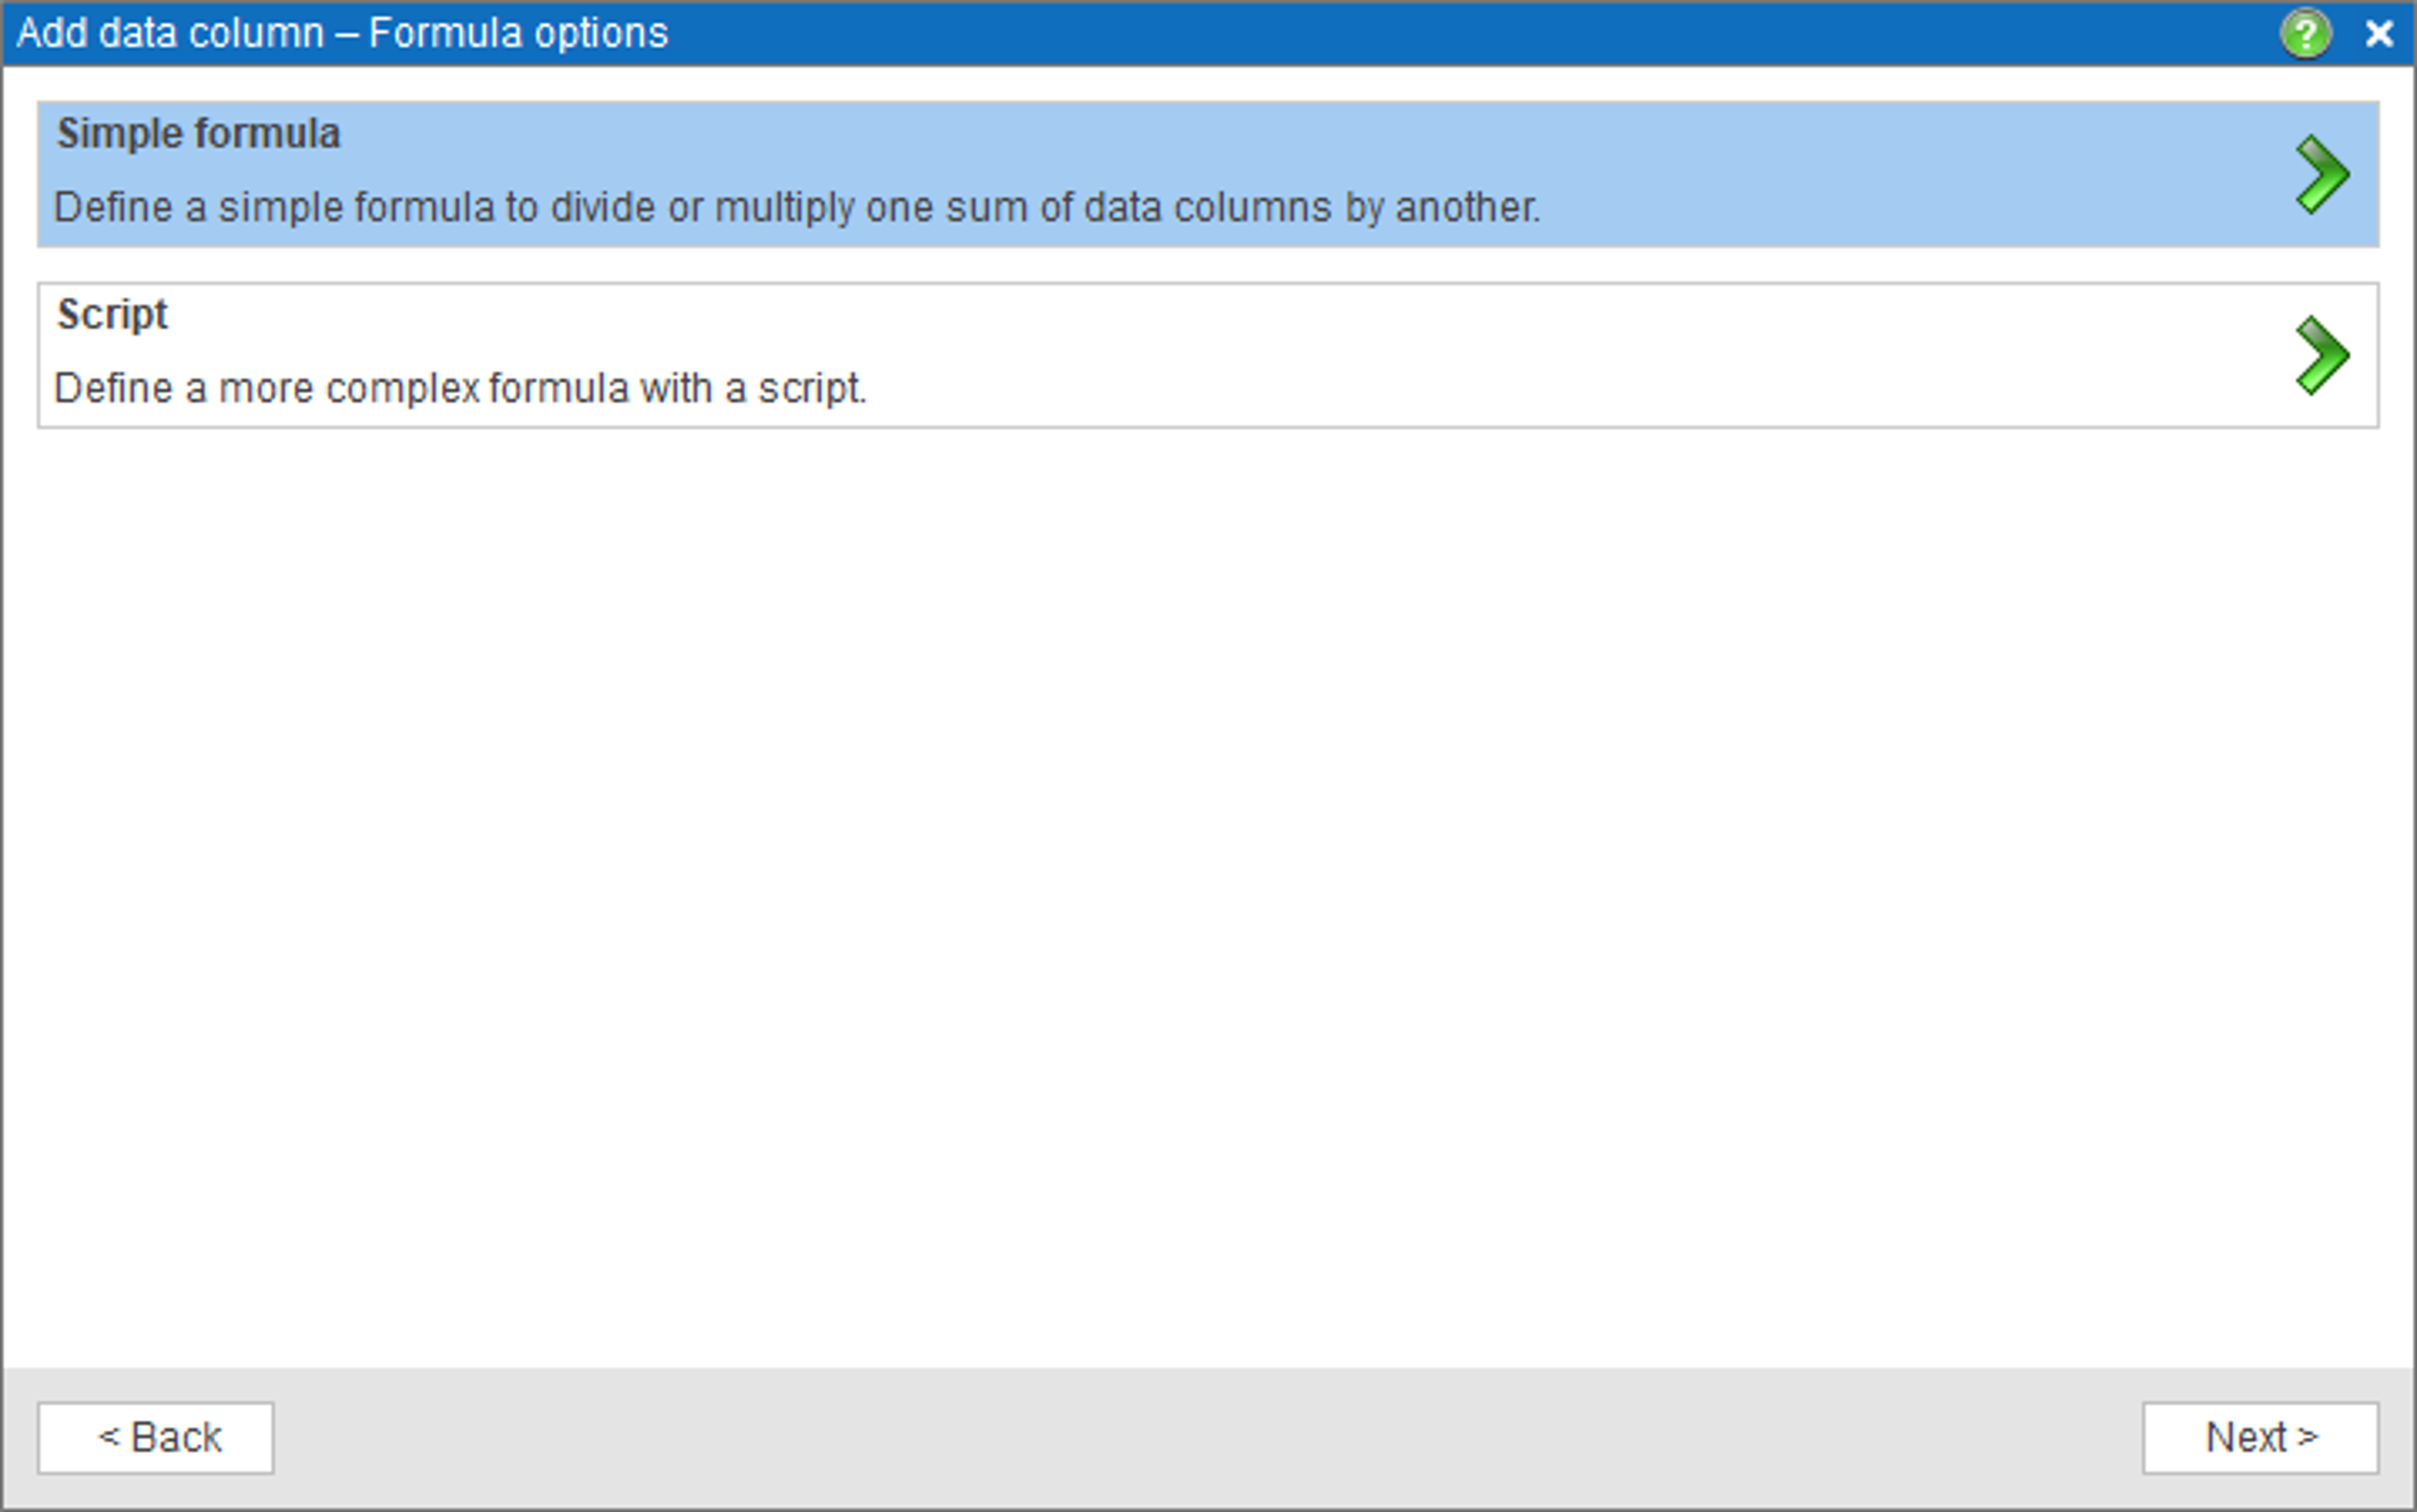
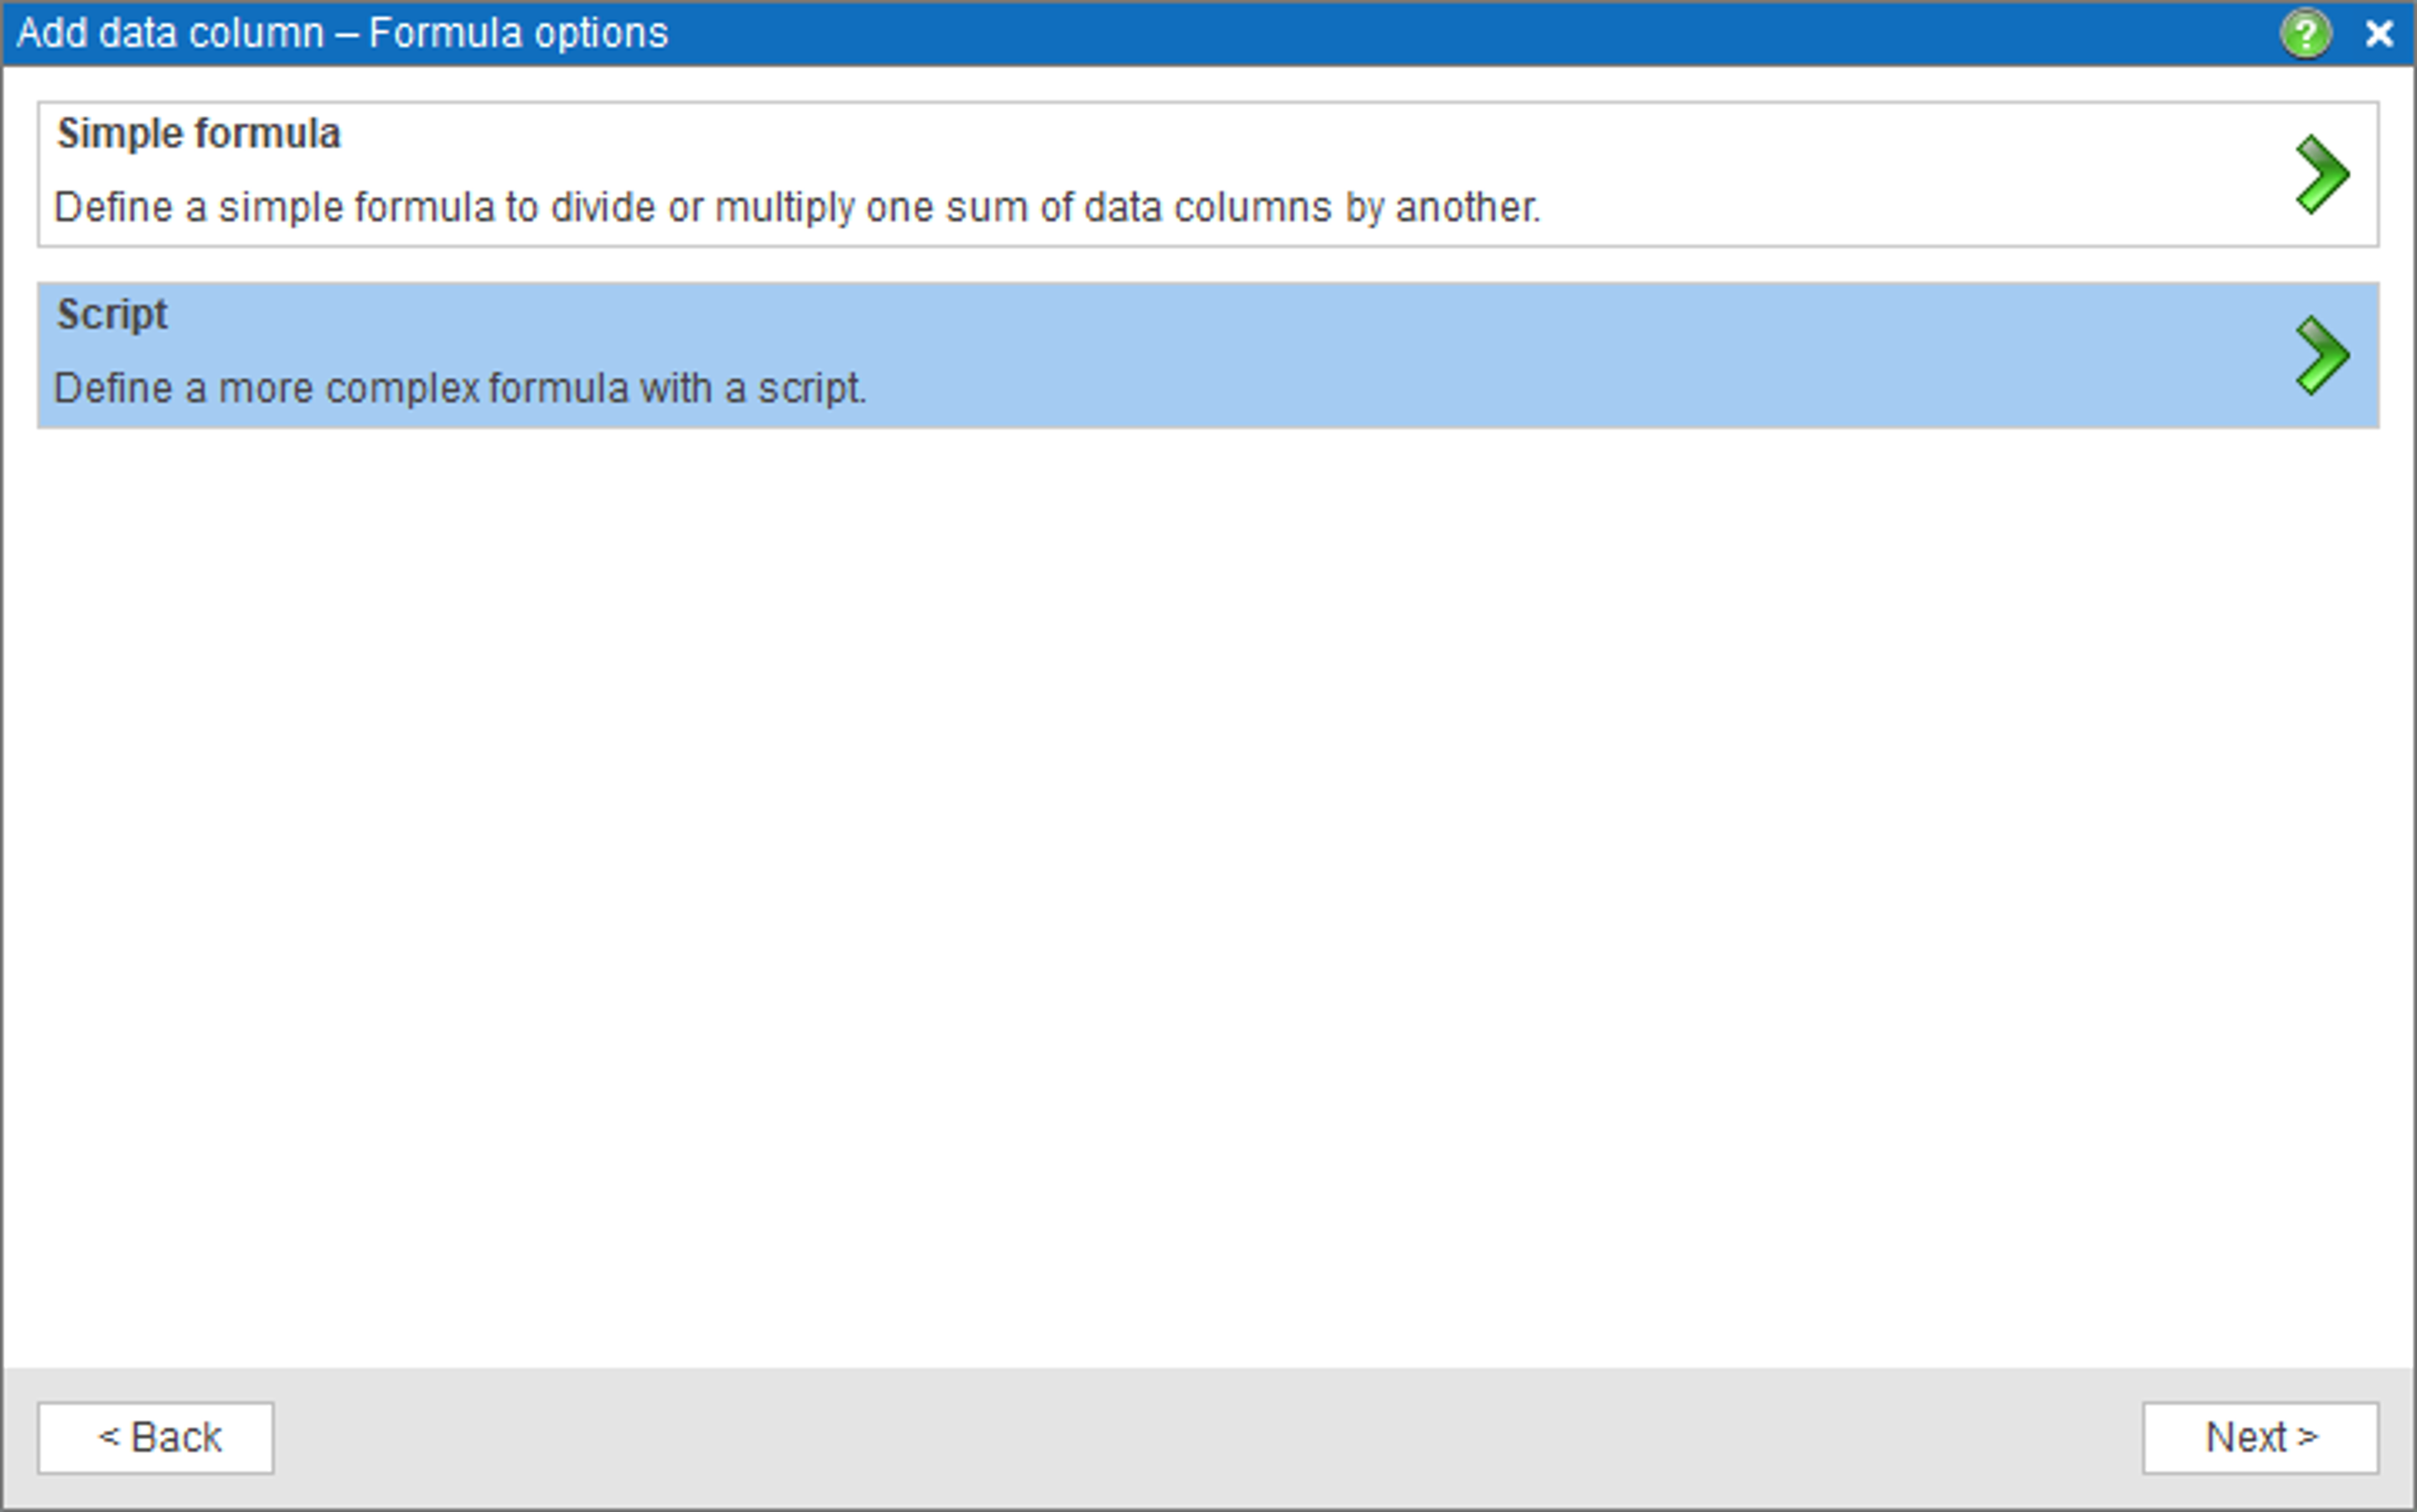
- Click Simple formula option to choose it in the next dialog.
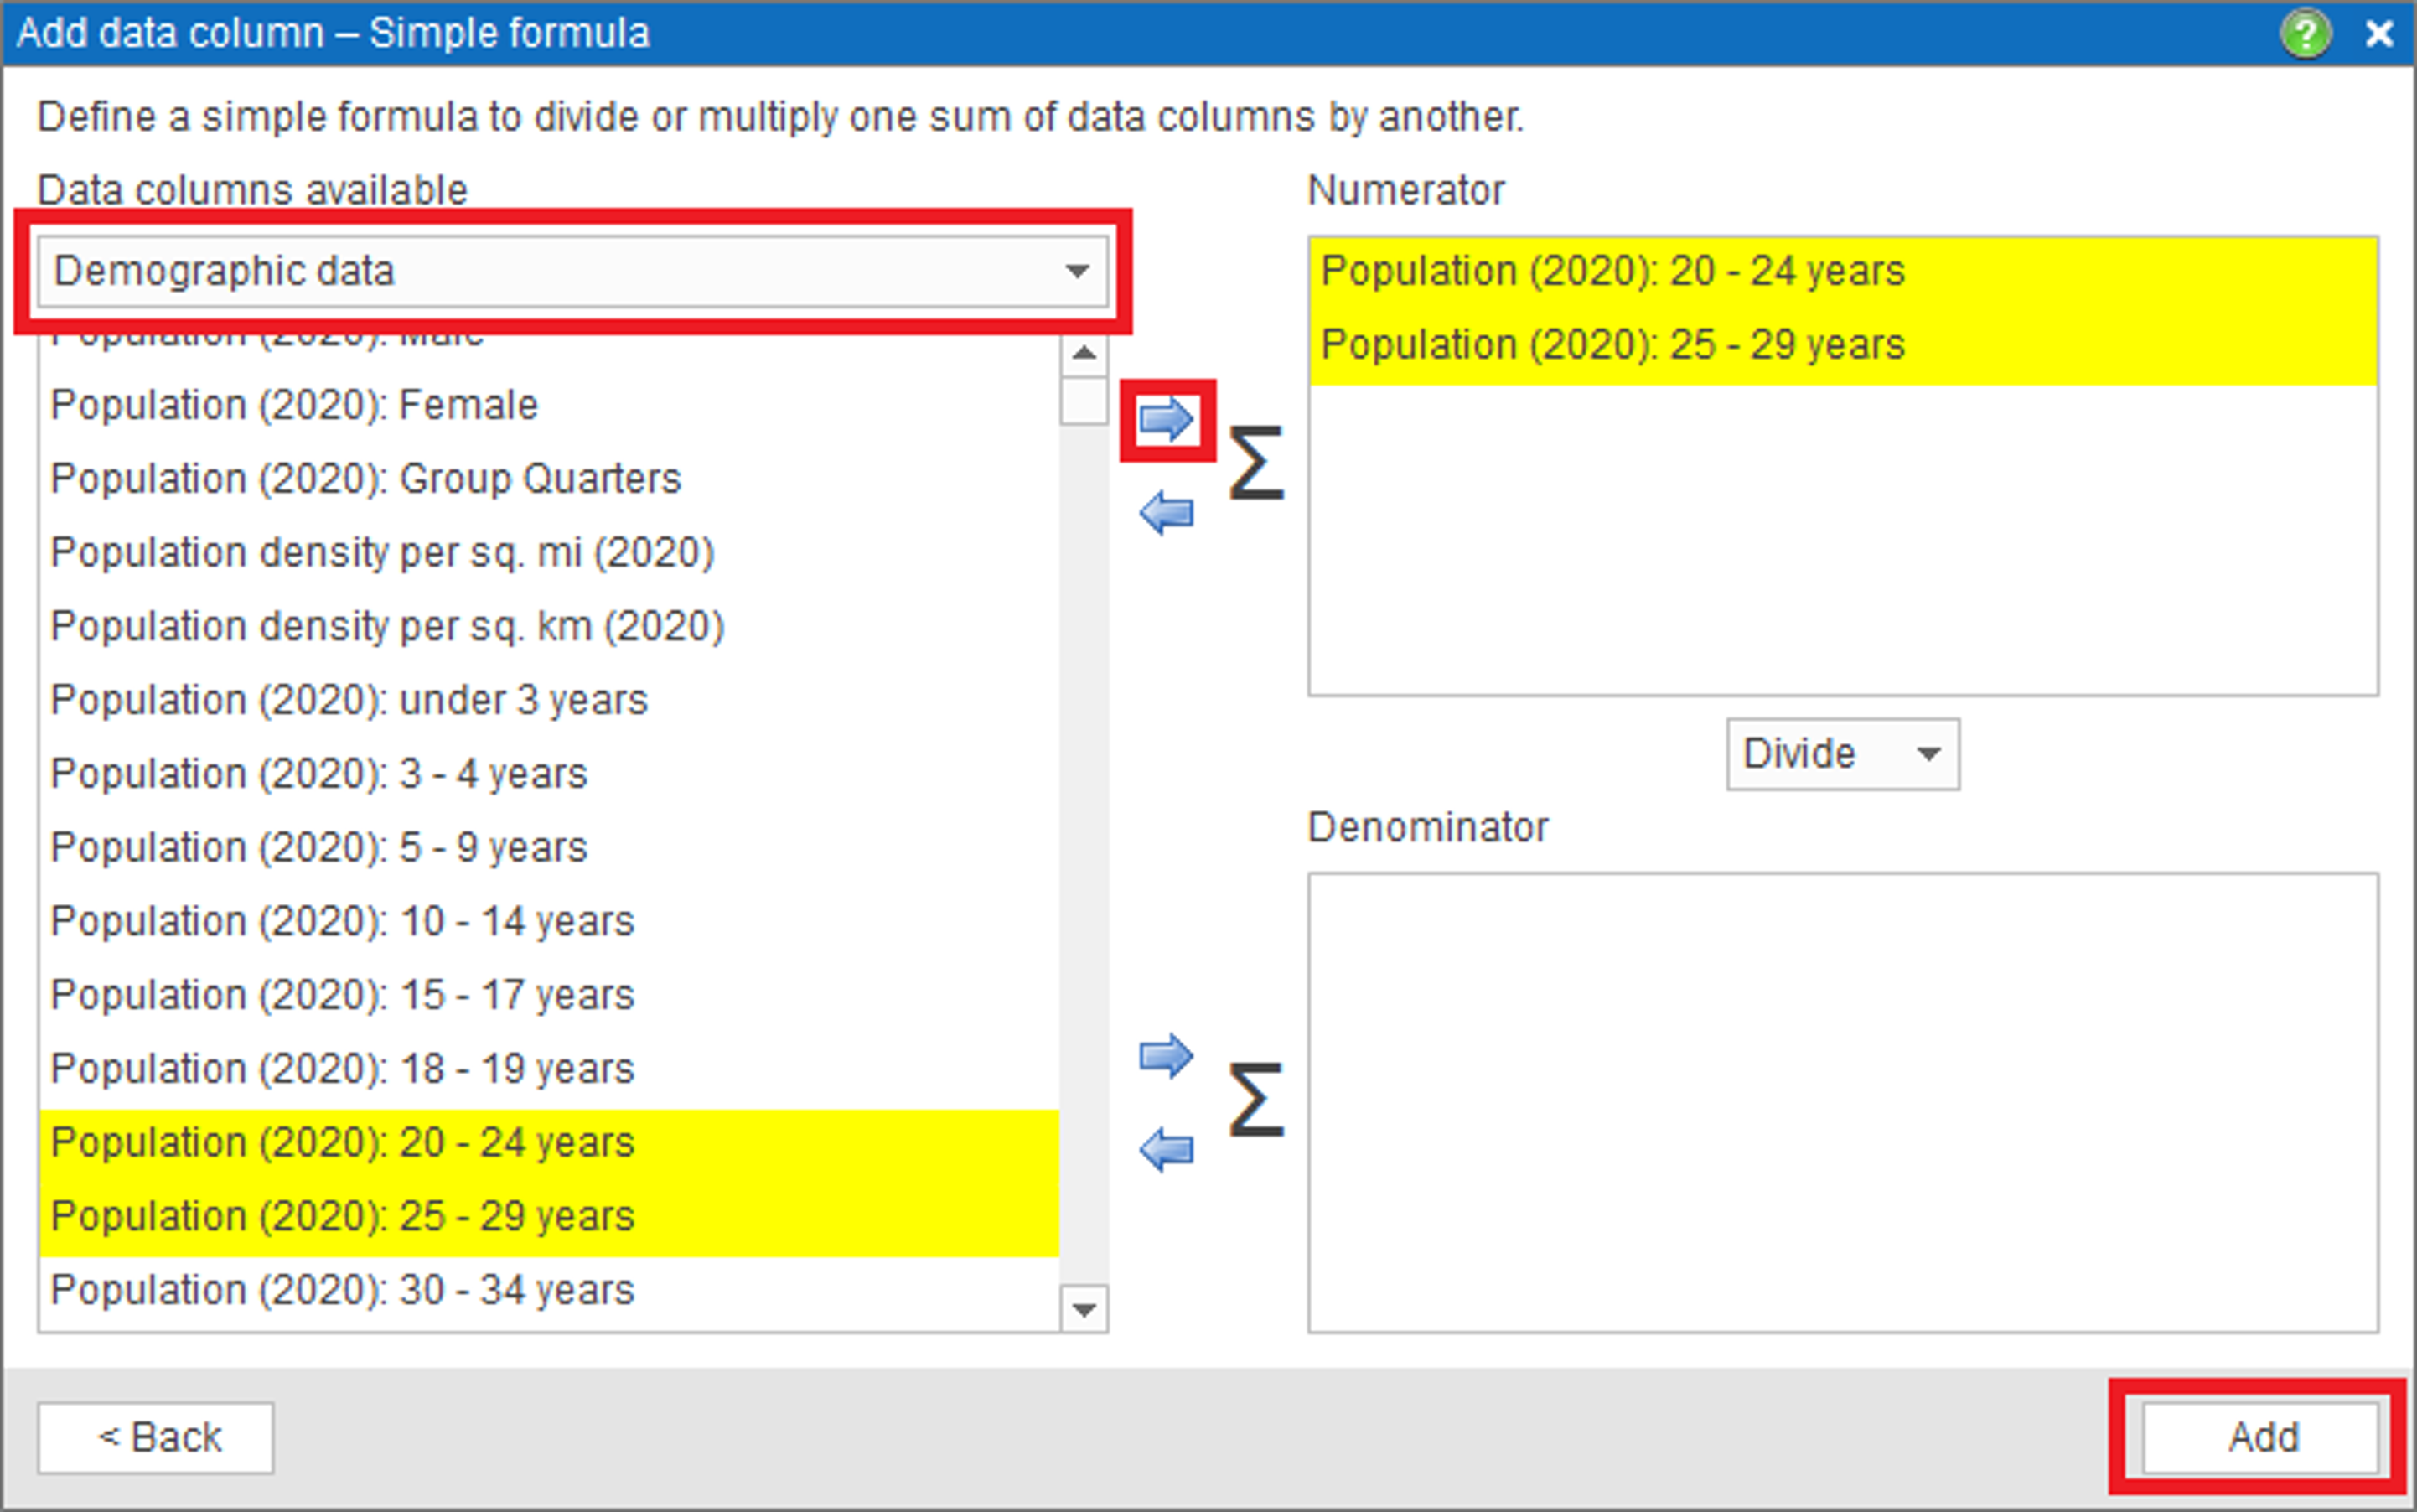
- In the final dialog of the wizard choose Demographic data group and the age data columns you want to sum. Click the right arrow icon to add the selected columns to the calculated data formula. Finally press Add data column button to apply the changes to the map layer.
- Now the new population column can be used in your market analysis maps for color-coding, labeling, and in Data window.
Market penetration
Another application of calculated data column is visualizing the market penetration. We will show you how to define calculated data column that divides number of customers you have in a ZIP code by total population of the ZIP code.
- Start by plotting your customer dataset on the map. See Plot data from Microsoft® Excel for more information.
- Follow the steps 1 through 3 in the Custom age ranges example to open Add data column wizard.
- In the first dialog of Add data column wizard, type in the column name, and choose its format. Click Formula options button.
- Click Simple formula option to choose it in the next dialog.
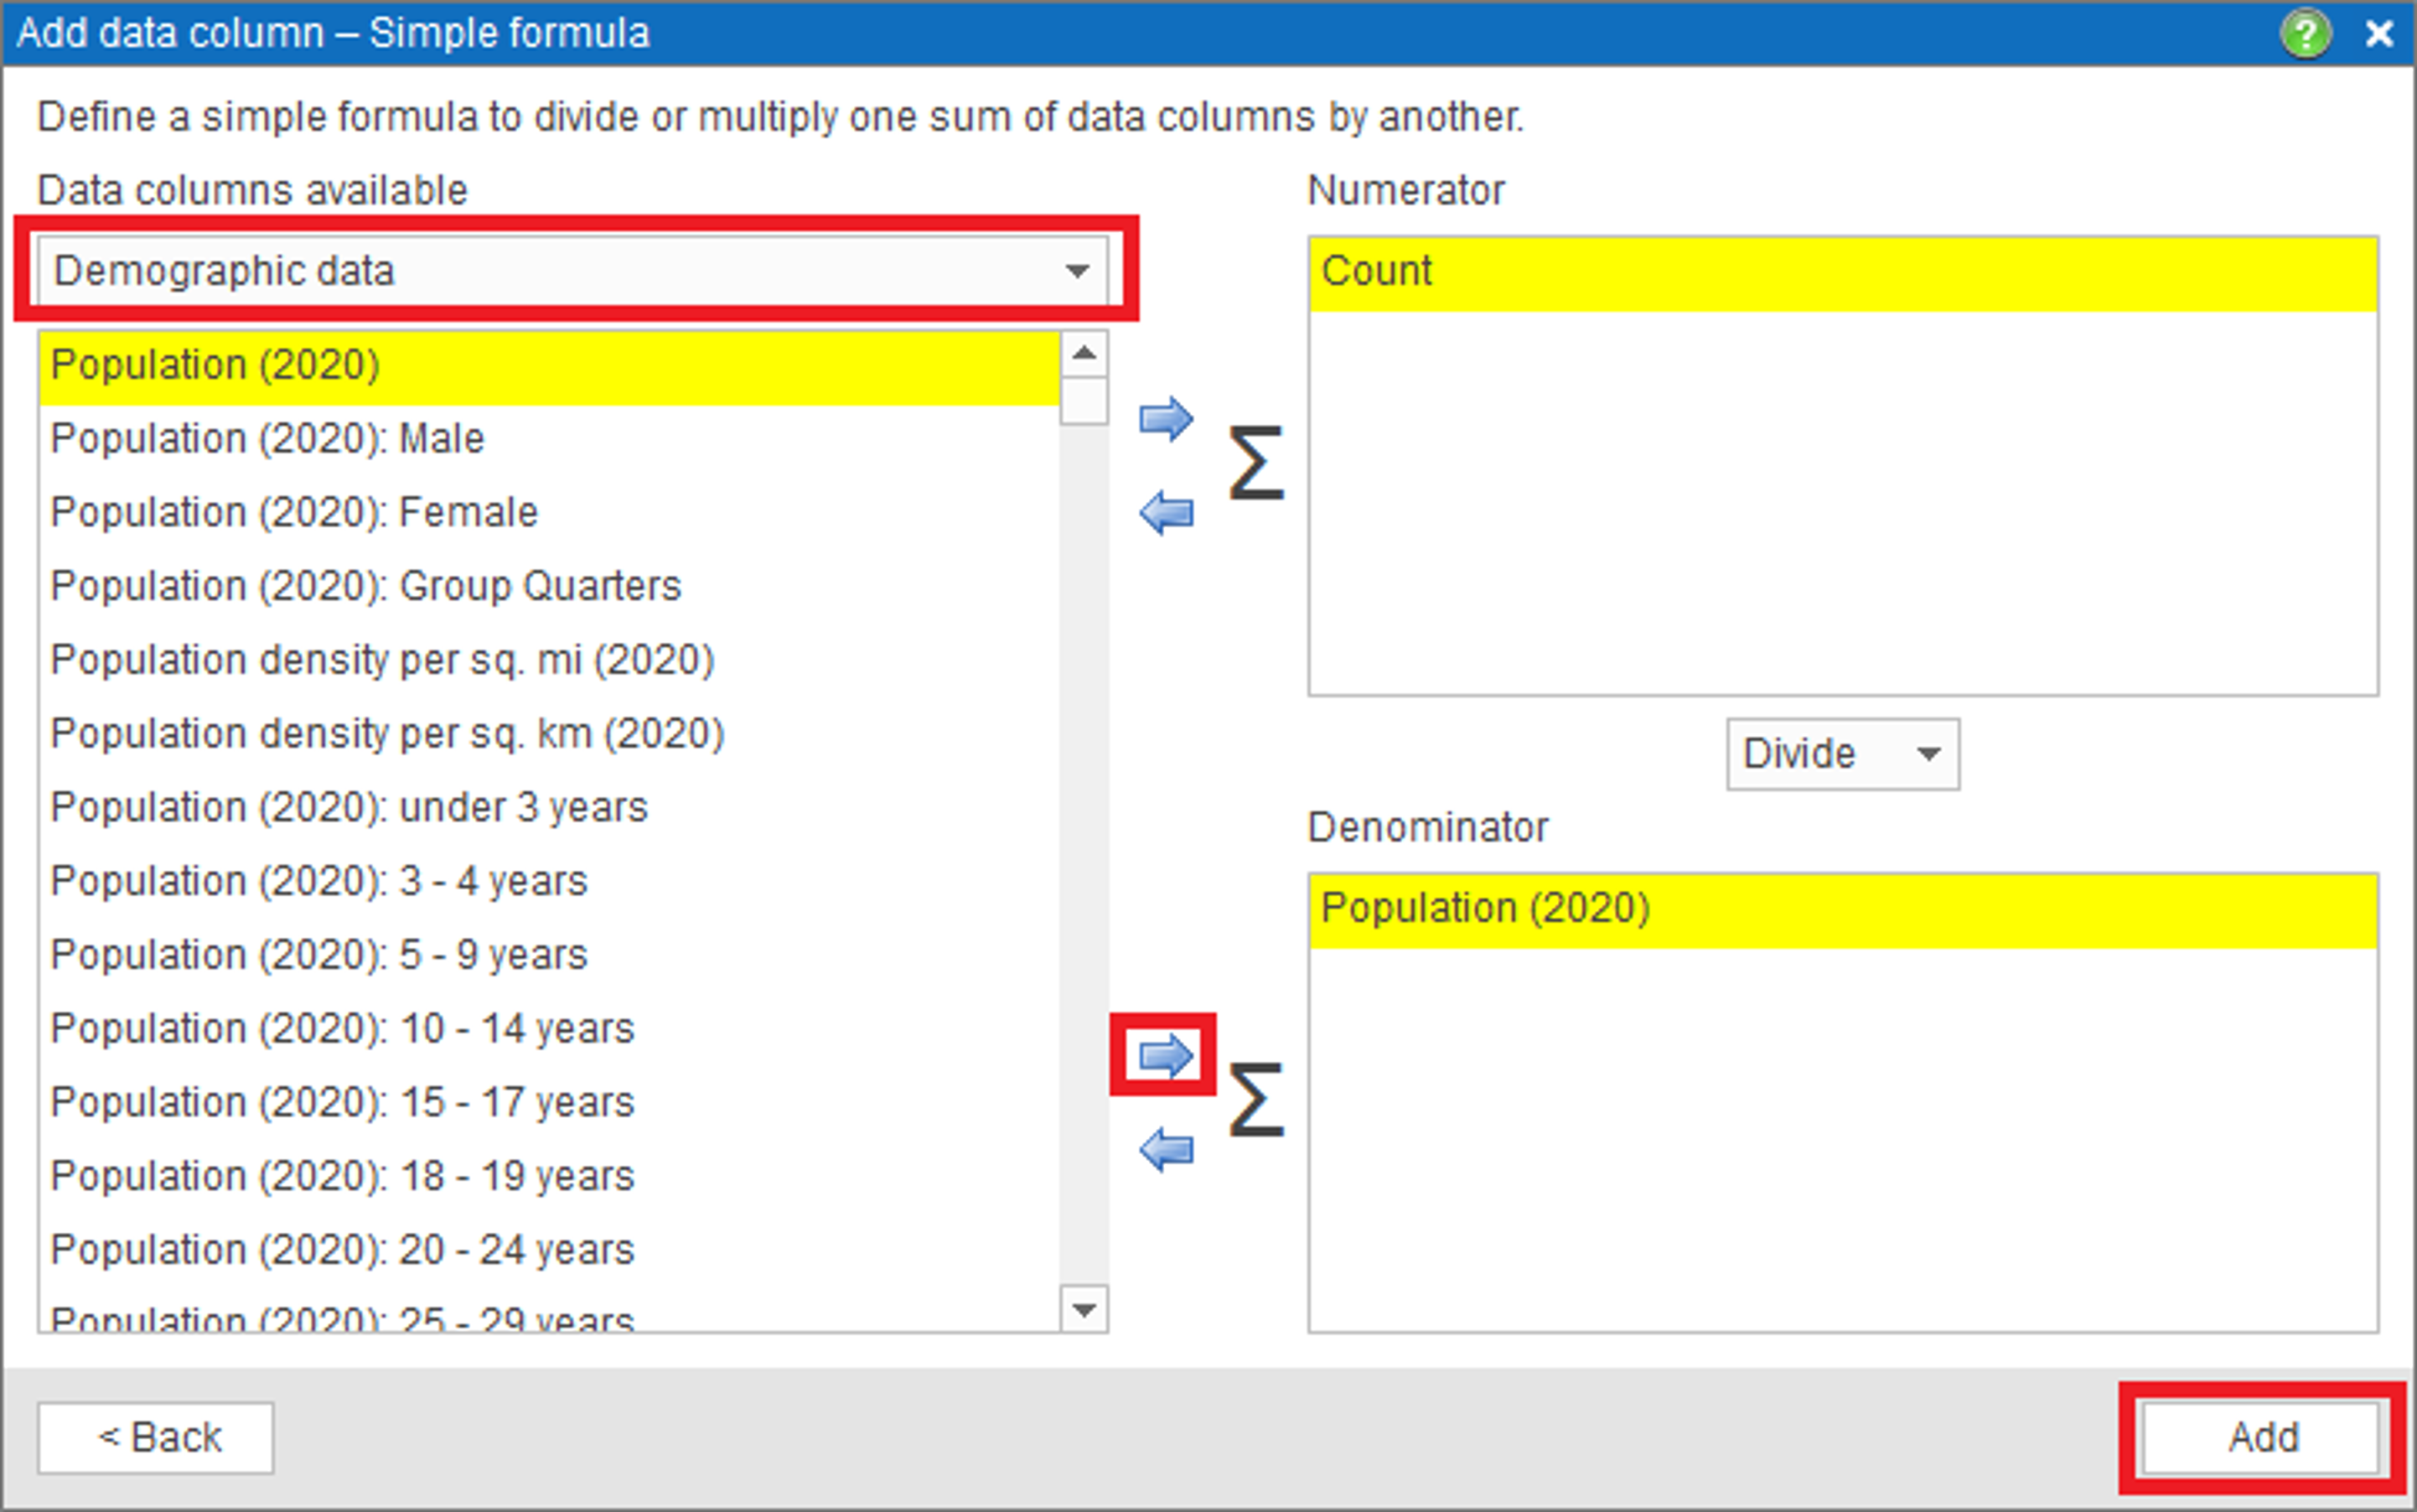
- In the final dialog of the wizard choose Customer data group (will come under the name of the dataset you have plotted) and the Count data column. Click the right arrow icon to add the selected columns to calculated data formula as Numerator.
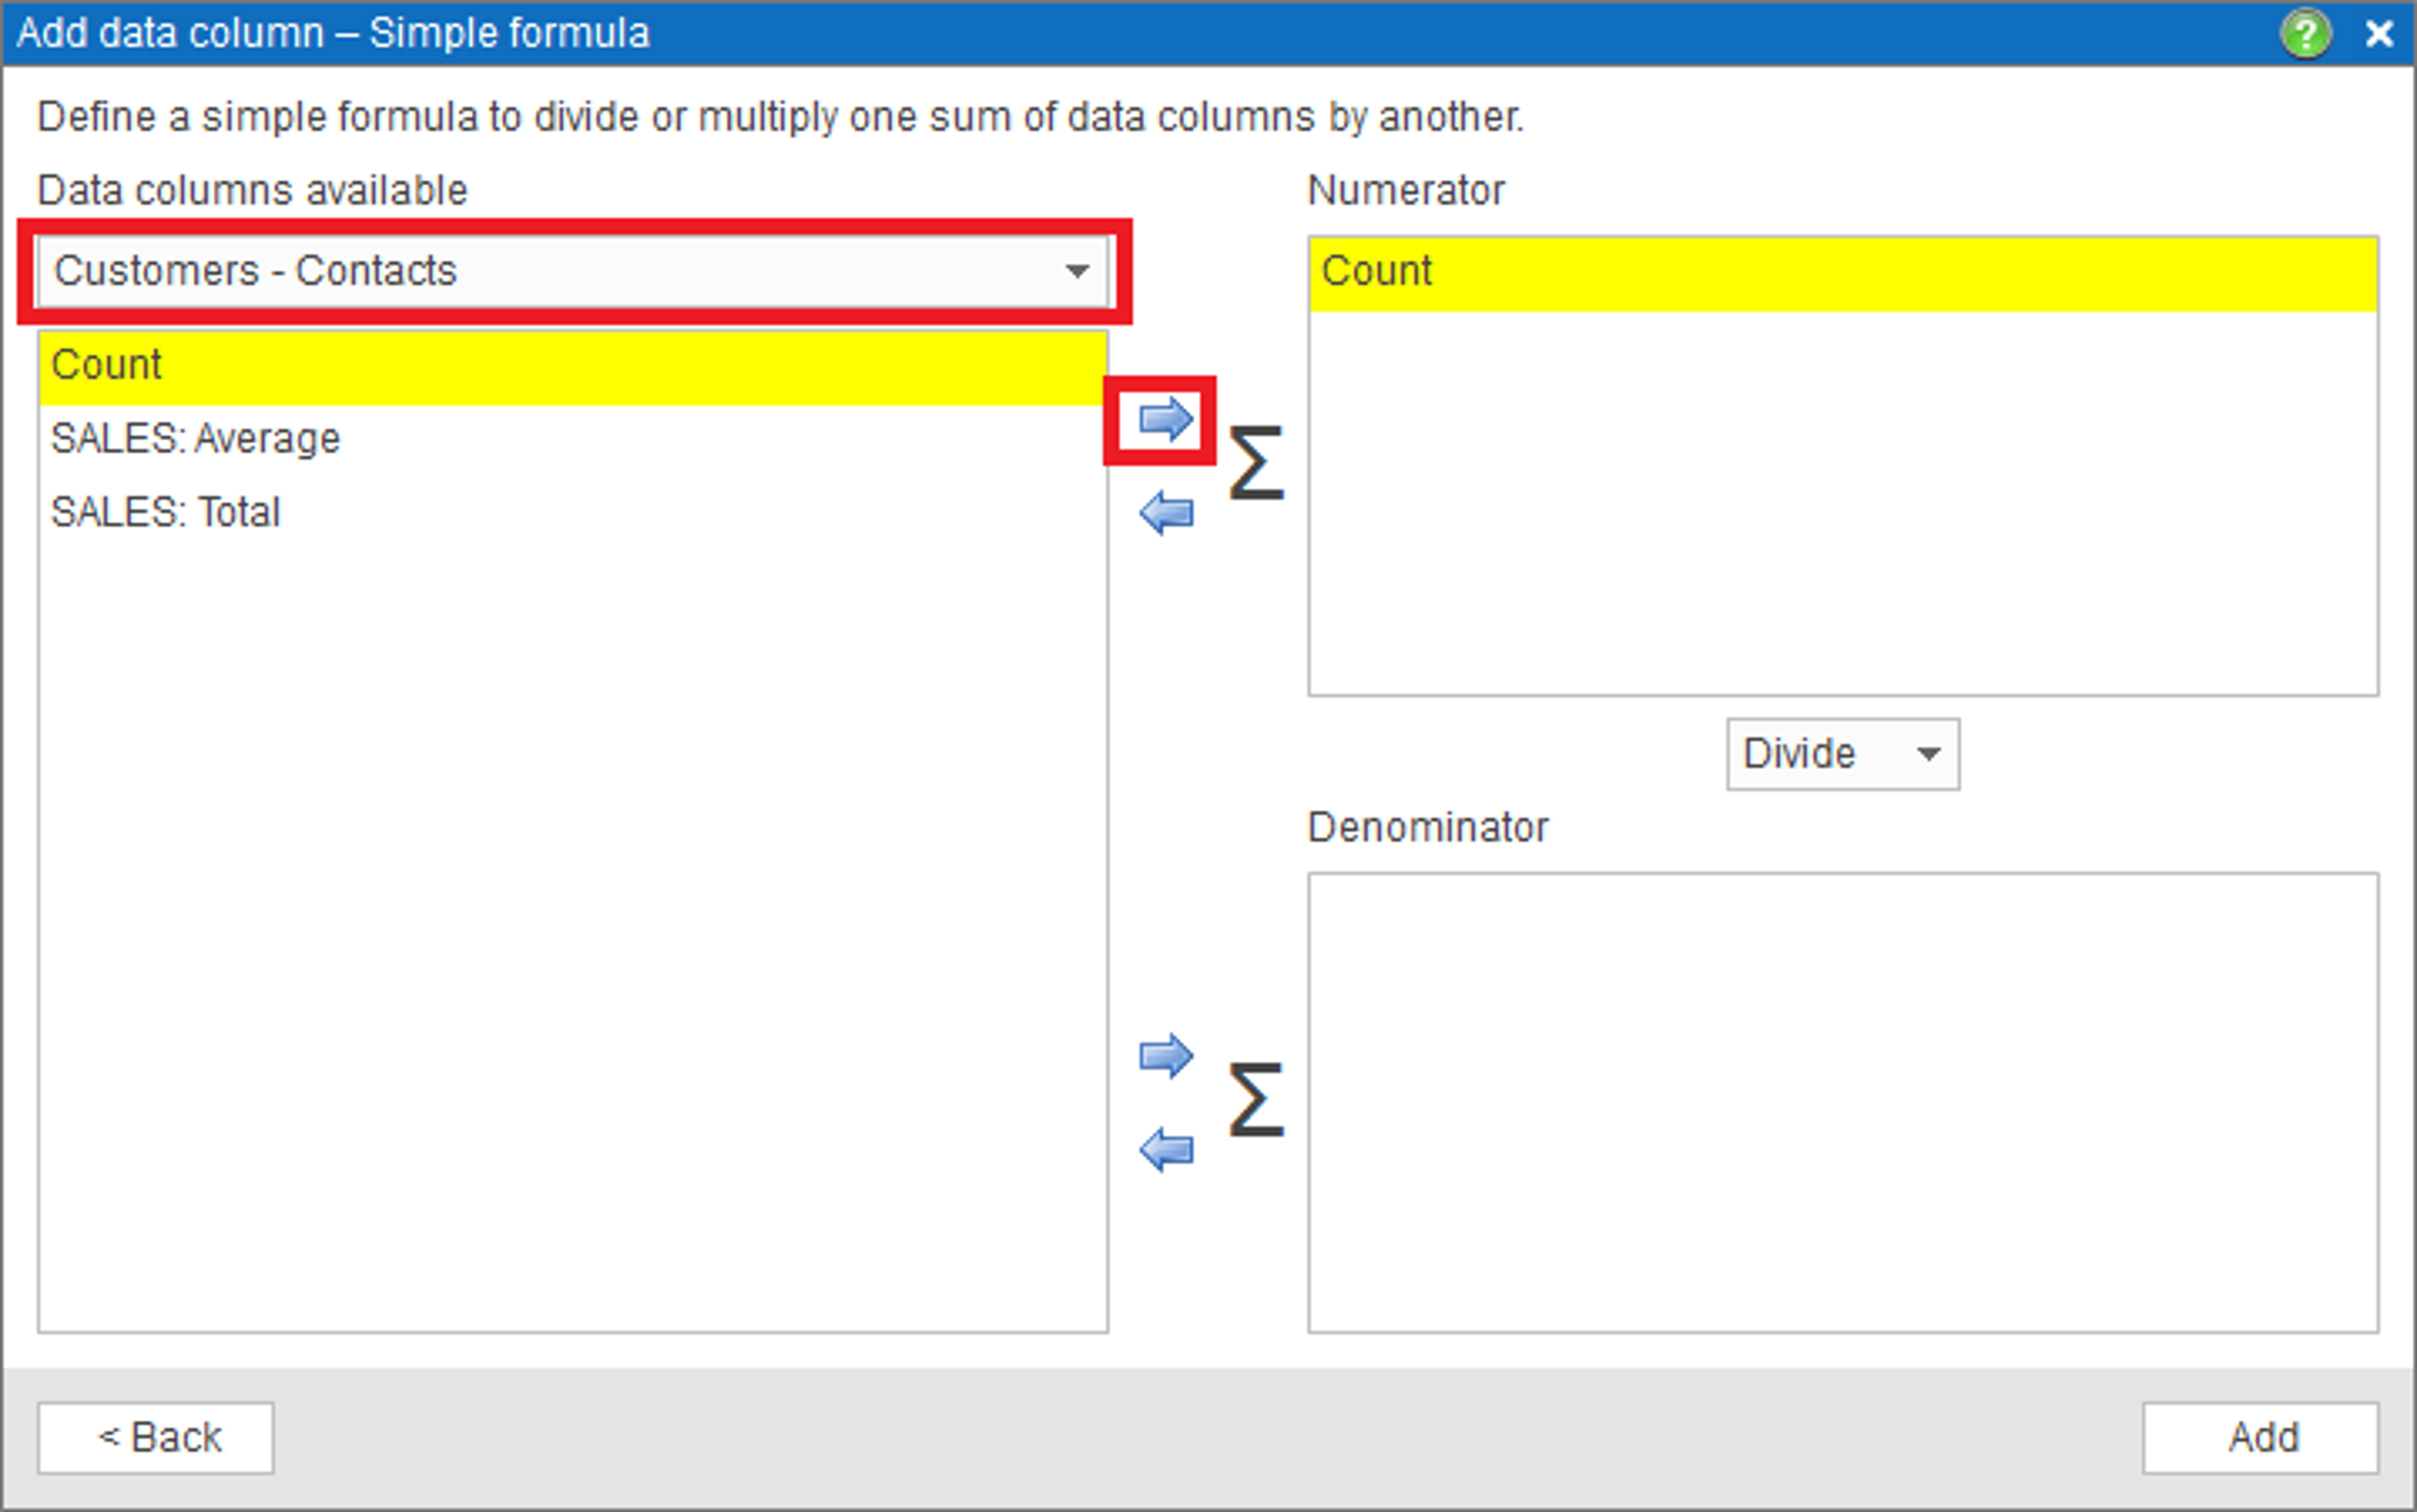
- In Denominator choose Demographic data group and the population data column. Finally press Add data column button to apply the changes to the map layer.
- Now Market penetration by ZIP code data column can be used in color-coding, labeling, and in Data window.
Define a calculated column with a script
When defining a calculated column, you have two options: a simple formula or script. A simple formula is a sum of data variables divided by another sum of data variables. A script allows you to define more complex formulas. A script is written in the language similar to JavaScript. The language supports defining script variables, accessing layer or dataset variables, and an extended set of functions and operators. If you are interested in a script-based calculated column, please Contact us. Here we show how the same Market penetration data column can be defined as a script.
- To define a script just choose the options in the second dialog of Add data column wizard (see Custom age ranges example for more info).
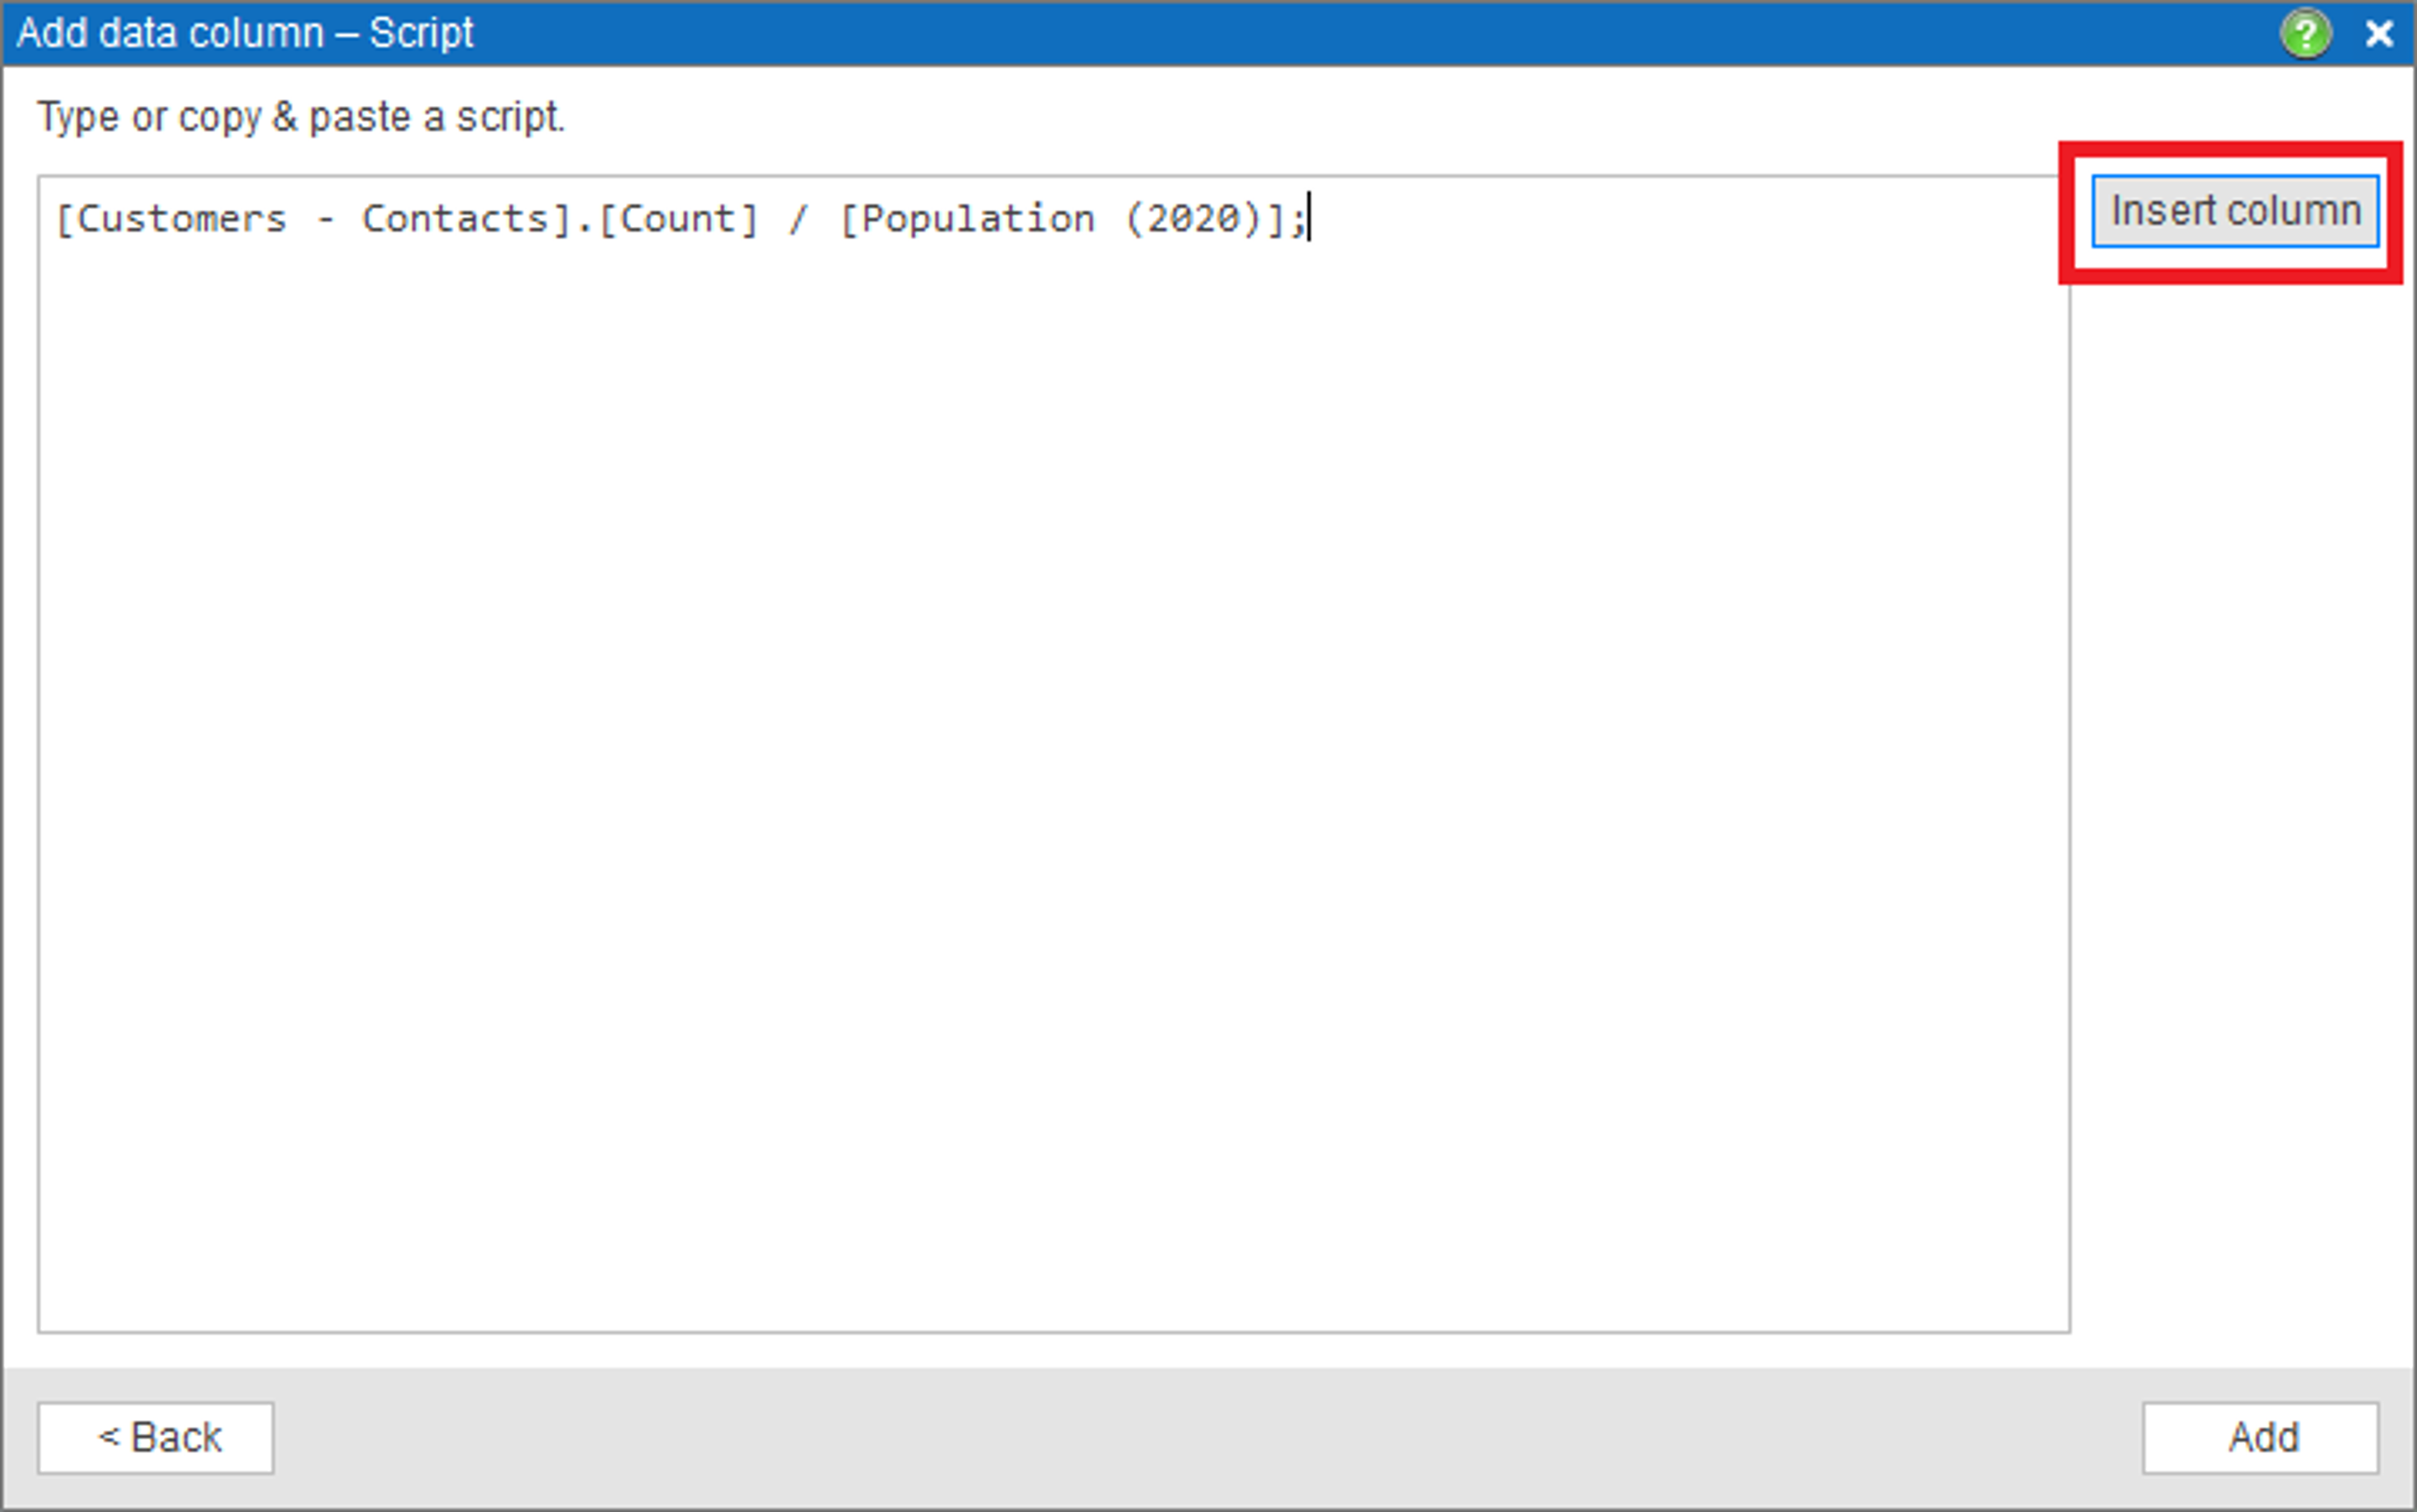
- On the picture below you can see the Market penetration script. Use Insert column button to insert layer or dataset variables in a script.