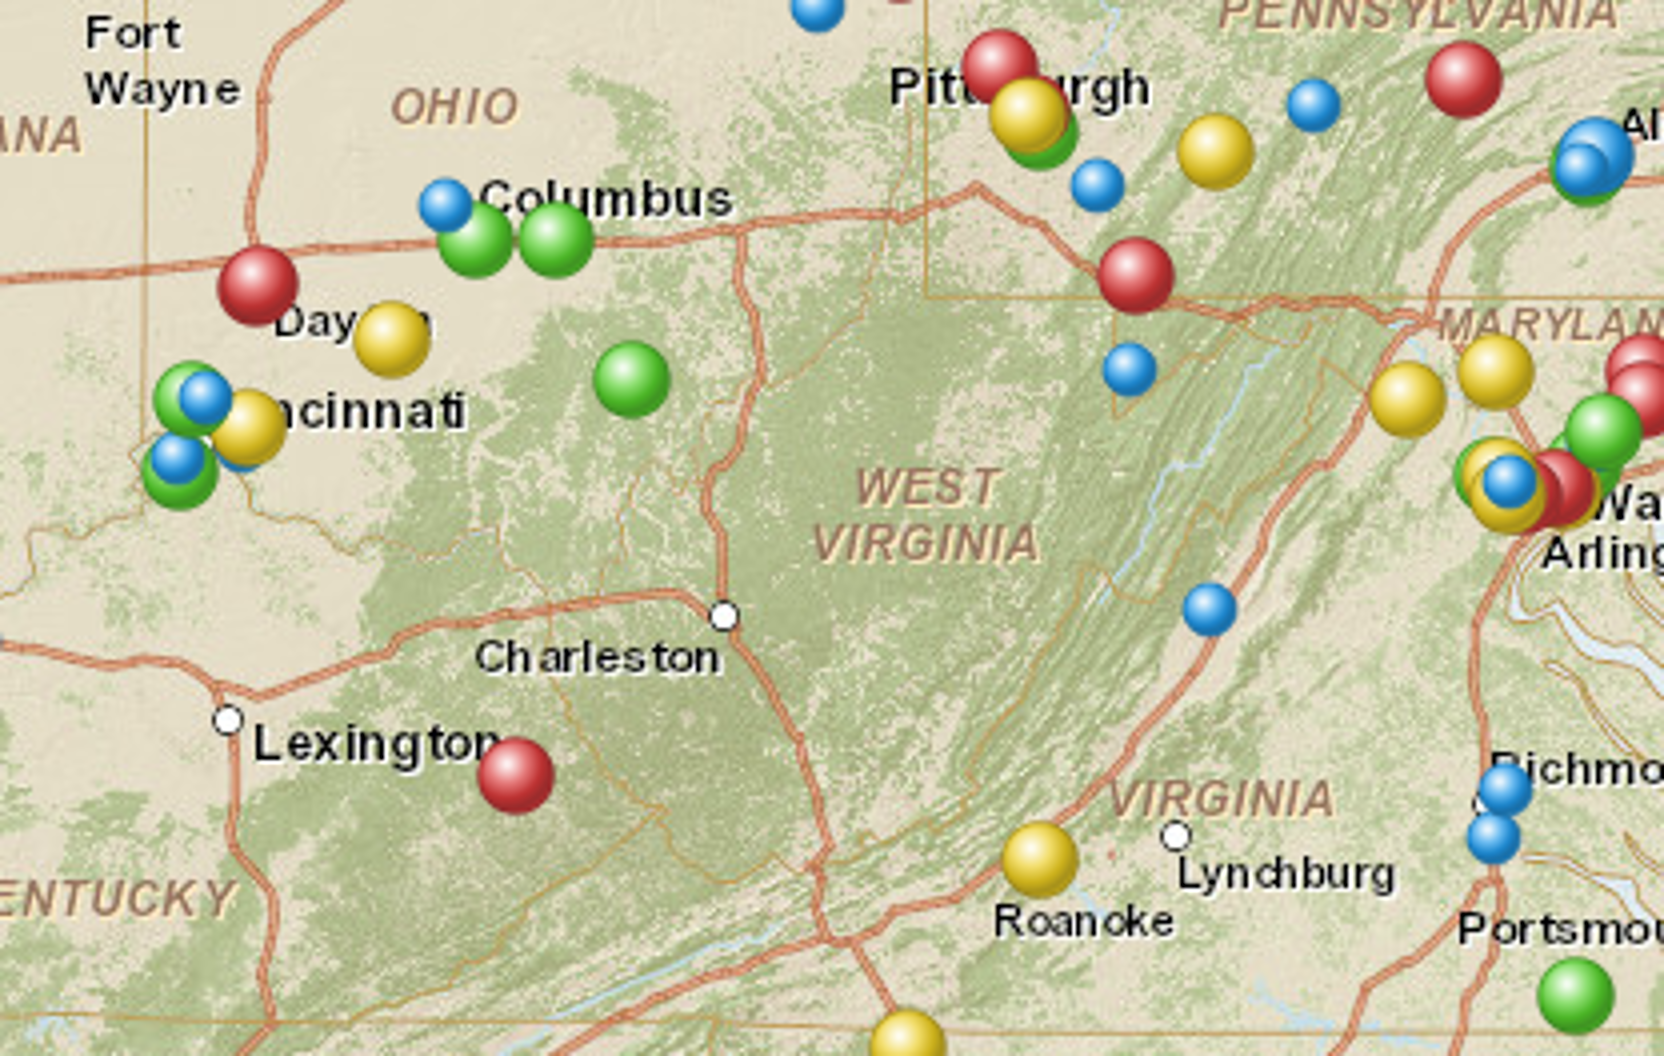
Color Code Dataset Locations with Symbols
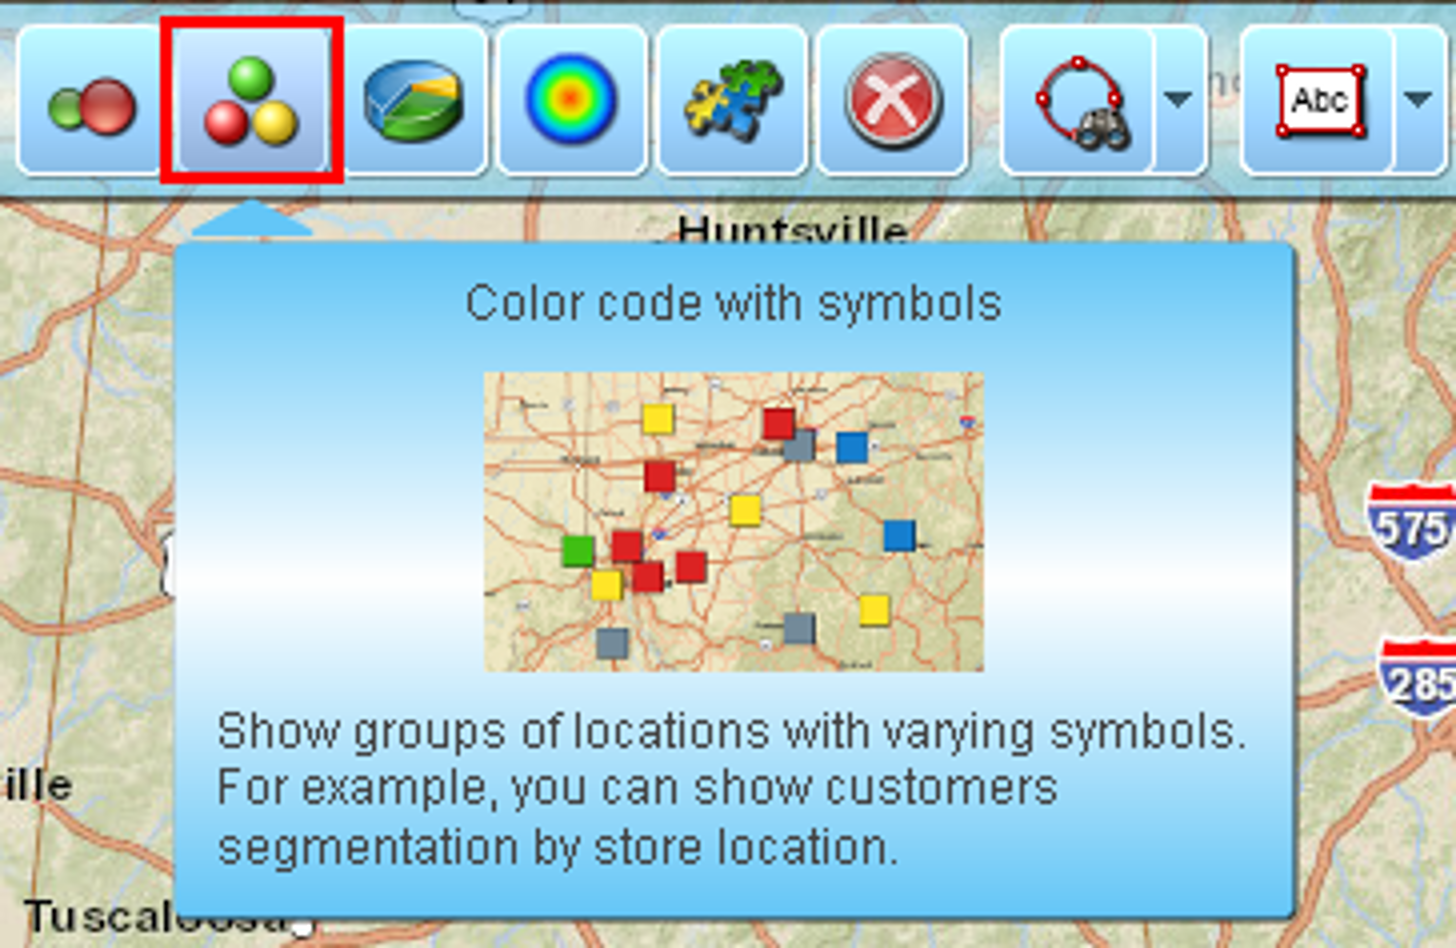
- To color code data with symbols click ‘Color code with symbols’ icon on the toolbar.
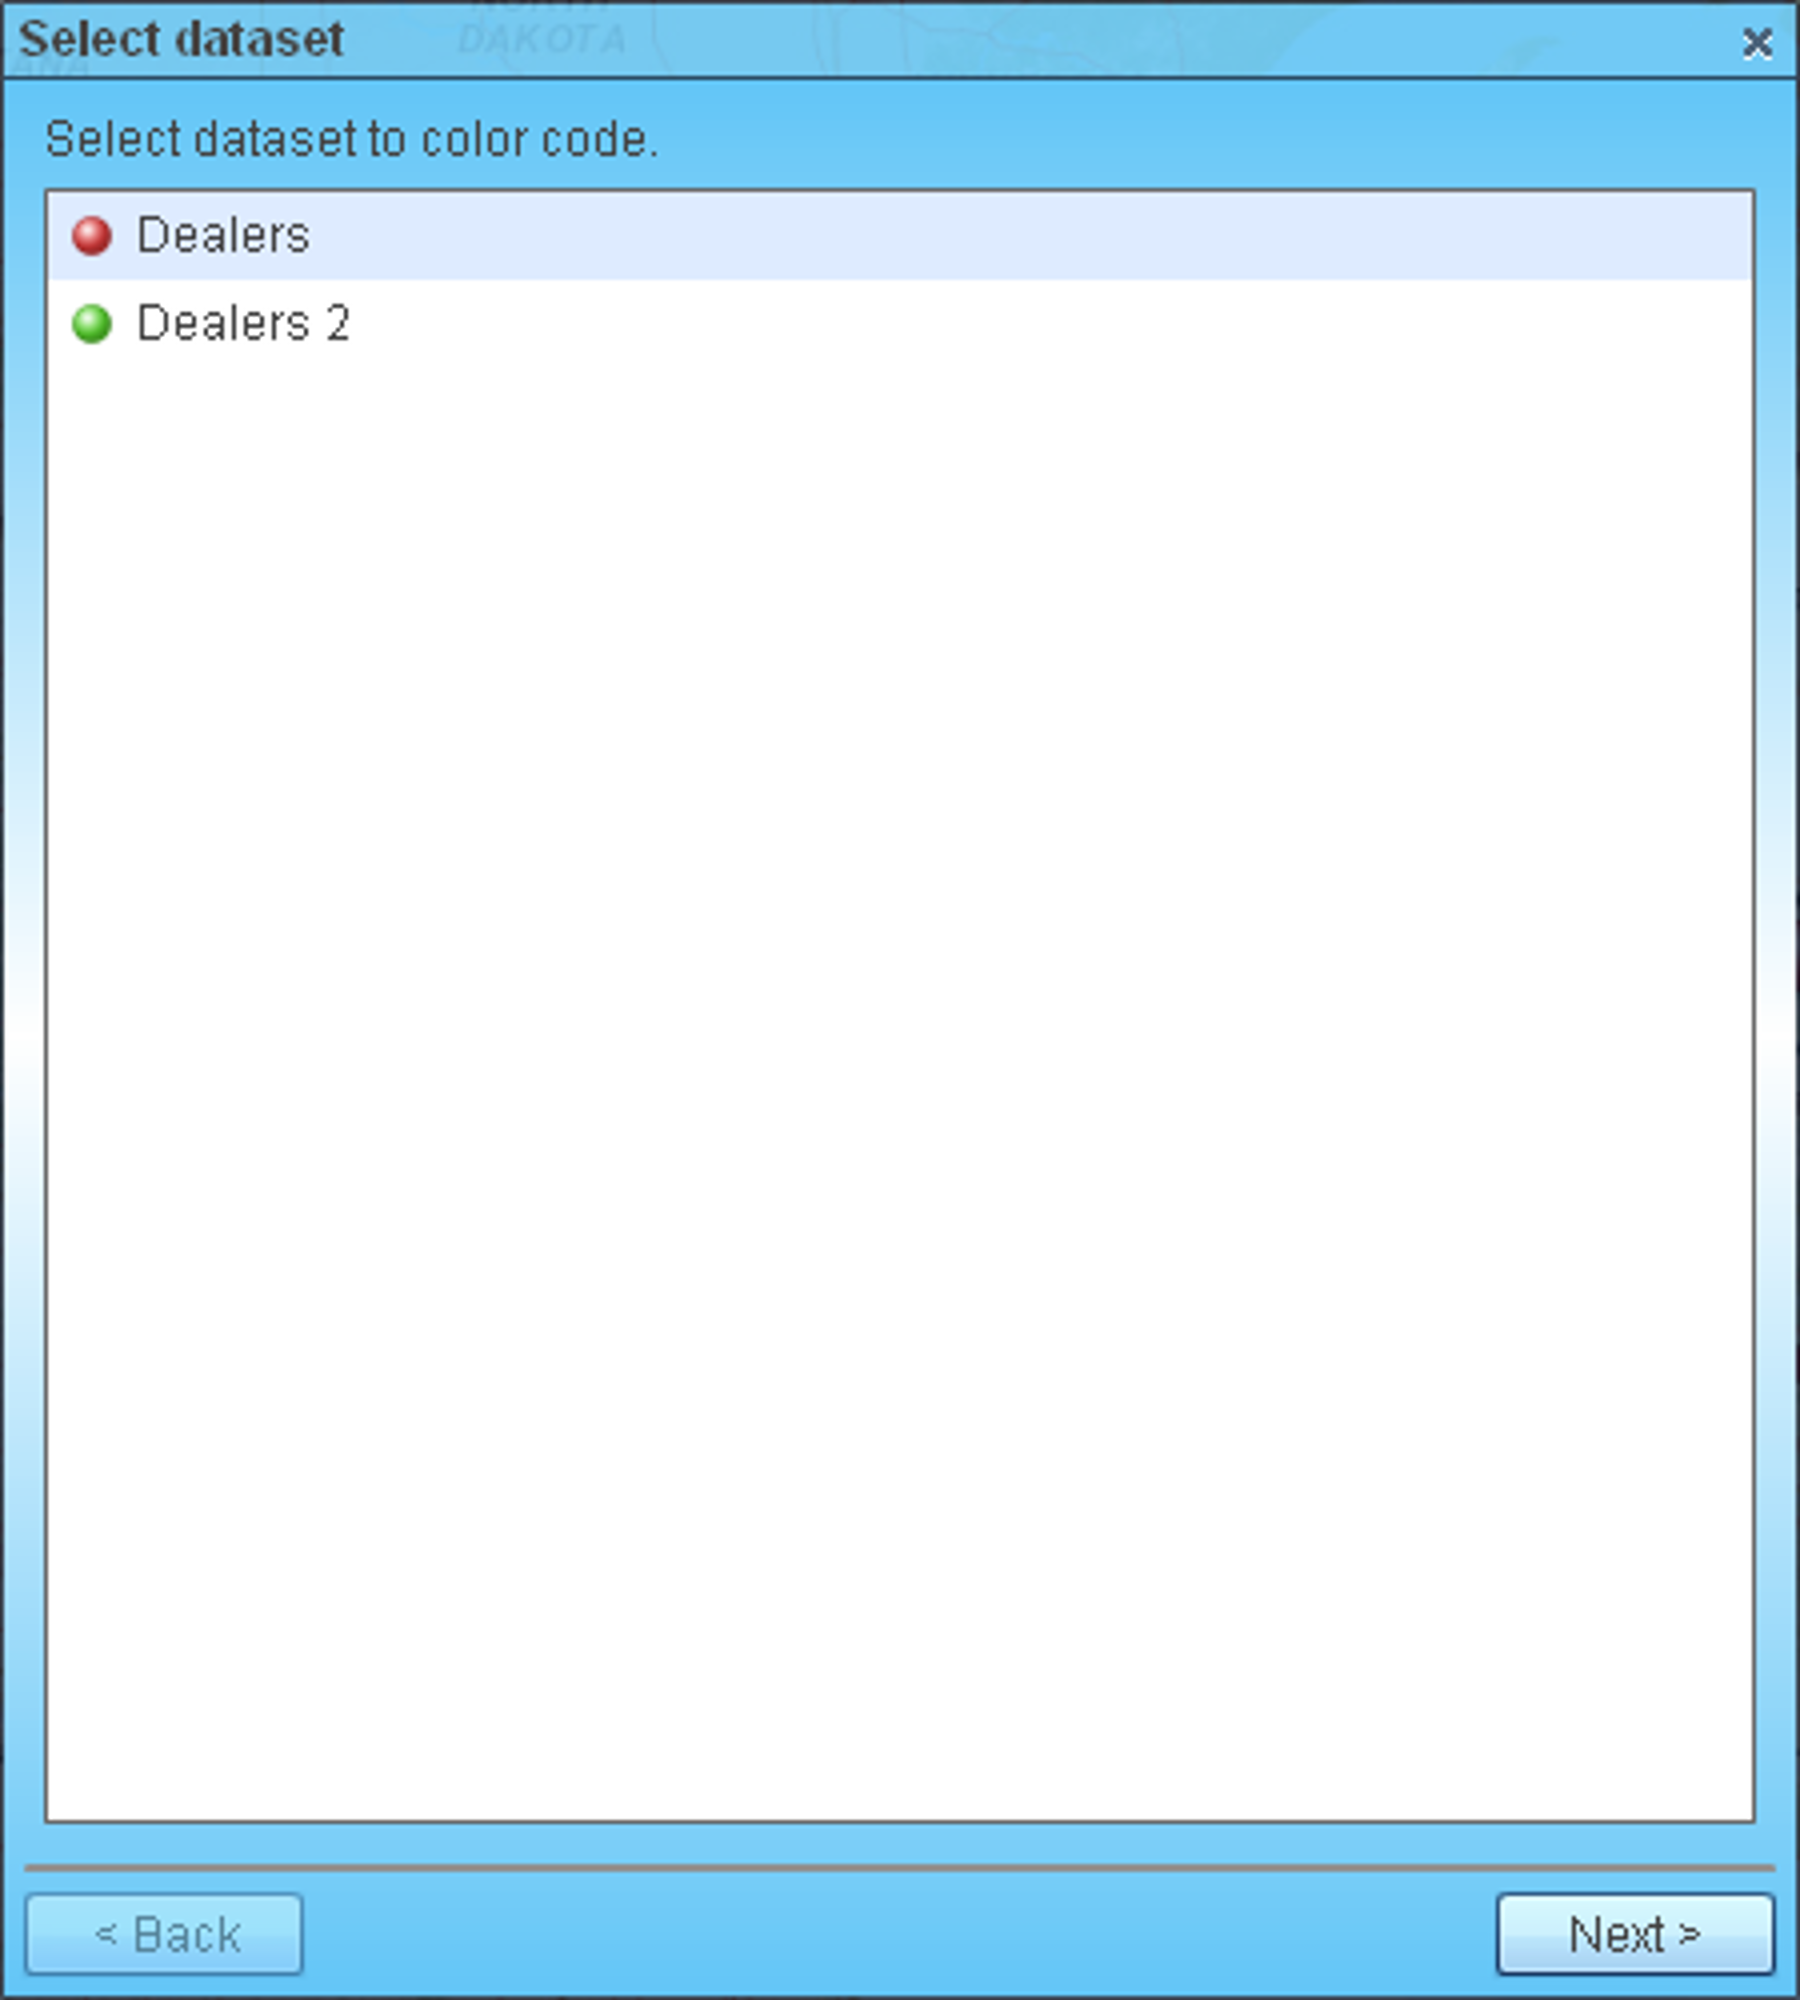
- If you have plotted several data files on map, select one to color code and click ‘Next’ button. Otherwise just skip this step.
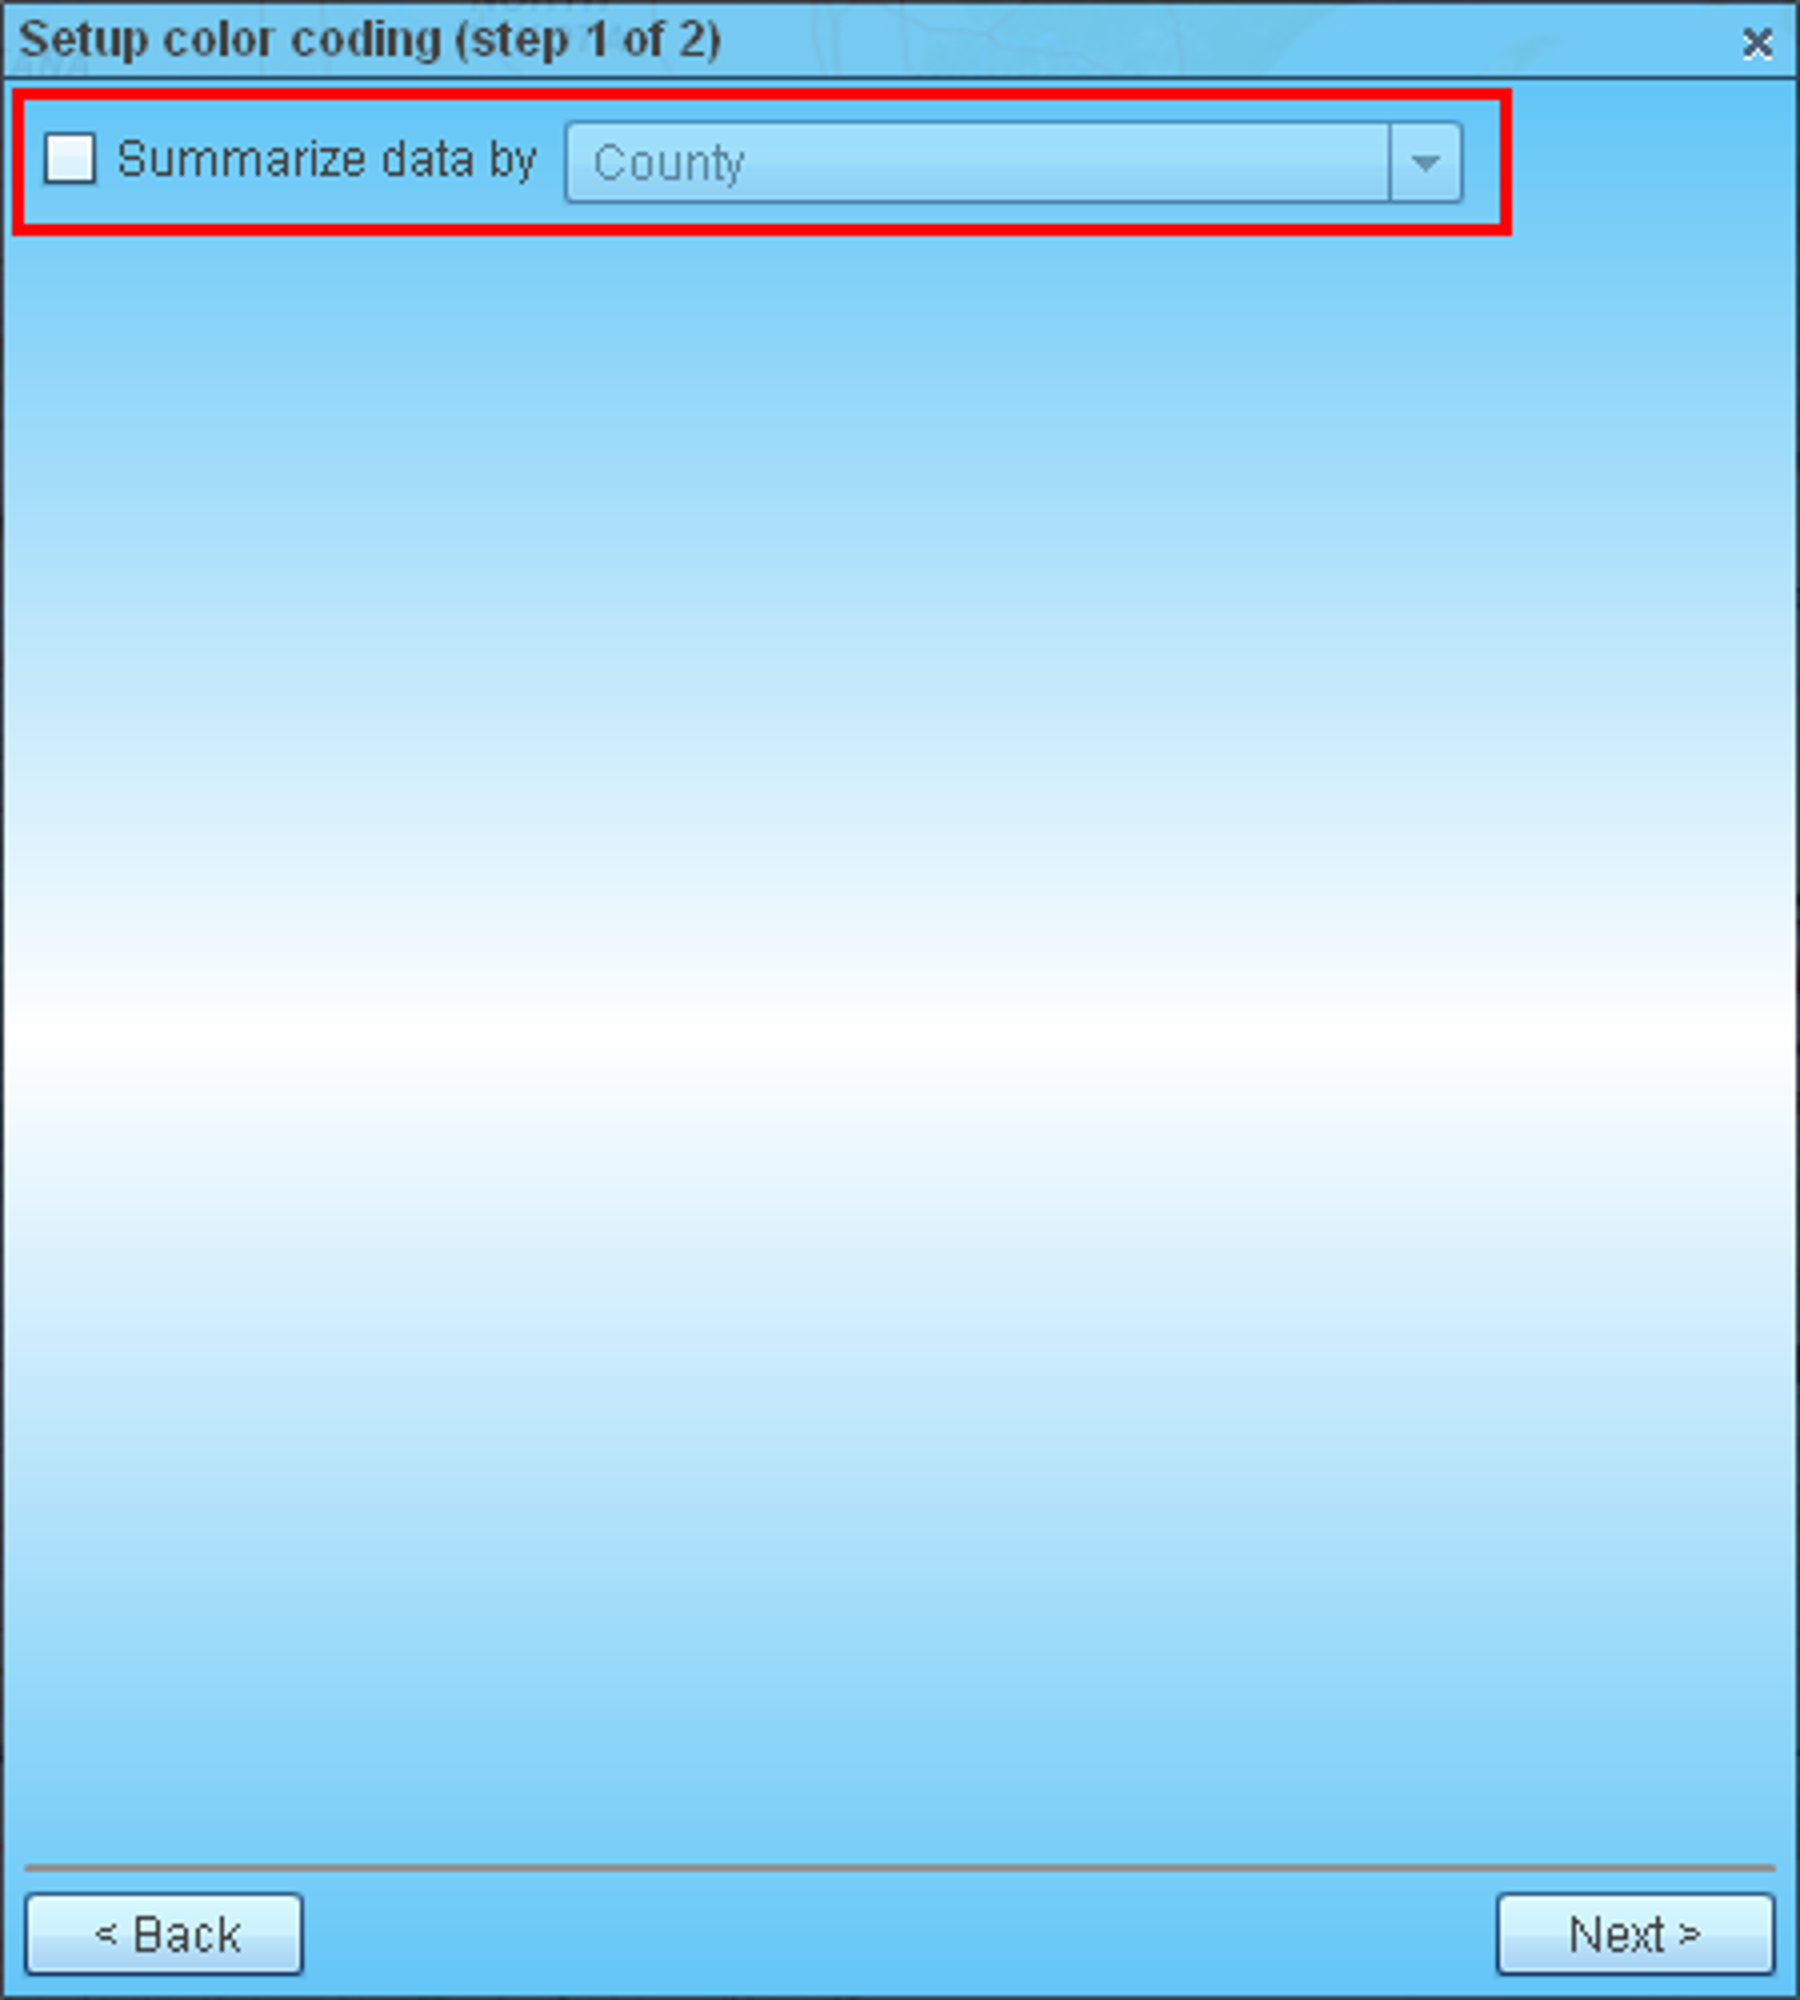
- Check the box if you want to summarize data by territory/geography such as State, County, or ZIP code. If you summarize data by state, for example, then Map Business Online will put color-coded symbol at state’s center point with data aggregated from all locations plotted in the state. That is sort of clustering plotted locations for you to visualize count of customer by county or sales by state.
If you leave the check box unchecked then MapBusinessOnline will color code dataset locations at their actual positions such as address or city (depending on what you selected in Plot data wizard).
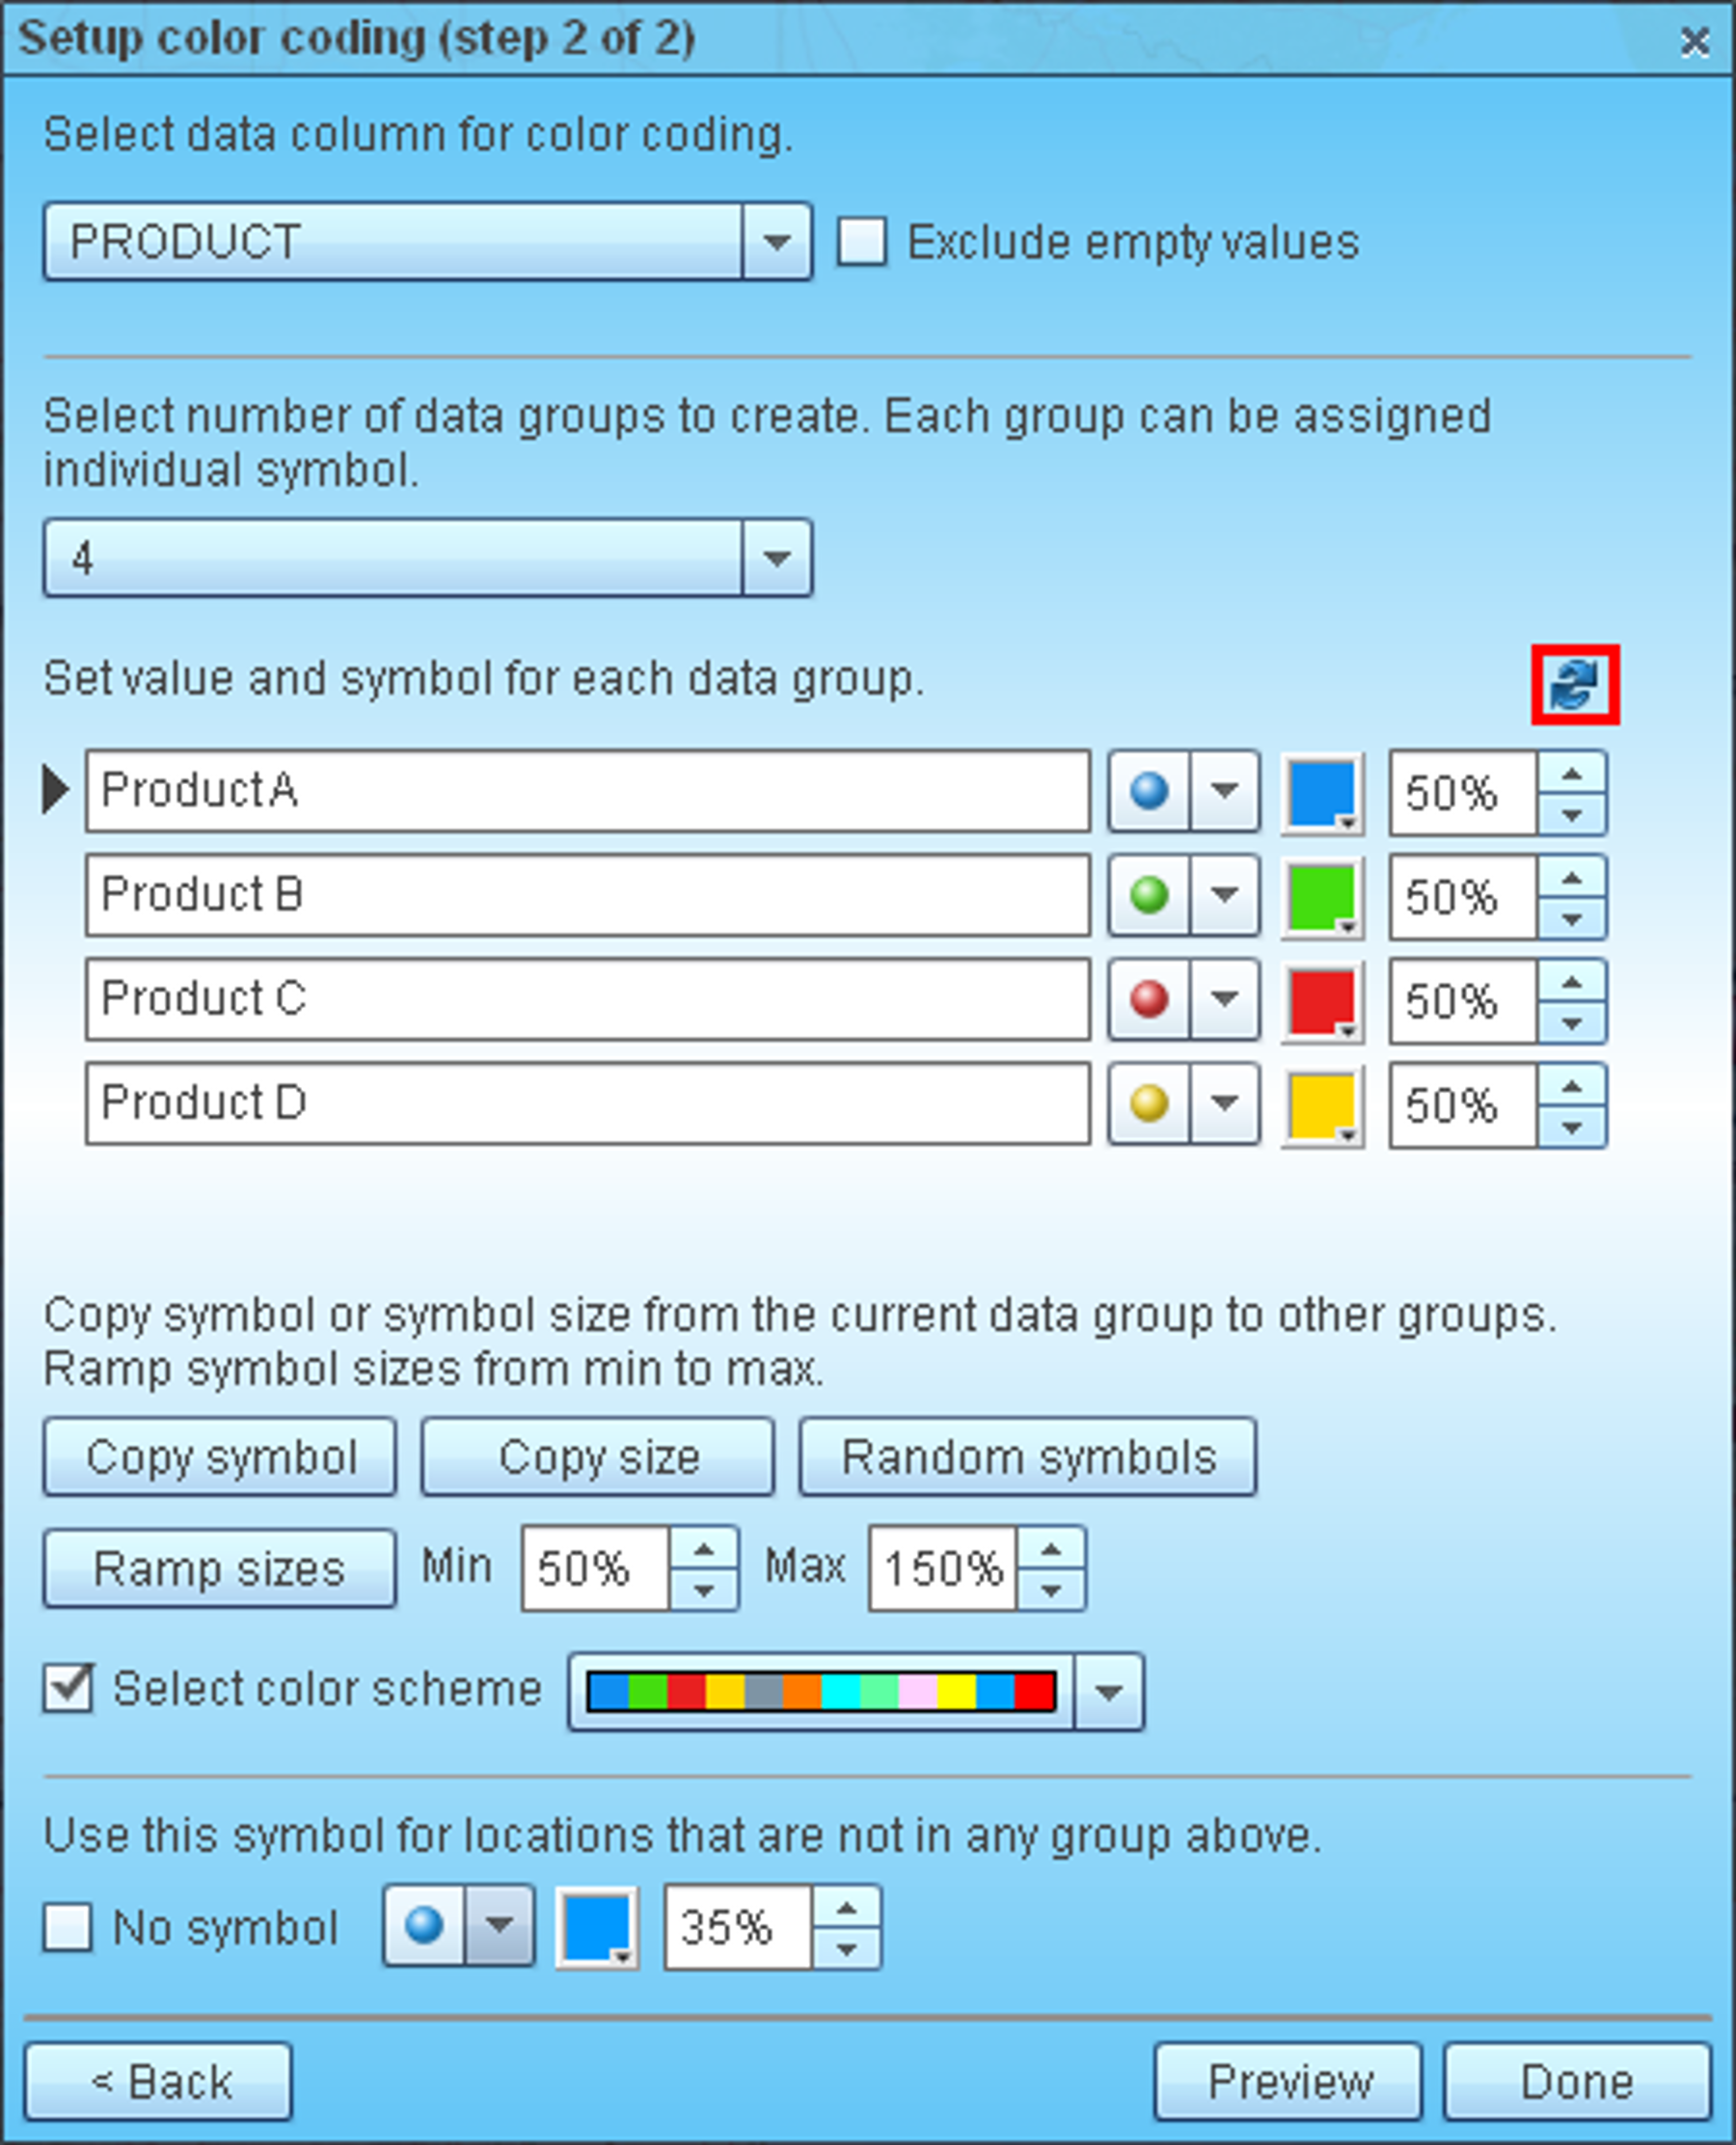
- On ‘Define color coding’ page choose following color coding options:
- Select data column with desired business data, for example sales or product name. You can exclude empty values for text data column or negative/positive/zero values for numeric data columns. There is also the option to use unique values for numeric data.
- Choose number of data groups you want to create, for example number of products.
- For each group select a symbol, its color and size.
- There is black arrow icon to the left of group list. It points to the current group. You can copy symbol or size from the current group to other groups. You can also randomize symbols or ramp symbol sizes for all groups.
- You can choose a ramped color scheme for symbols.
- Select a symbol to display data records that don’t fall into any of defined groups. You can select No symbol option to not draw such data records at all on map.
Click ‘Preview’ button to see color-coding on map without closing this page.
Click ‘Done’ button to apply color-coding to map and to close the page.
- Now each selected data group is represented by its own symbol.