Create heat map
This article describes how to create a heat map.
Related article: Color code map or territories
With heat maps you can highlight areas that generate more business, have more customers, or have higher potential for new business.
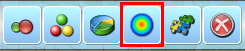
- Click ‘Heat map’ icon on MapBusinessOnline toolbar.
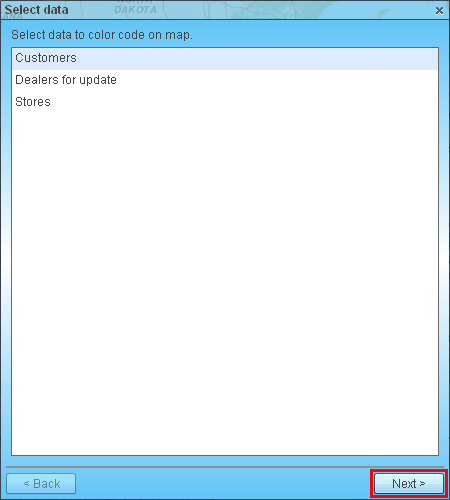
- Select dataset (if you have more than one on map) that you want to use in heat map. Click ‘Next’ button.
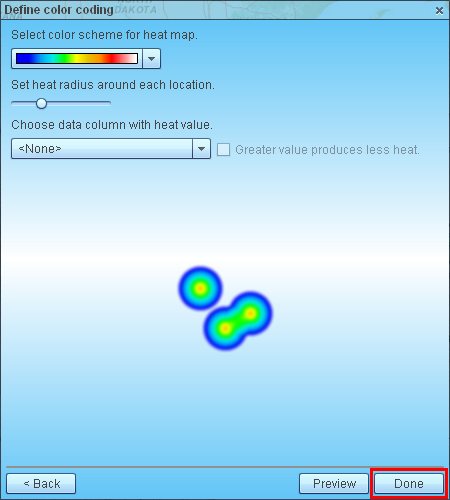
- Choose heat map options: color scheme and heat radius. You can create heat by locations count (each location has the same heat level) or by values in a data column. For example choose Sales column to show more heat where you have more sales.
Click Done when ready.
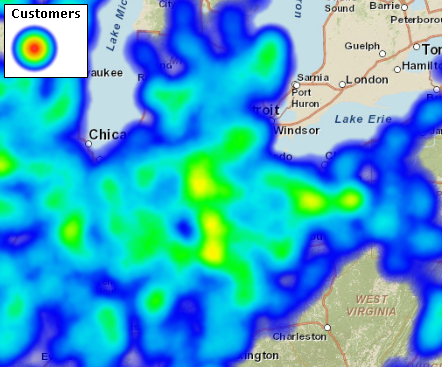
- The heat map is ready!