Make business coverage map
This article shows how to highlight area on map where you do business. Let’s say you have Excel file with your customer locations in Texas and you want to create coverage map by ZIP code - color ZIP codes where you have customers.
- Start by plotting your customers on map. Refer to this article for detailed instructions: Plot data from Microsoft® Excel.
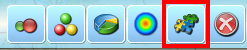
- By now you must have all customer locations displayed on map. Let’s create the coverage map. Click ‘Color code map’ icon on the main toolbar to start ‘Color code map’ wizard.
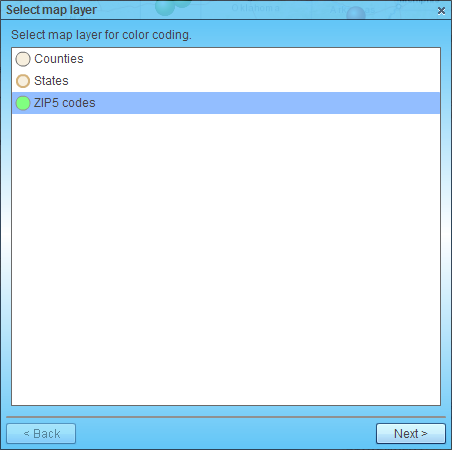
- In the first dialog select ZIP5 code layer. Hit ‘Next’.
If you don’t have ZIP5 layer listed, please visit this page for instructions on how to select Custom map template.
- In the next dialog do the following:
- Choose the customer dataset and Count as column for color-coding. In this article customers are located in ‘Contacts in tx’ dataset. Count column contains number of customers in a ZIP code. You can choose total sales as well to highlight ZIP codes with sales numbers.
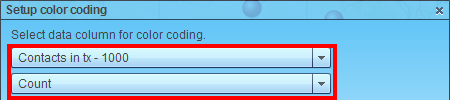
- Check the box to exclude 0 values (ZIP codes which have no business).

- Select number of color ranges. If you have maximum 1 location per ZIP code then select just 2 ranges (the minimum). Pick a color scheme for coverage area or choose color for each range.
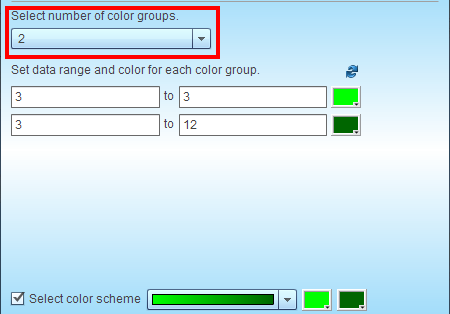
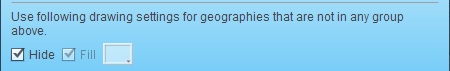
- Finally check ‘Hide’ box to not display ZIP codes that have no customers. Or uncheck it and select the fill color for no-business areas.
- Click ‘Next’.
- Choose the customer dataset and Count as column for color-coding. In this article customers are located in ‘Contacts in tx’ dataset. Count column contains number of customers in a ZIP code. You can choose total sales as well to highlight ZIP codes with sales numbers.
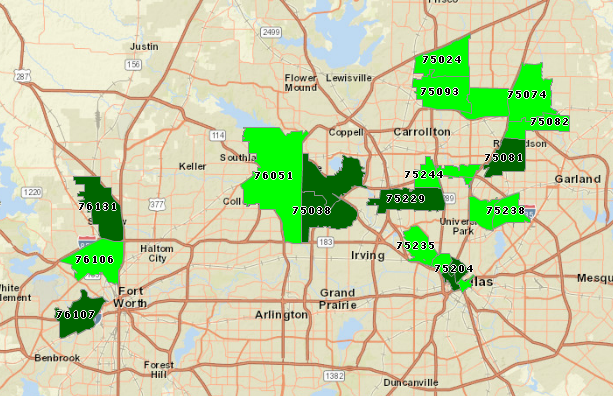
- MapBusinessOnline will color and display ZIP code coverage map. You may want to make dataset locations invisible by unchecking corresponding boxes in Map & Data window. Zoom in to coverage map if necessary.
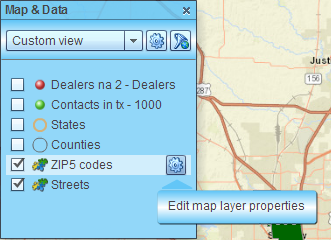
- There is the option to make the coverage map semi-transparent. Stop mouse pointer over ZIP5 code layer in Map & Data window and click gear button to edit the layer properties.
 Check ‘Transparent’ box in Manage map and data dialog with General vertical tab selected.
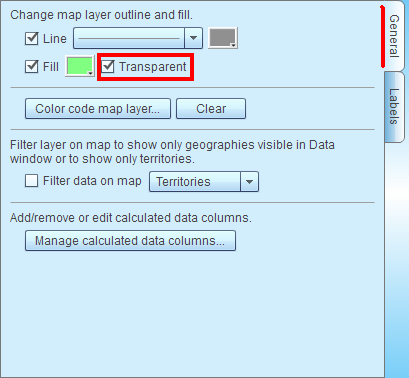
- The alternative to highlighting business coverage area with color-coding is creating territory. Following are instructions on creating coverage territory map. Start by clearing color-coding for the coverage map we have just created.
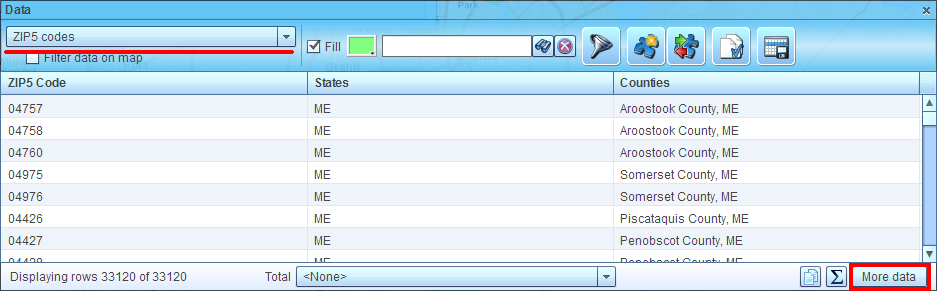
- Open Data window and select ZIP5 code layer to view. Click ‘More data’ button on Data window status bar.
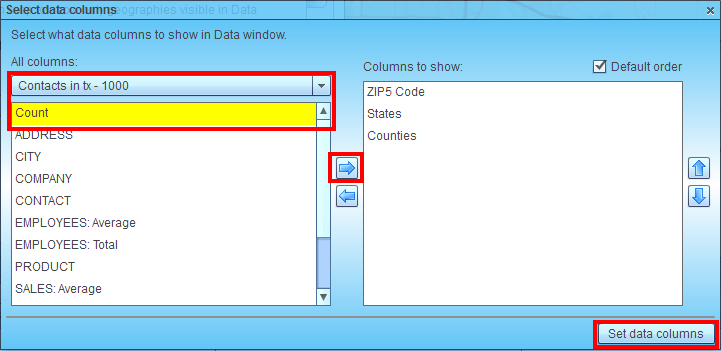
- In the dialog that will popup select the dataset with customer locations (‘Contacts in tx’ in this article) and Count in the list below. Click right arrow to add the Count column to Data window. Finally click ‘Set data columns’ button.
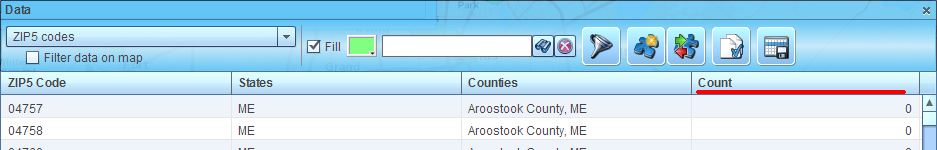
- Now you will have Count column added to Data window. It shows number of customers in a ZIP code.
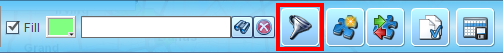
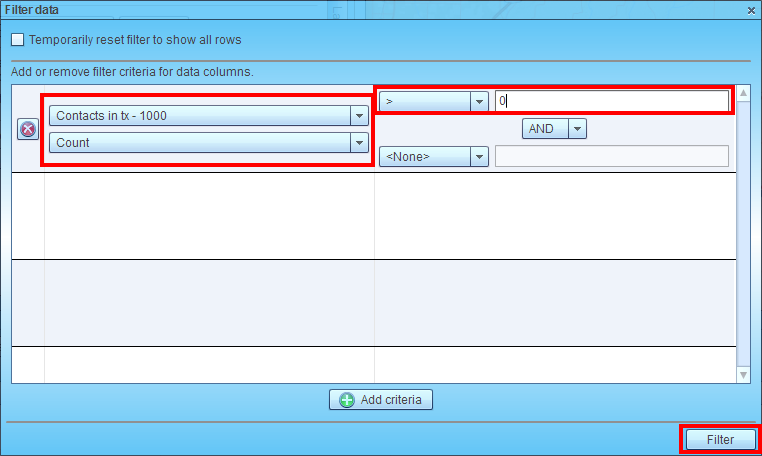
- Click funnel icon on the Data window toolbar to start ‘Filter data’ dialog.
- Setup the filter to show only ZIP records with count > 0. Click ‘Filter’.
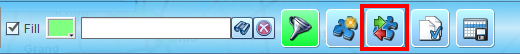
- Now Data window displays only records with customer locations. To create coverage territory click blue puzzle with green and red arrows icon on Data window toolbar.
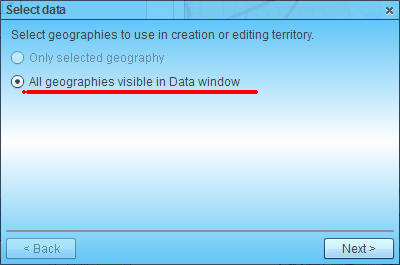
- In the ‘Select data’ dialog choose ‘All geographies visible in Data window’. Click ‘Next’.
- In the next dialog enter territory name and hit ‘Create’.
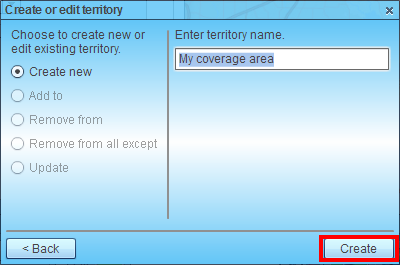
- Coverage territory map is ready!


