Visualize sales territories
With MapBusinessOnline you can show sales territories by state, county, or ZIP5 code. MapBusinessOnline is not yet full sales territories design product so you can only visualize your sales territories compared to automatically balancing territories, showing sales data by territory, etc.
- You need Microsoft Excel (or comma/tab separated text) file with sales territories. In example below territories are defined by state. You can use state full name or state abbreviation.
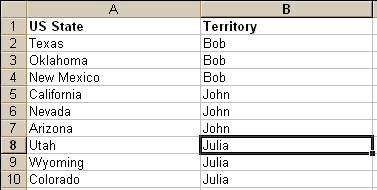
- Plot this Microsoft Excel file on map. Follow this link for instructions: Plot data from Microsoft® Excel. When plotting data select Territory column for color coding.
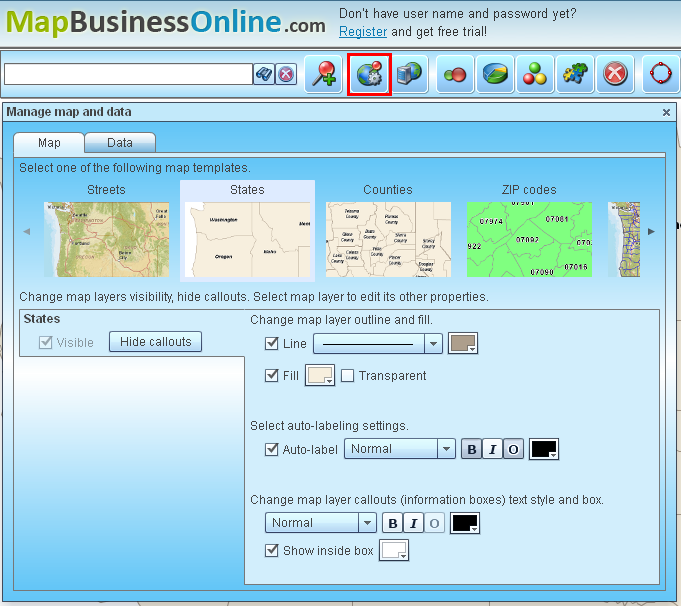
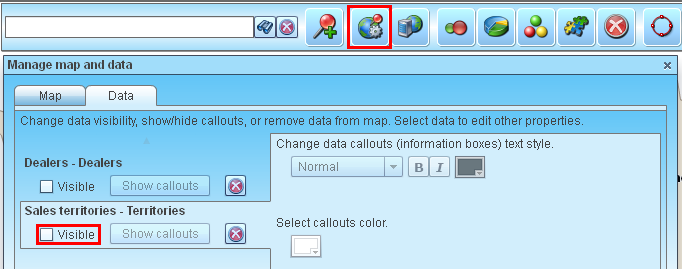
- Click ‘Manage map and data’ on MapBusinessOnline toolbar, active ‘Map’ tab, and select States template.
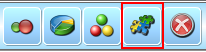
- Click ‘Color code map’ on MapBusinessOnline toolbar.
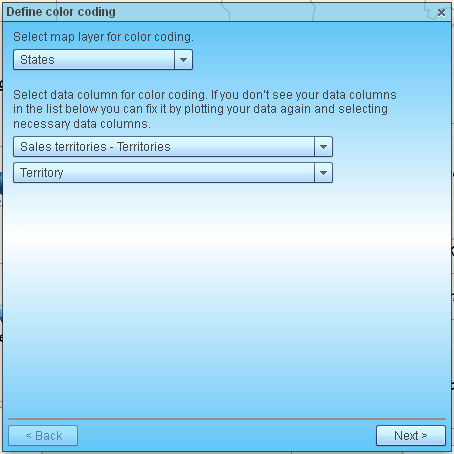
- On the first page select States, your territories file, and territories column. Click ‘Next’.
- On the second page MapBusinessOnline will automatically select territories. You can change colors assigned to each territory. You can also select color for states that are not in any territory.
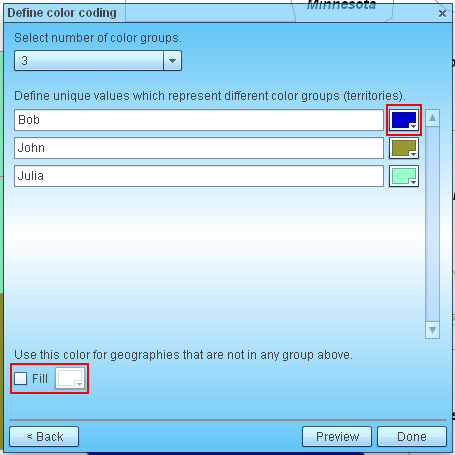
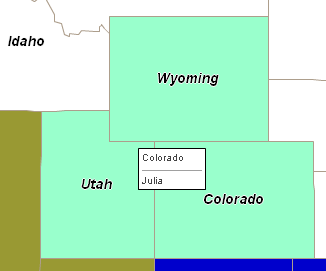
- Click ‘Done’ on the page above and you will see following map.
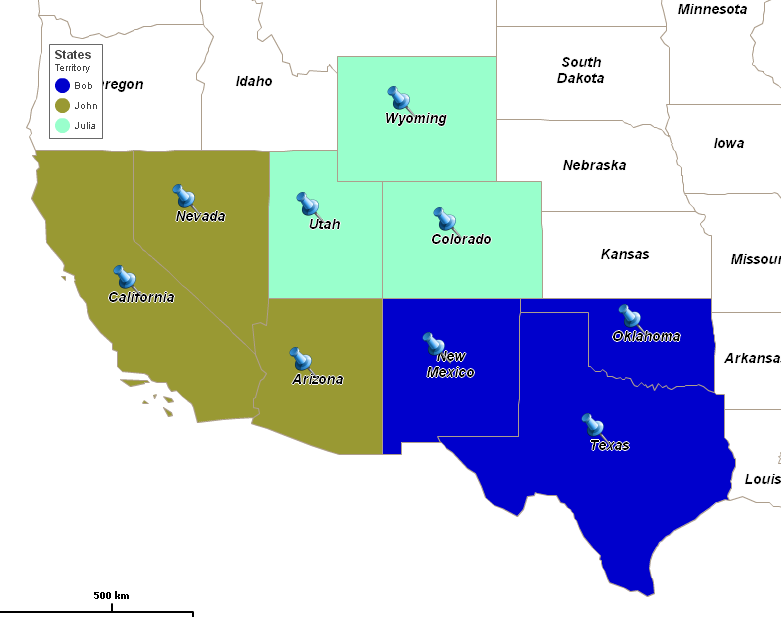
- To further improve map look hide pushpins from map.
- Click a territory to add its label to map.