Number Locations on Map
This article describes how to mark customer or store locations with a number on map.
Related article: Color code dataset locations with circles.
Sometime you may need to number locations sequentially on map. In MapBusinessOnline you can show location number within circle.
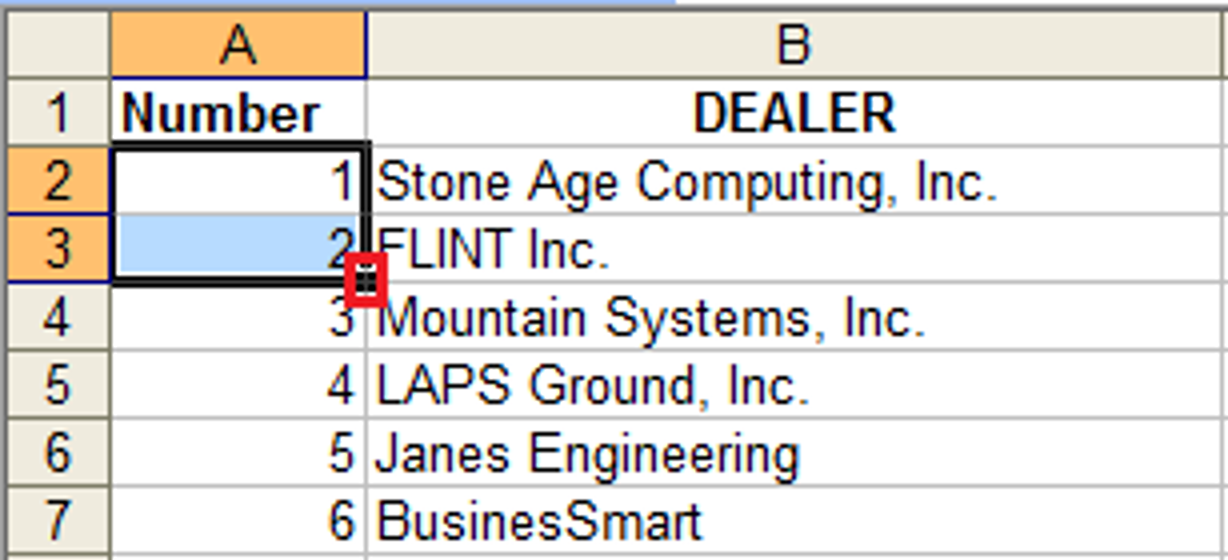
- First of all you need to add Number column to your Excel or text file as you can see on the picture below. Excel has variety of options to number rows. One is to enter row number for first two rows, select cells with these numbers, and then drag selection’s bottom right corner to fill numbers for other rows. Refer to Excel manual for more information.
- Plot data on map as described in following article: Plot data from Microsoft® Excel or Plot data from text file. Make sure that you select Number column as additional data column or check ‘Import all other data columns for reference’ box.
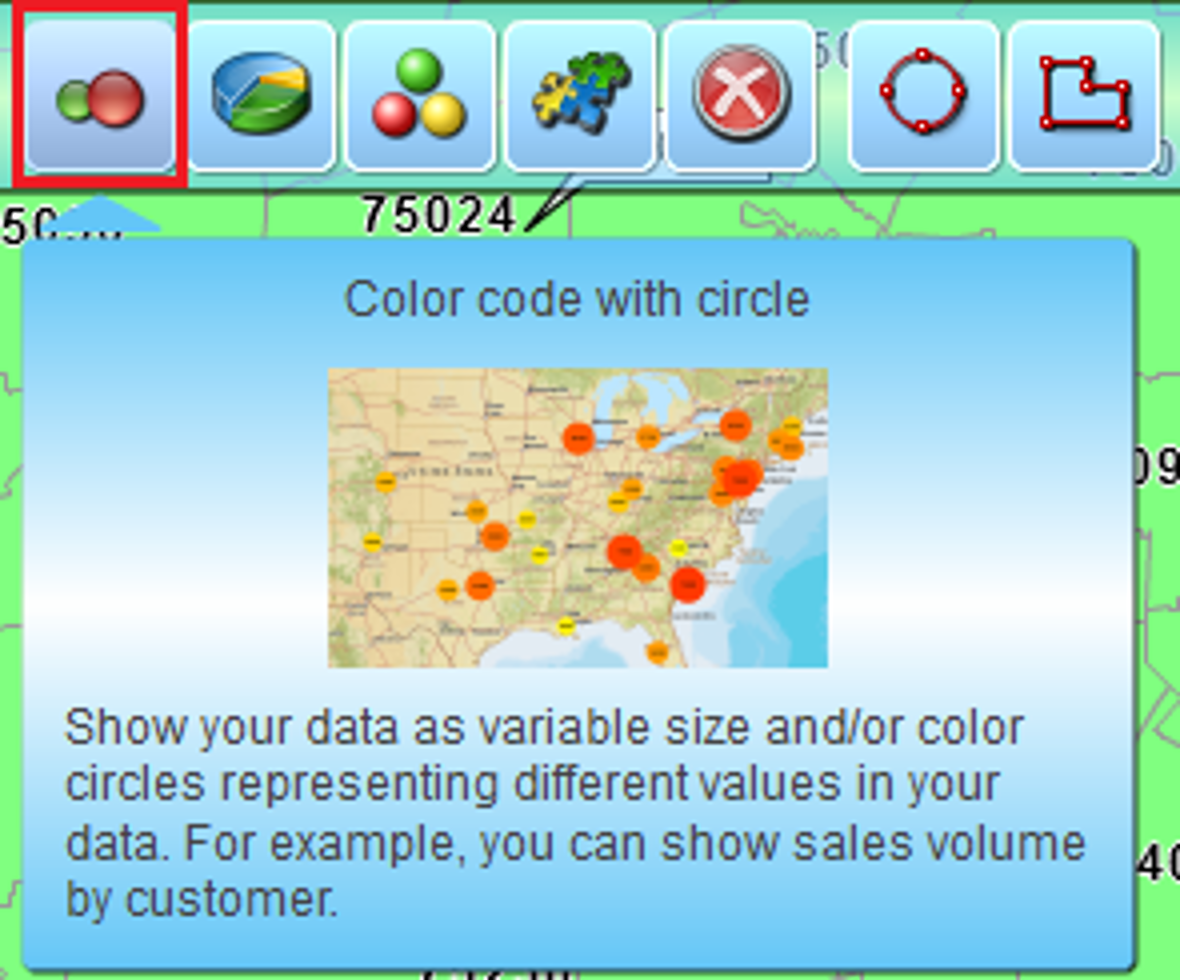
- Click color-coding with circle icon on MapBusinessOnline toolbar (see below).
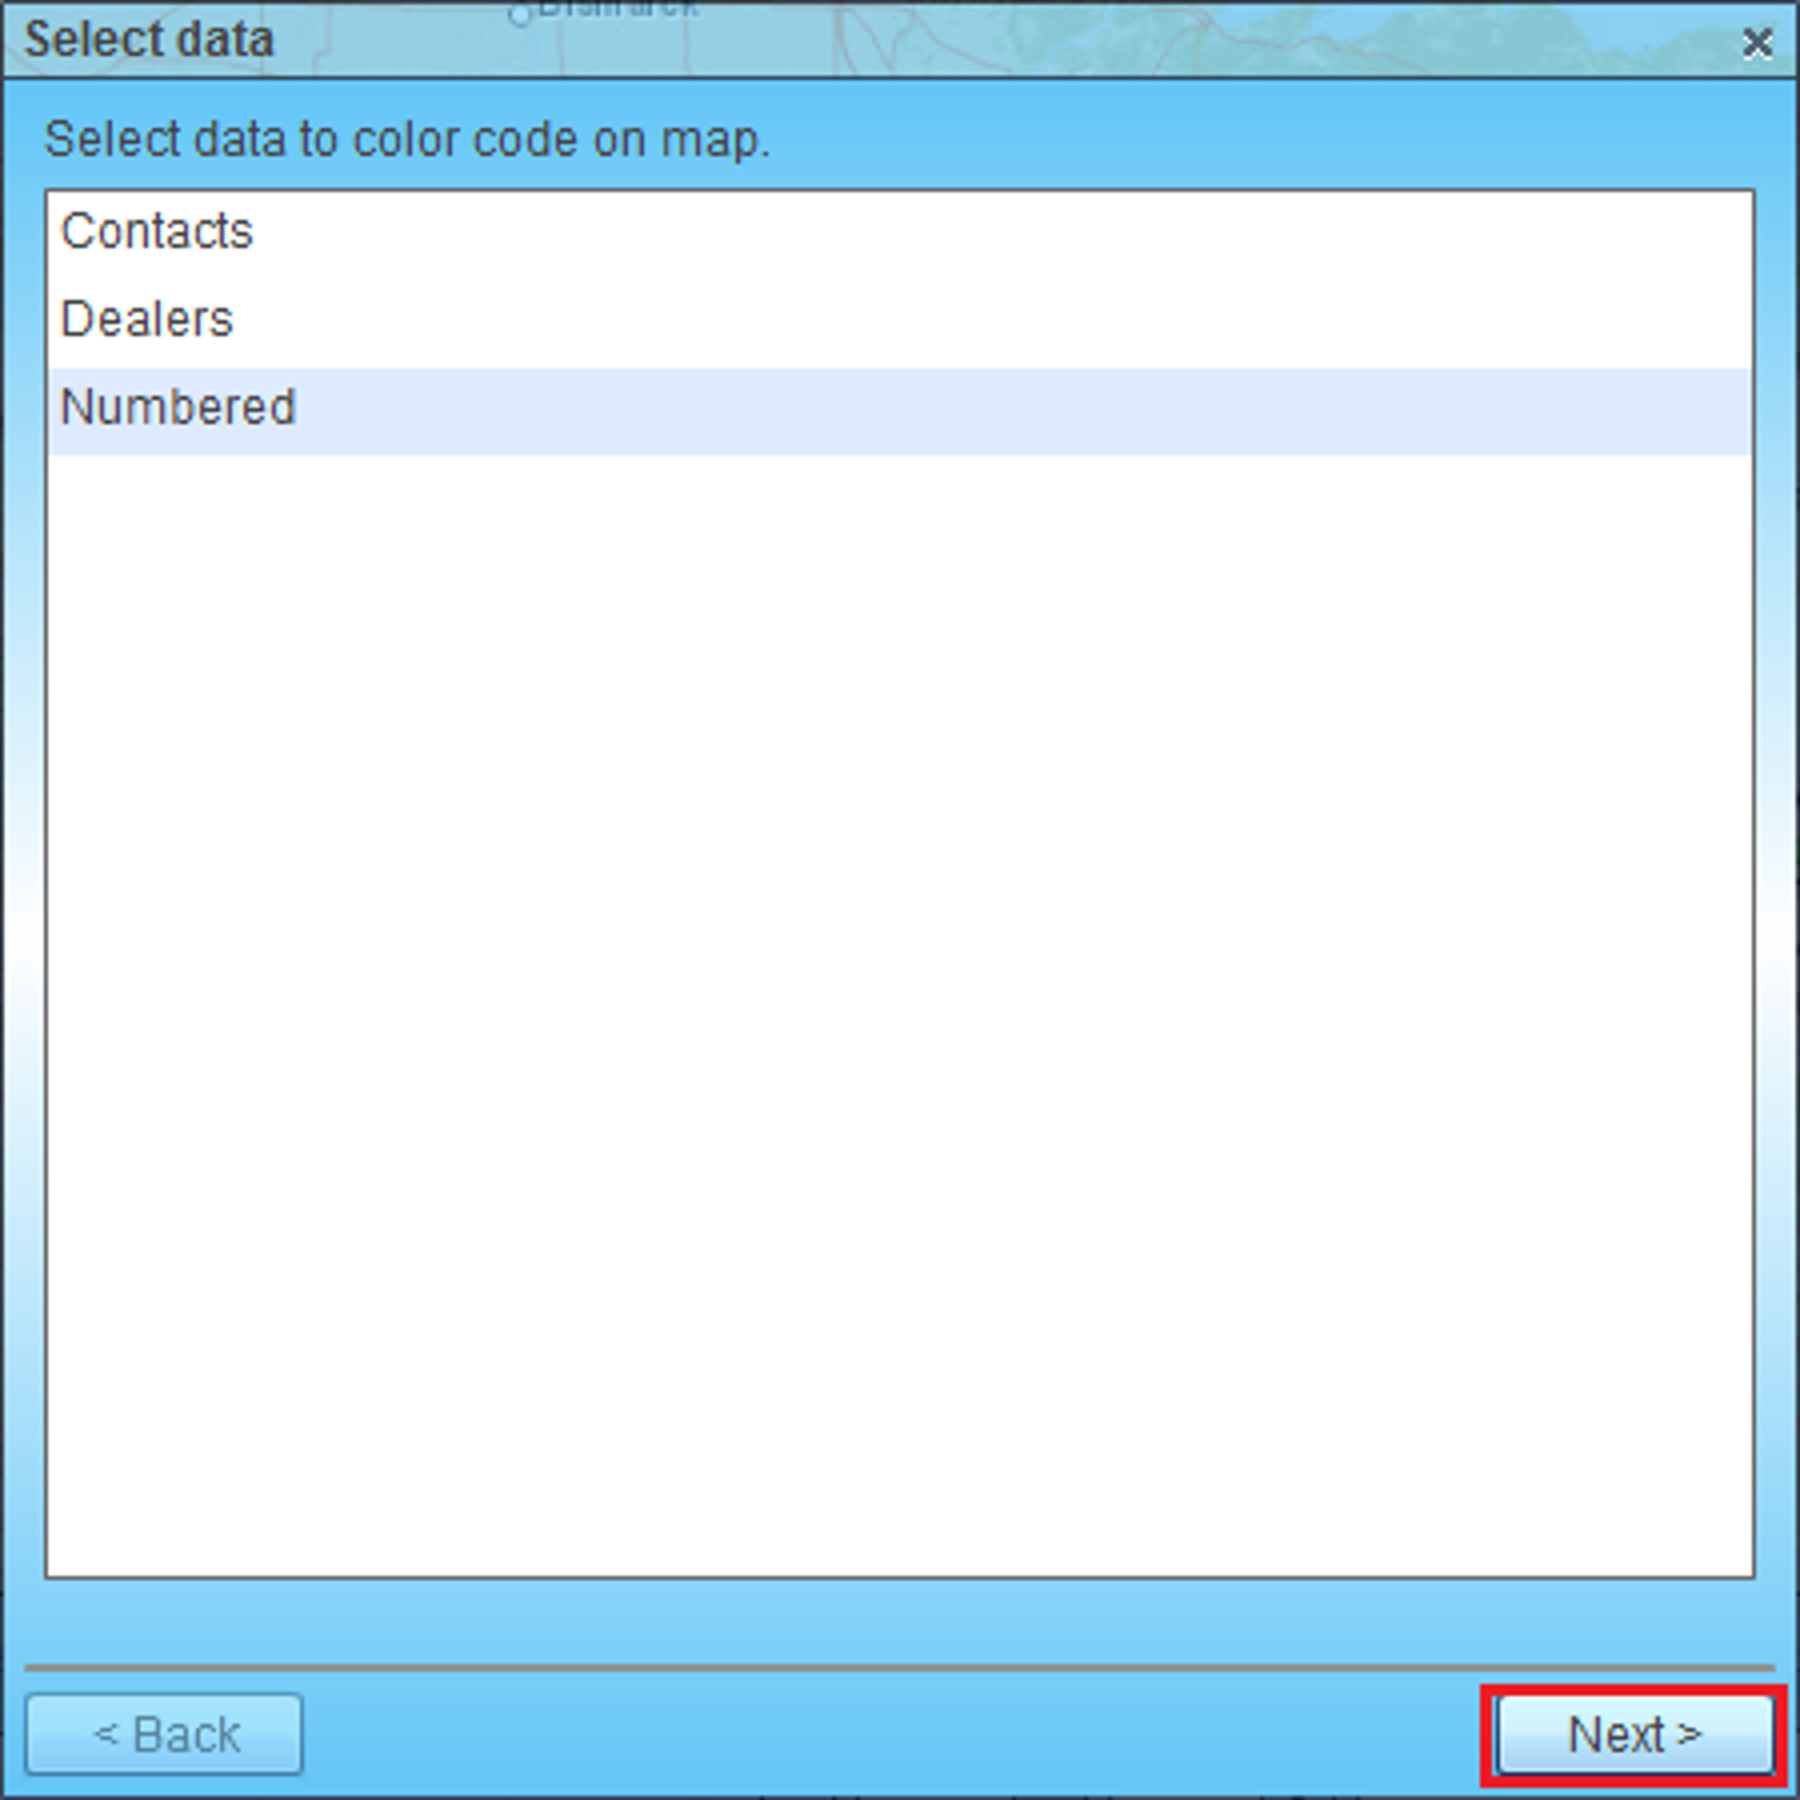
- Following page will appear only if you have more than one dataset on map. Select dataset that has numbered locations.
Click Next button.
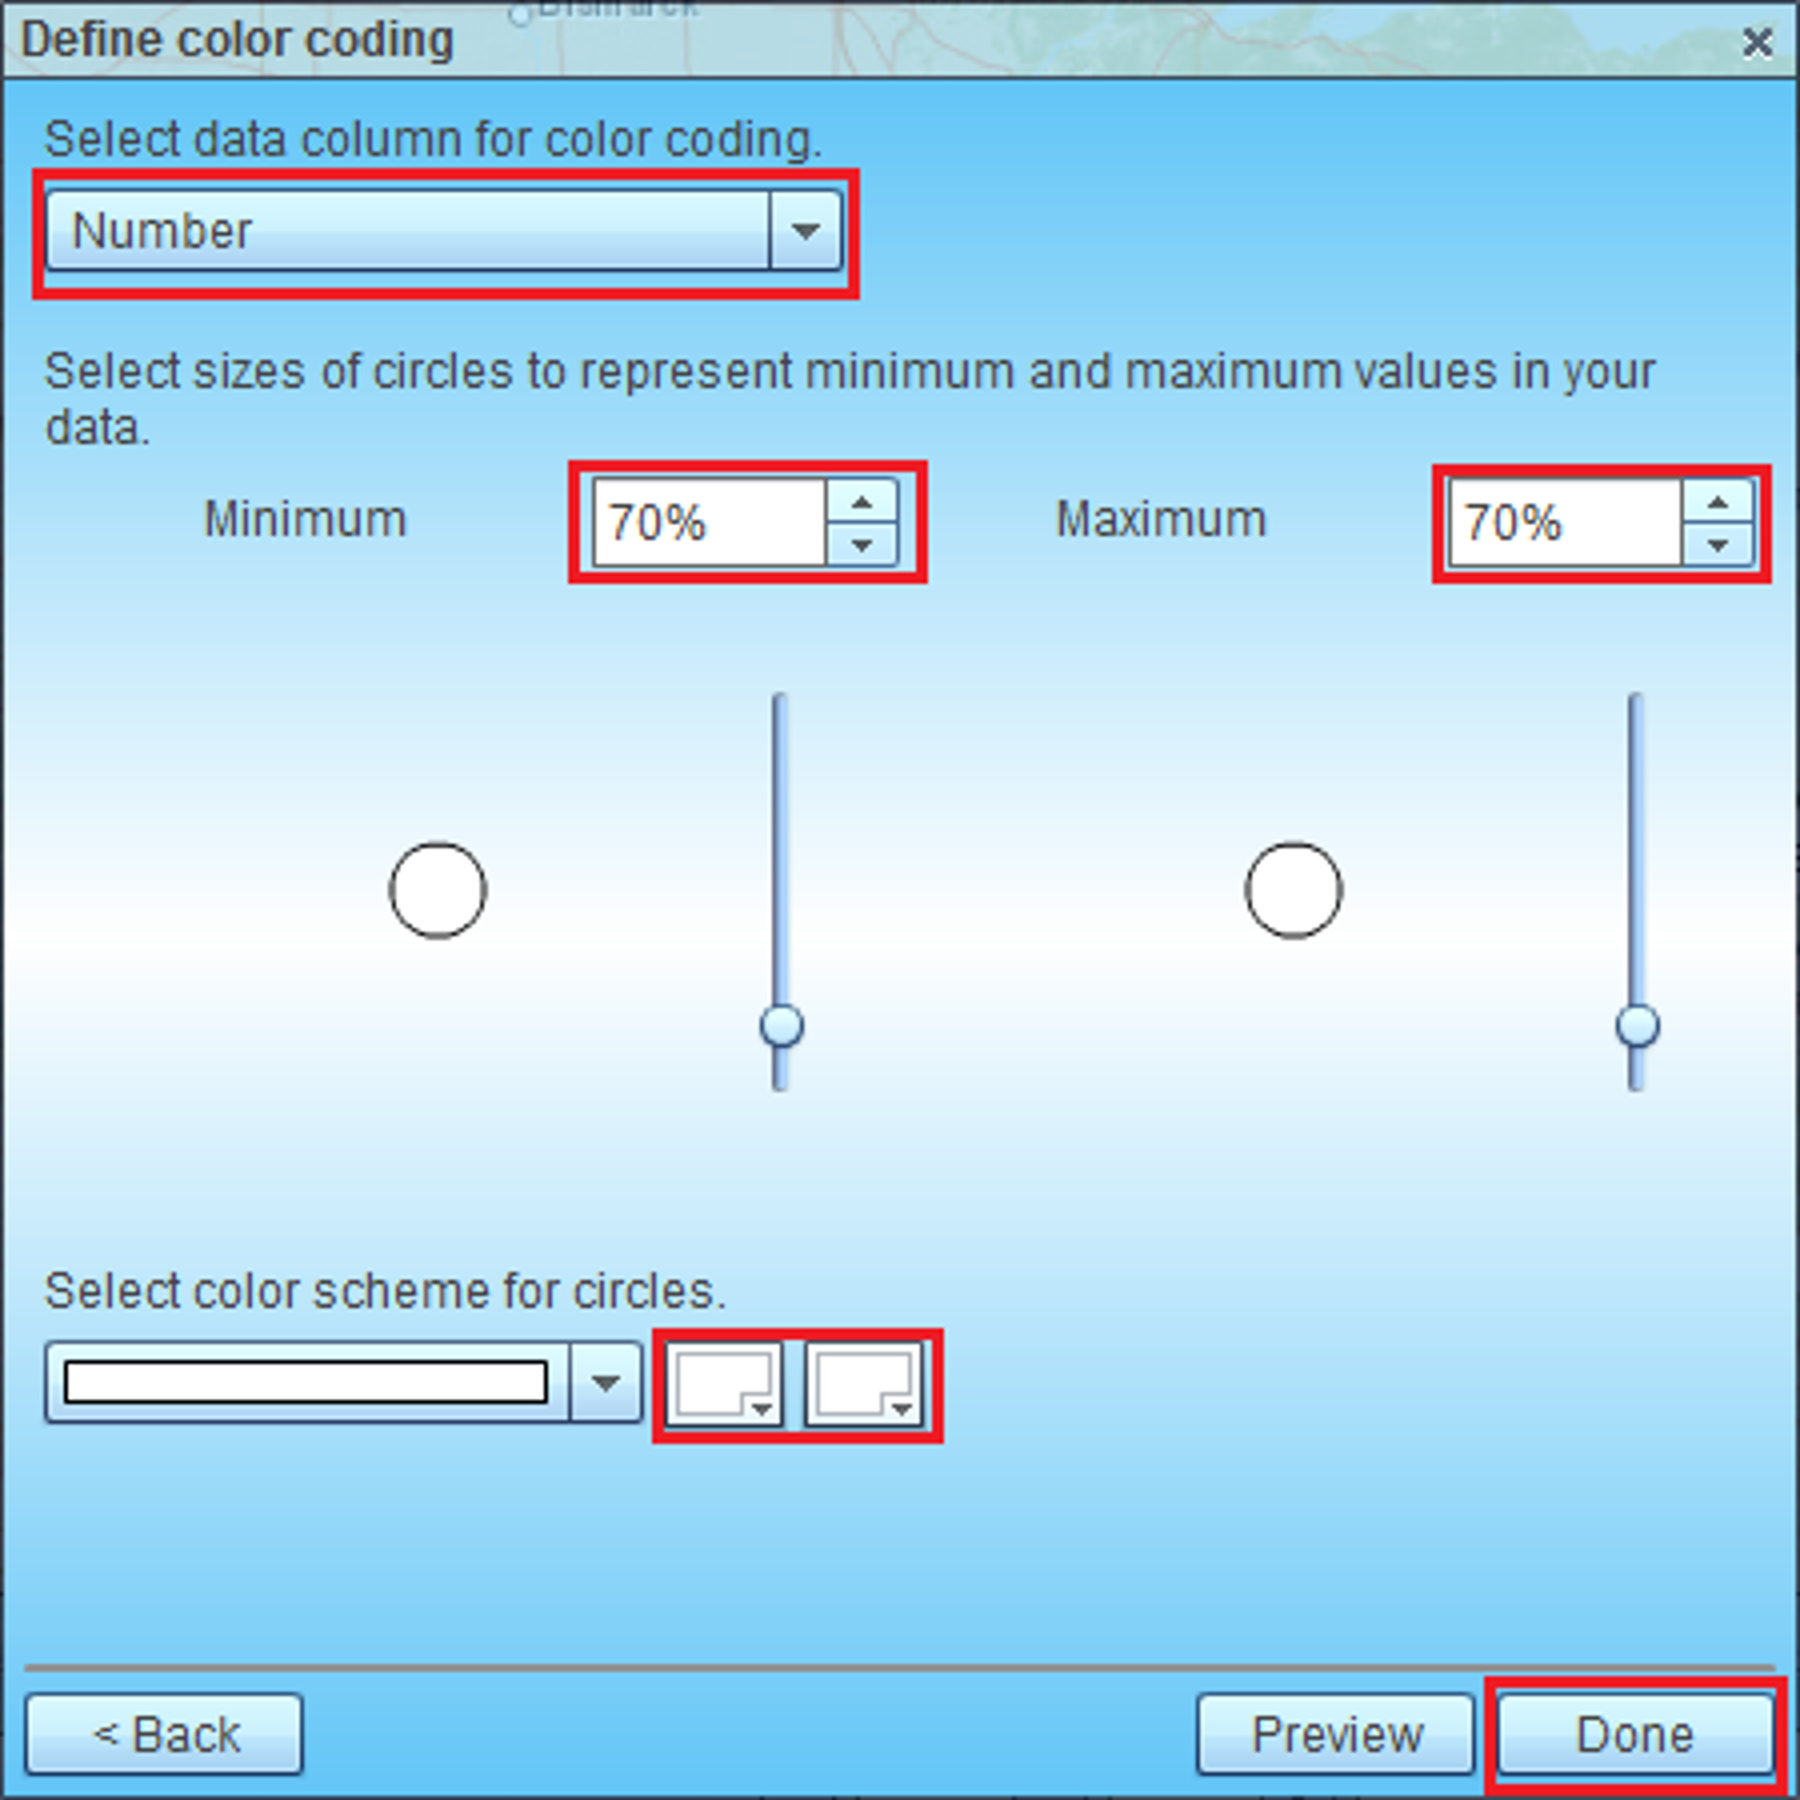
- On ‘Define color coding’ page in the box at the top select data column that has location numbers.
Set minimum and maximum size to 70%. That size works well for numbers up to 99. If you have greater numbers increase size respectively.
Choose the same color in both color boxes (see below). If you choose different colors then actual circle color will change from first color to second color depending on number. Use light colors so that black numbers are better readable.
Click Done button.
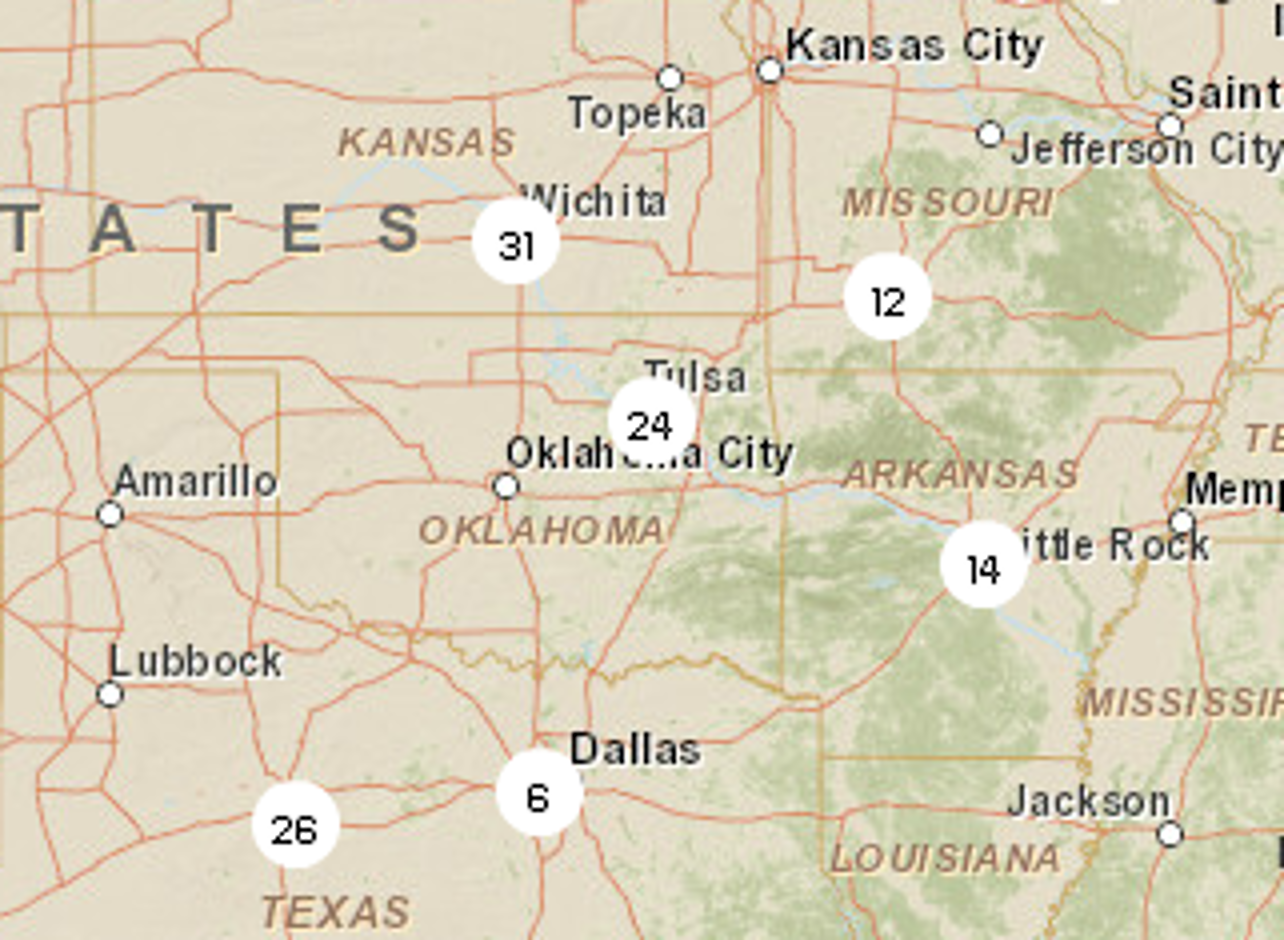
- Now you must get a map similar to one below.