Plot Data from Microsoft® Excel
MapBusinessOnline supports a variety of Microsoft Excel file formats (xls and xlsx). To plot your data from a Microsoft Excel file, follow the steps below:
- If your data comes from a CRM system, contact manager application, or accounting package, importing the data shall be trivial as the data is already organized for a mapping application to read it. Otherwise, follow the guidelines described in the article to prepare the data for plotting.
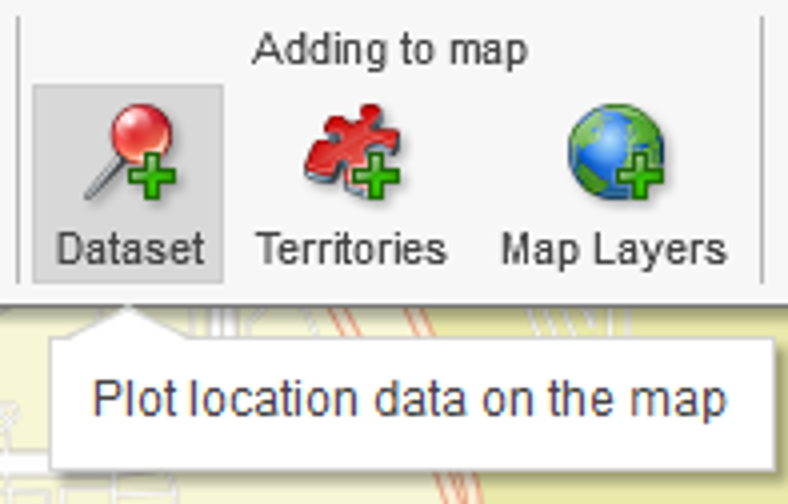
- Click the Dataset button on the main toolbar.
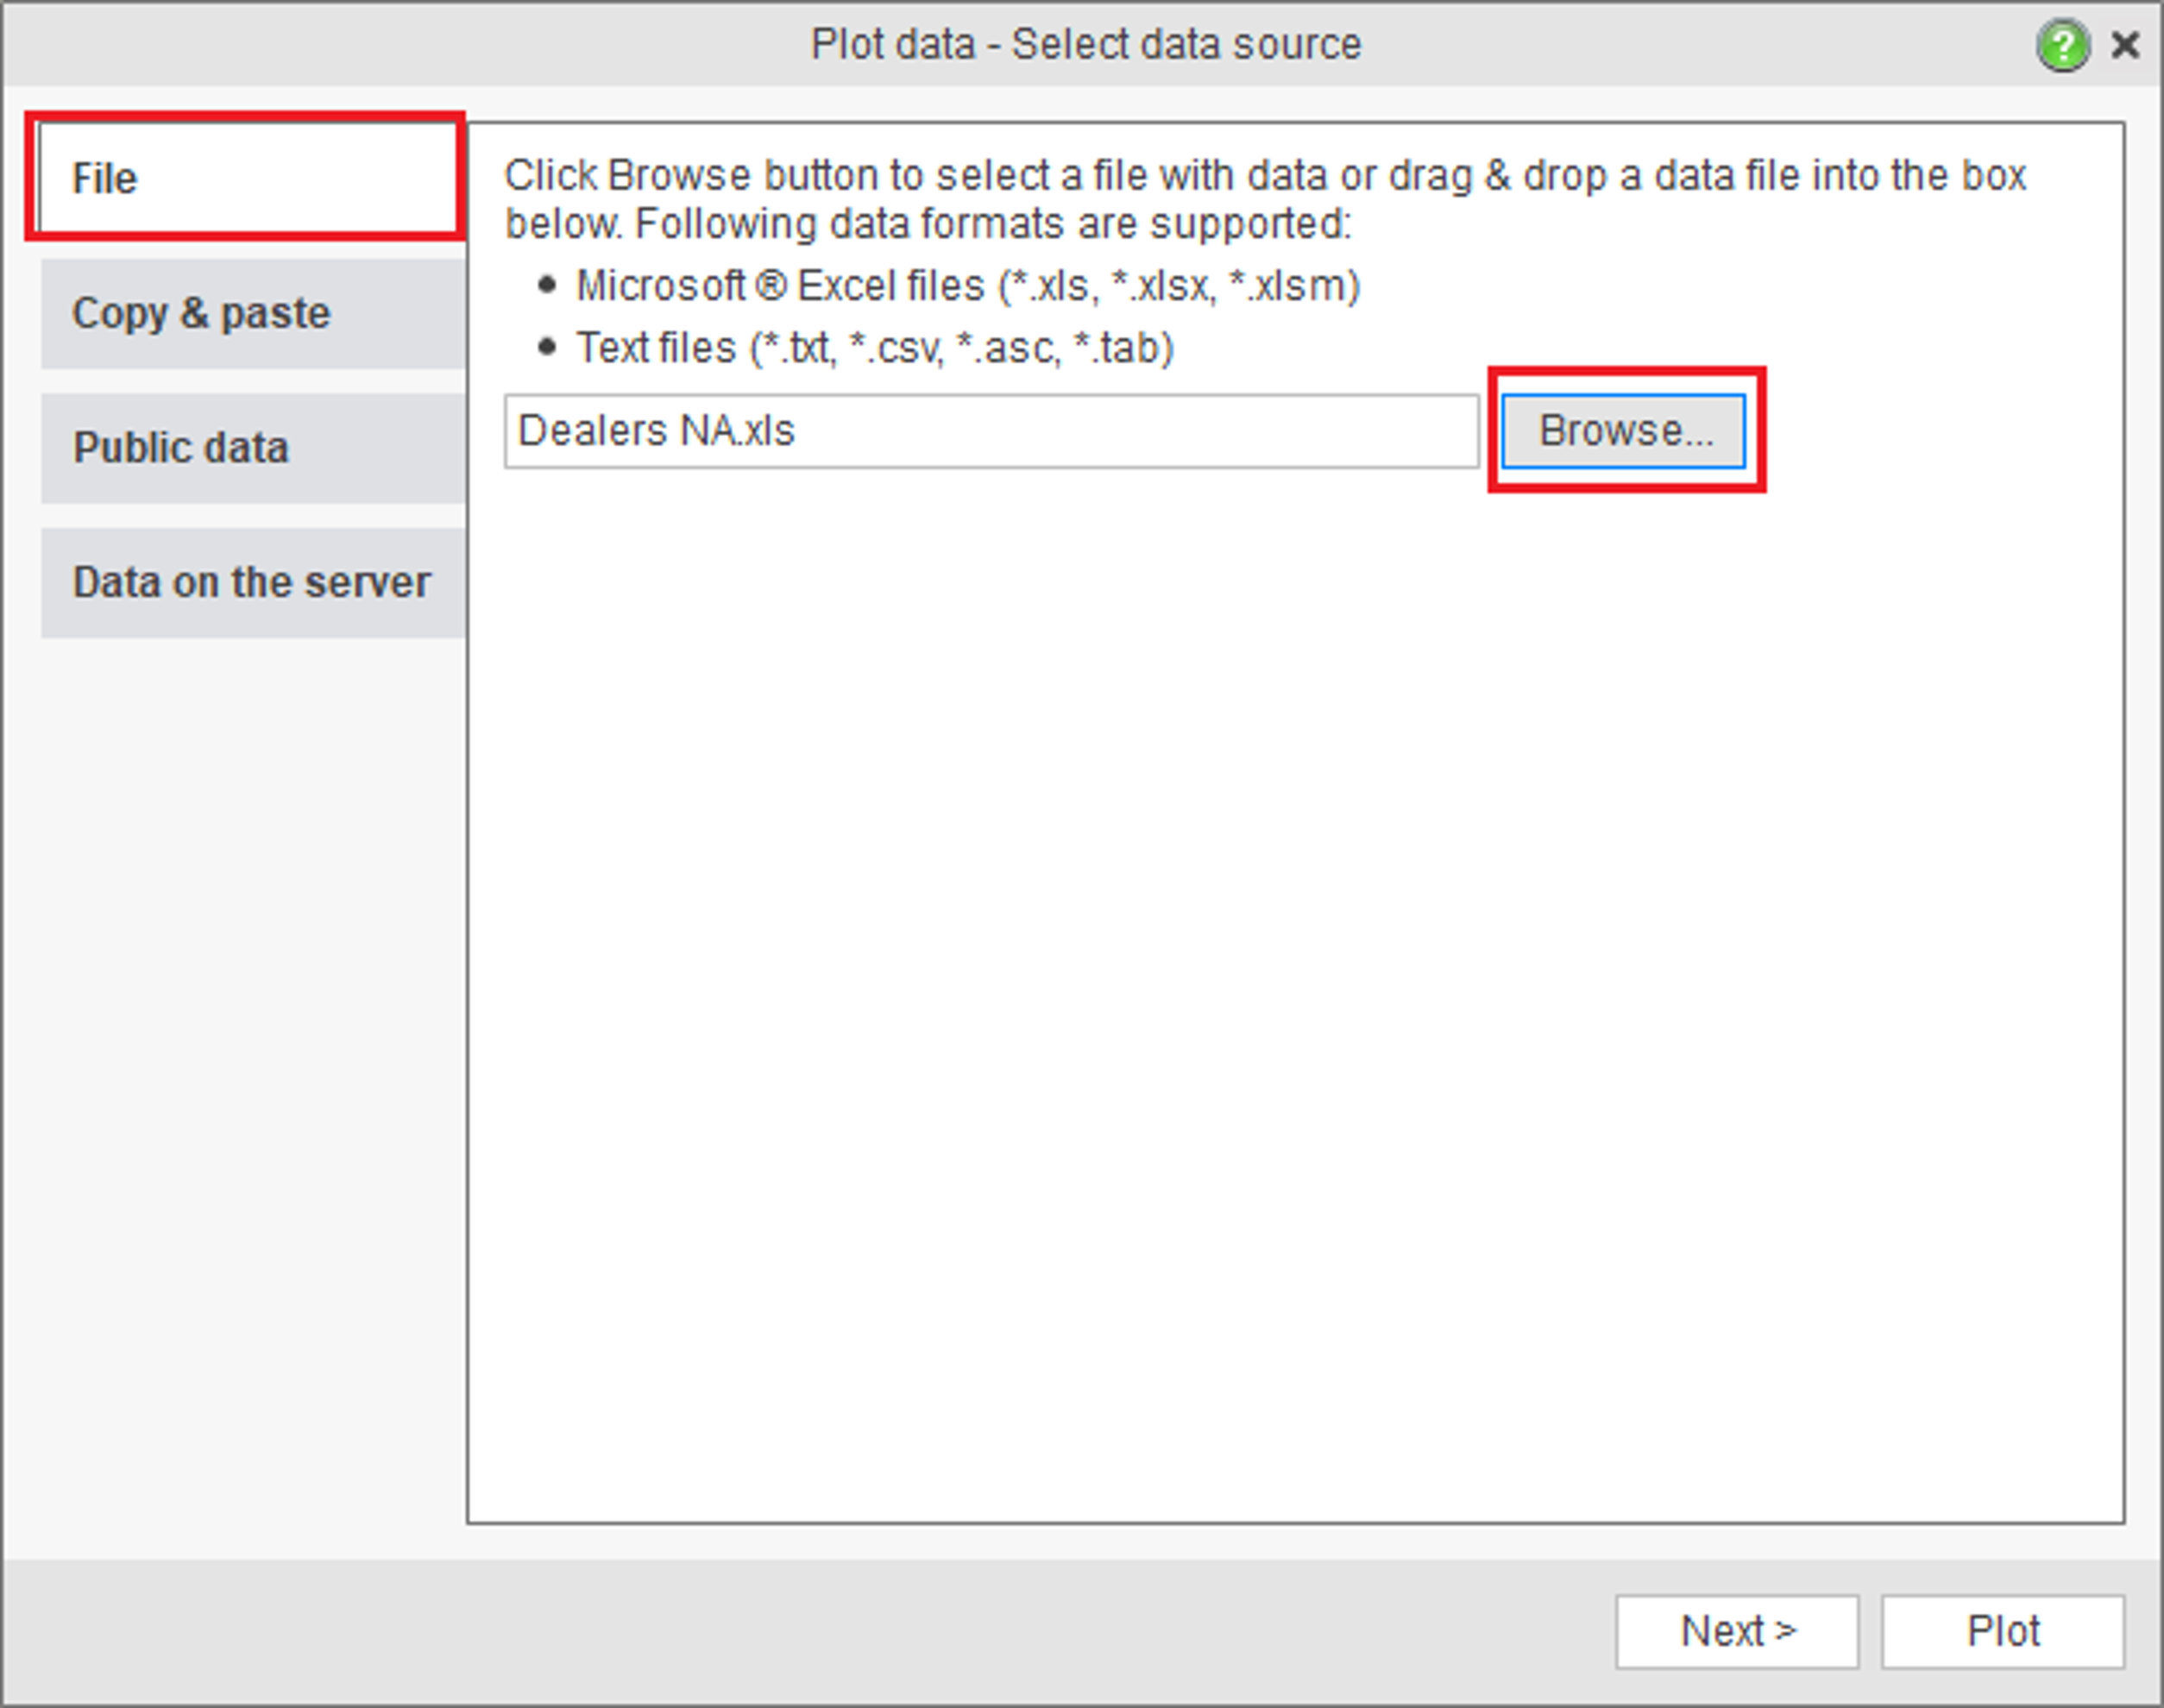
- The Plot data wizard will start. On the Select data source page choose the File tab and select an Excel file by clicking the Browse button.
After that you can simply press the Plot button and let MapBusinessOnline do all the work for you, asking a few questions only when necessary. But since we want to demonstrate the Plot data wizard in full, let’s take the longer route and click Next.
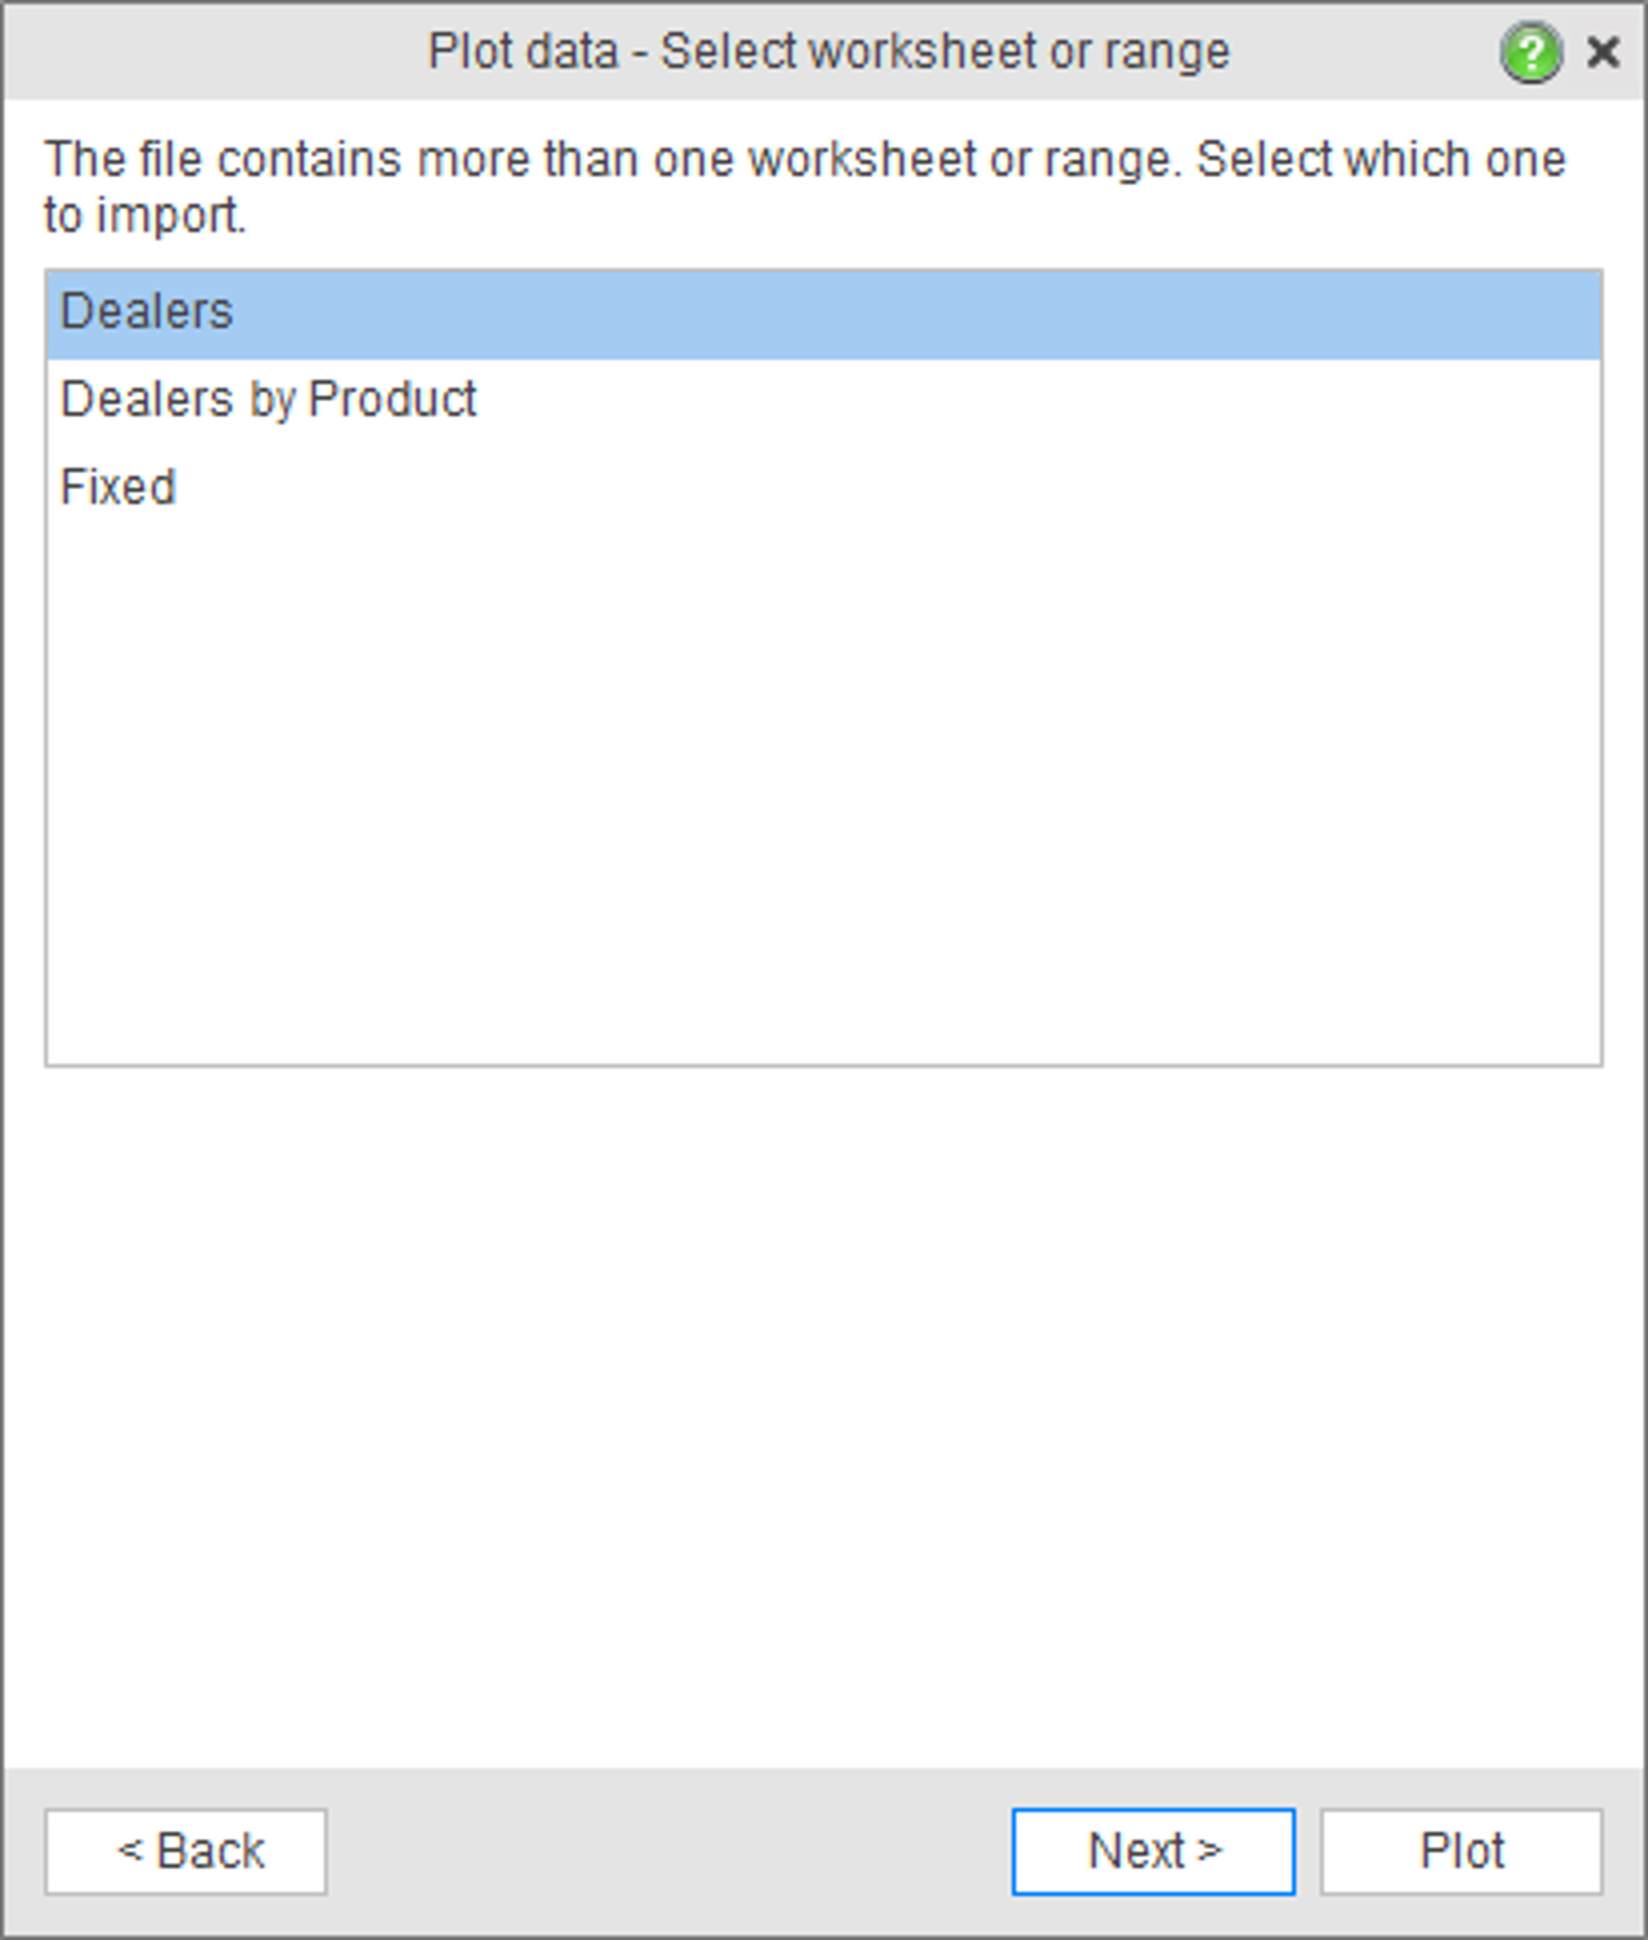
- If the file contains multiple worksheets or named ranges, choose the one to plot. Click Next.
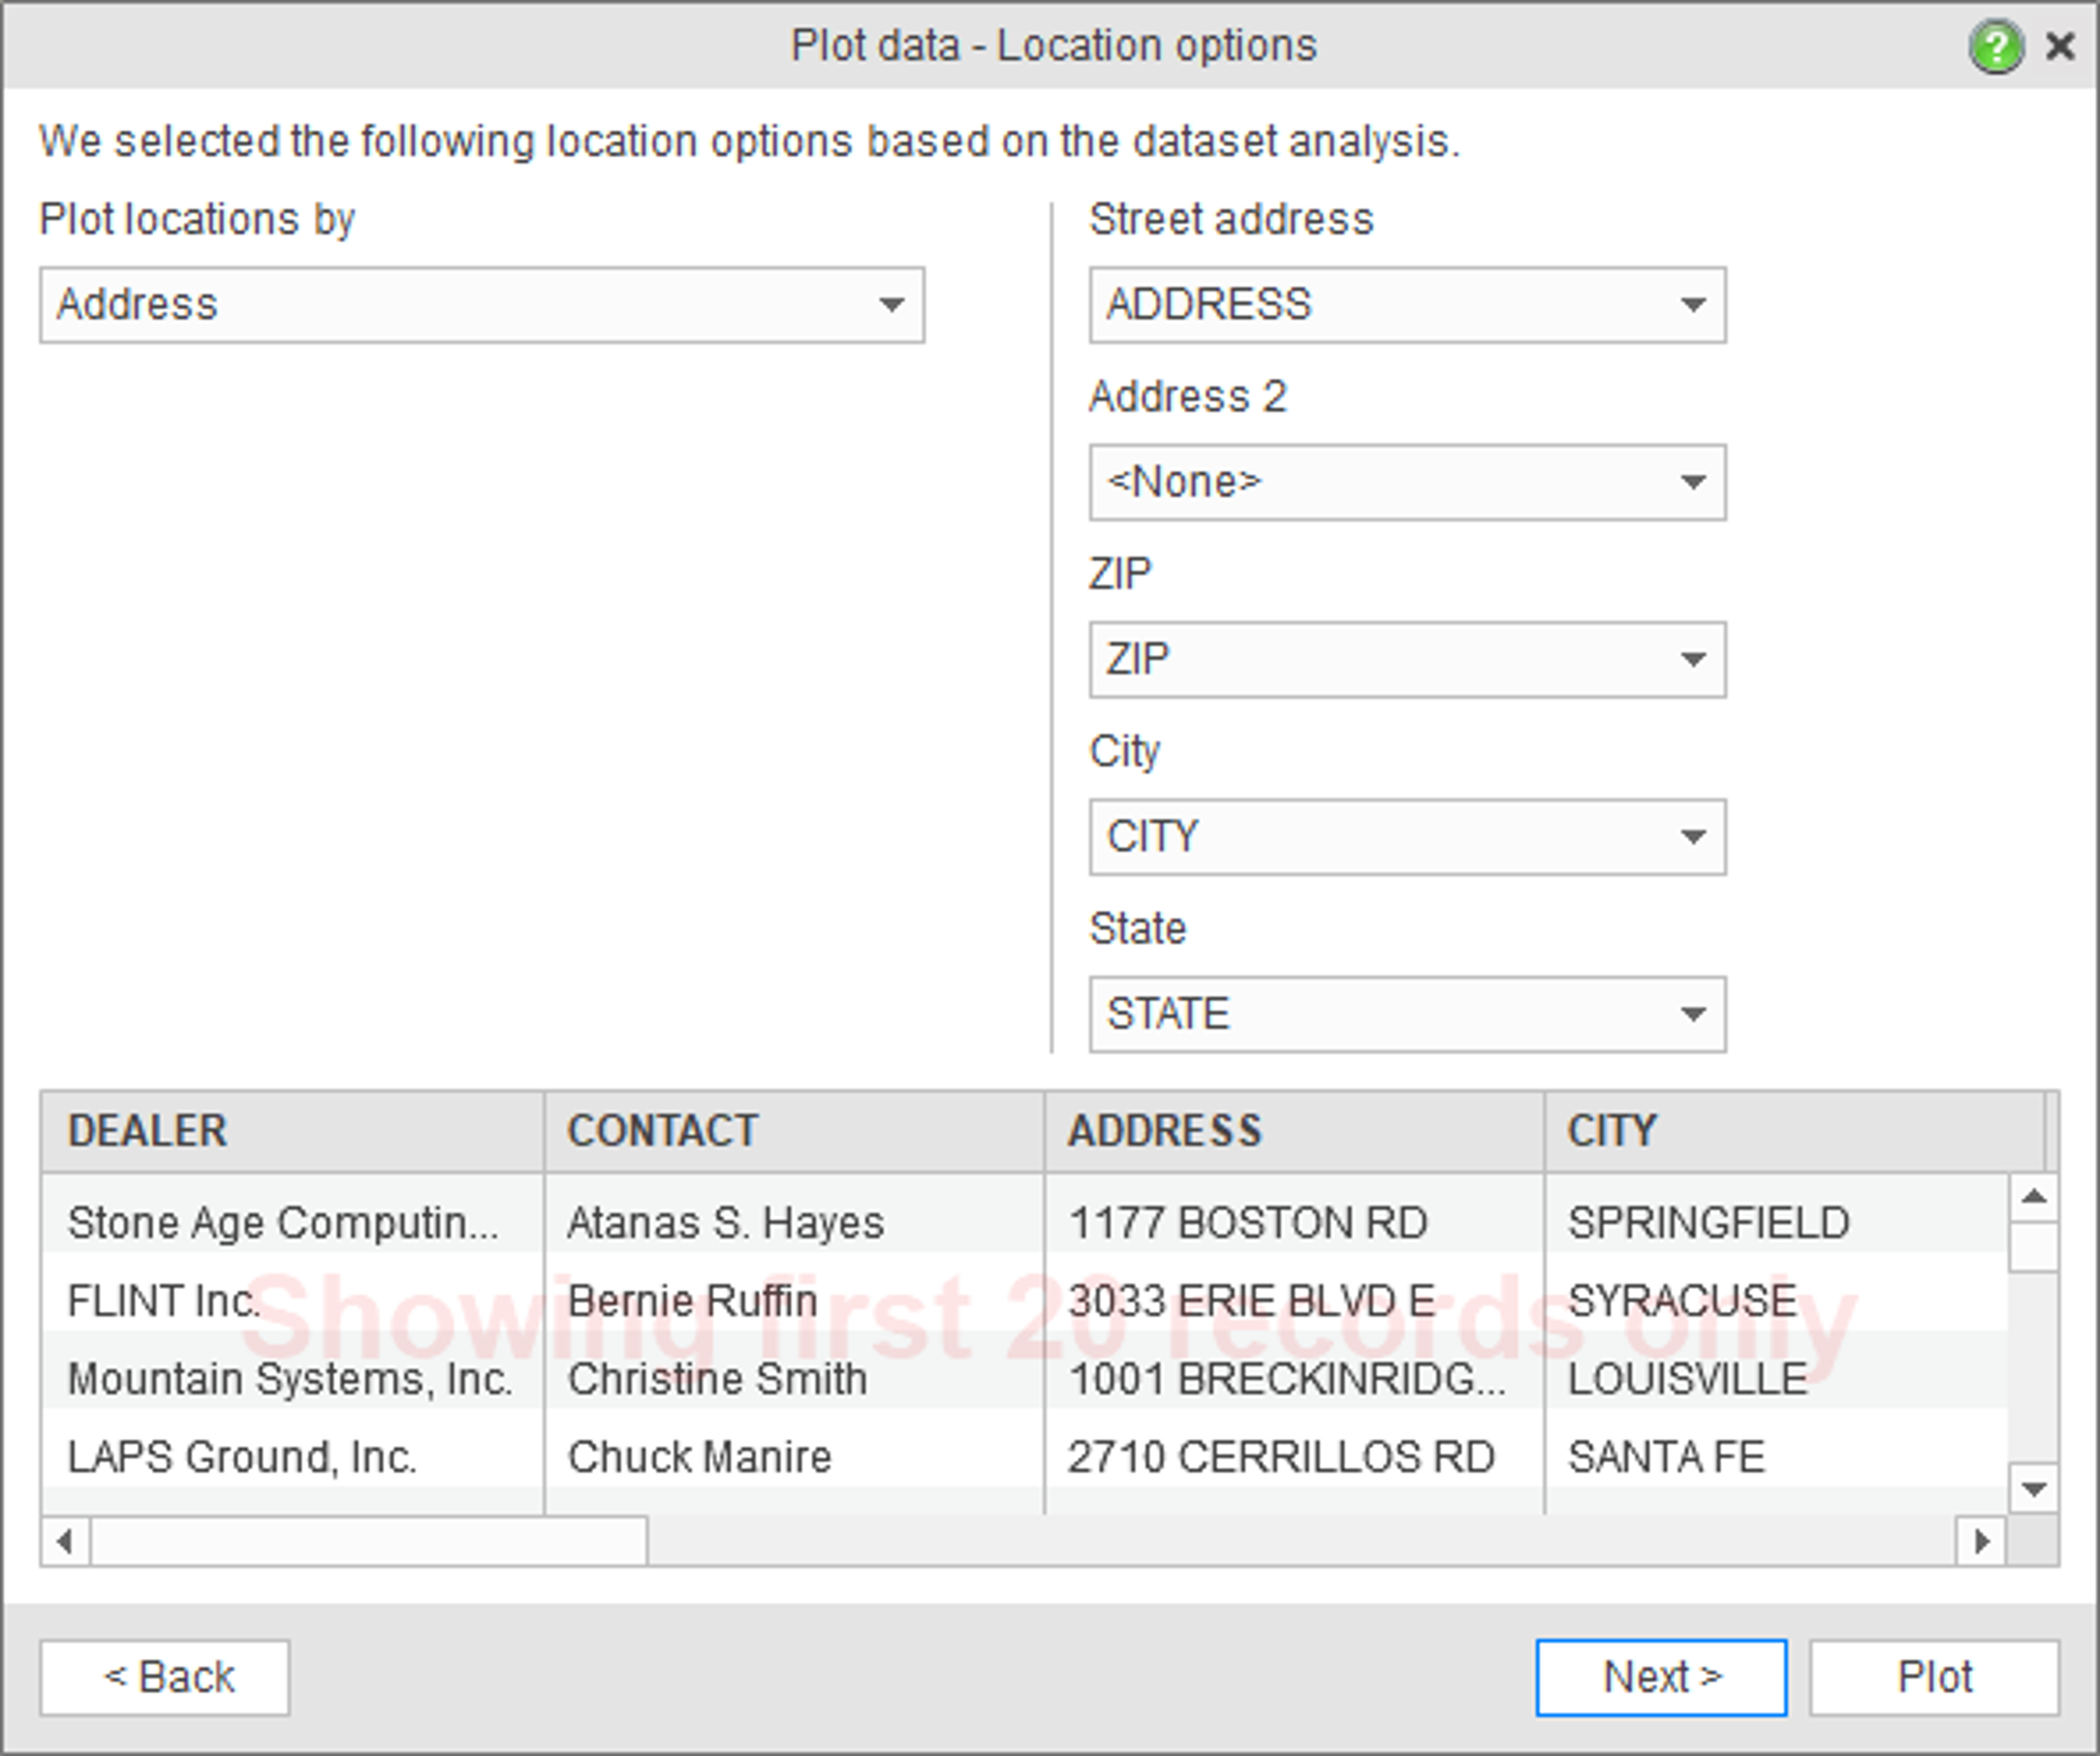
- The next page allows you to choose how to plot your data and what columns contain location information (address, city, state, ZIP code, etc.). MapBusinessOnline analyzes the data and makes the choices for you automatically. Just check that the automatic selection is correct.
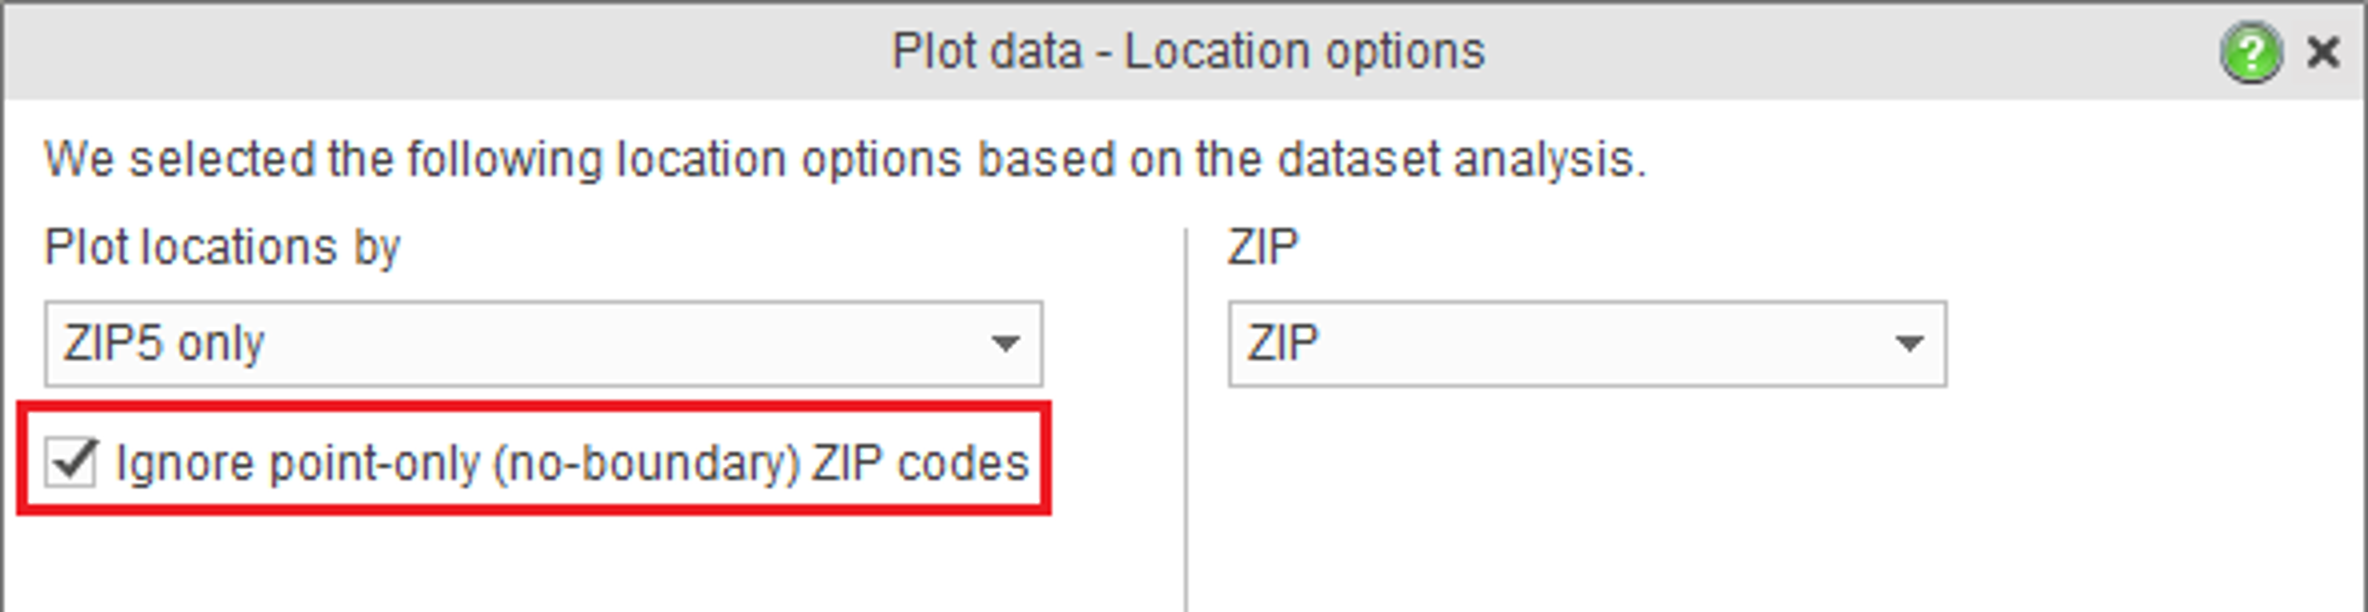
When plotting data by ZIP code you will have Ignore point-only (no-boundary) ZIP codes option. Use the option to plot demographic or territory data. The choice will instruct MapBusinessOnline to skip any ZIP code in your data that has no corresponding boundary (PO boxes, high-rises, etc.).
Click Next.
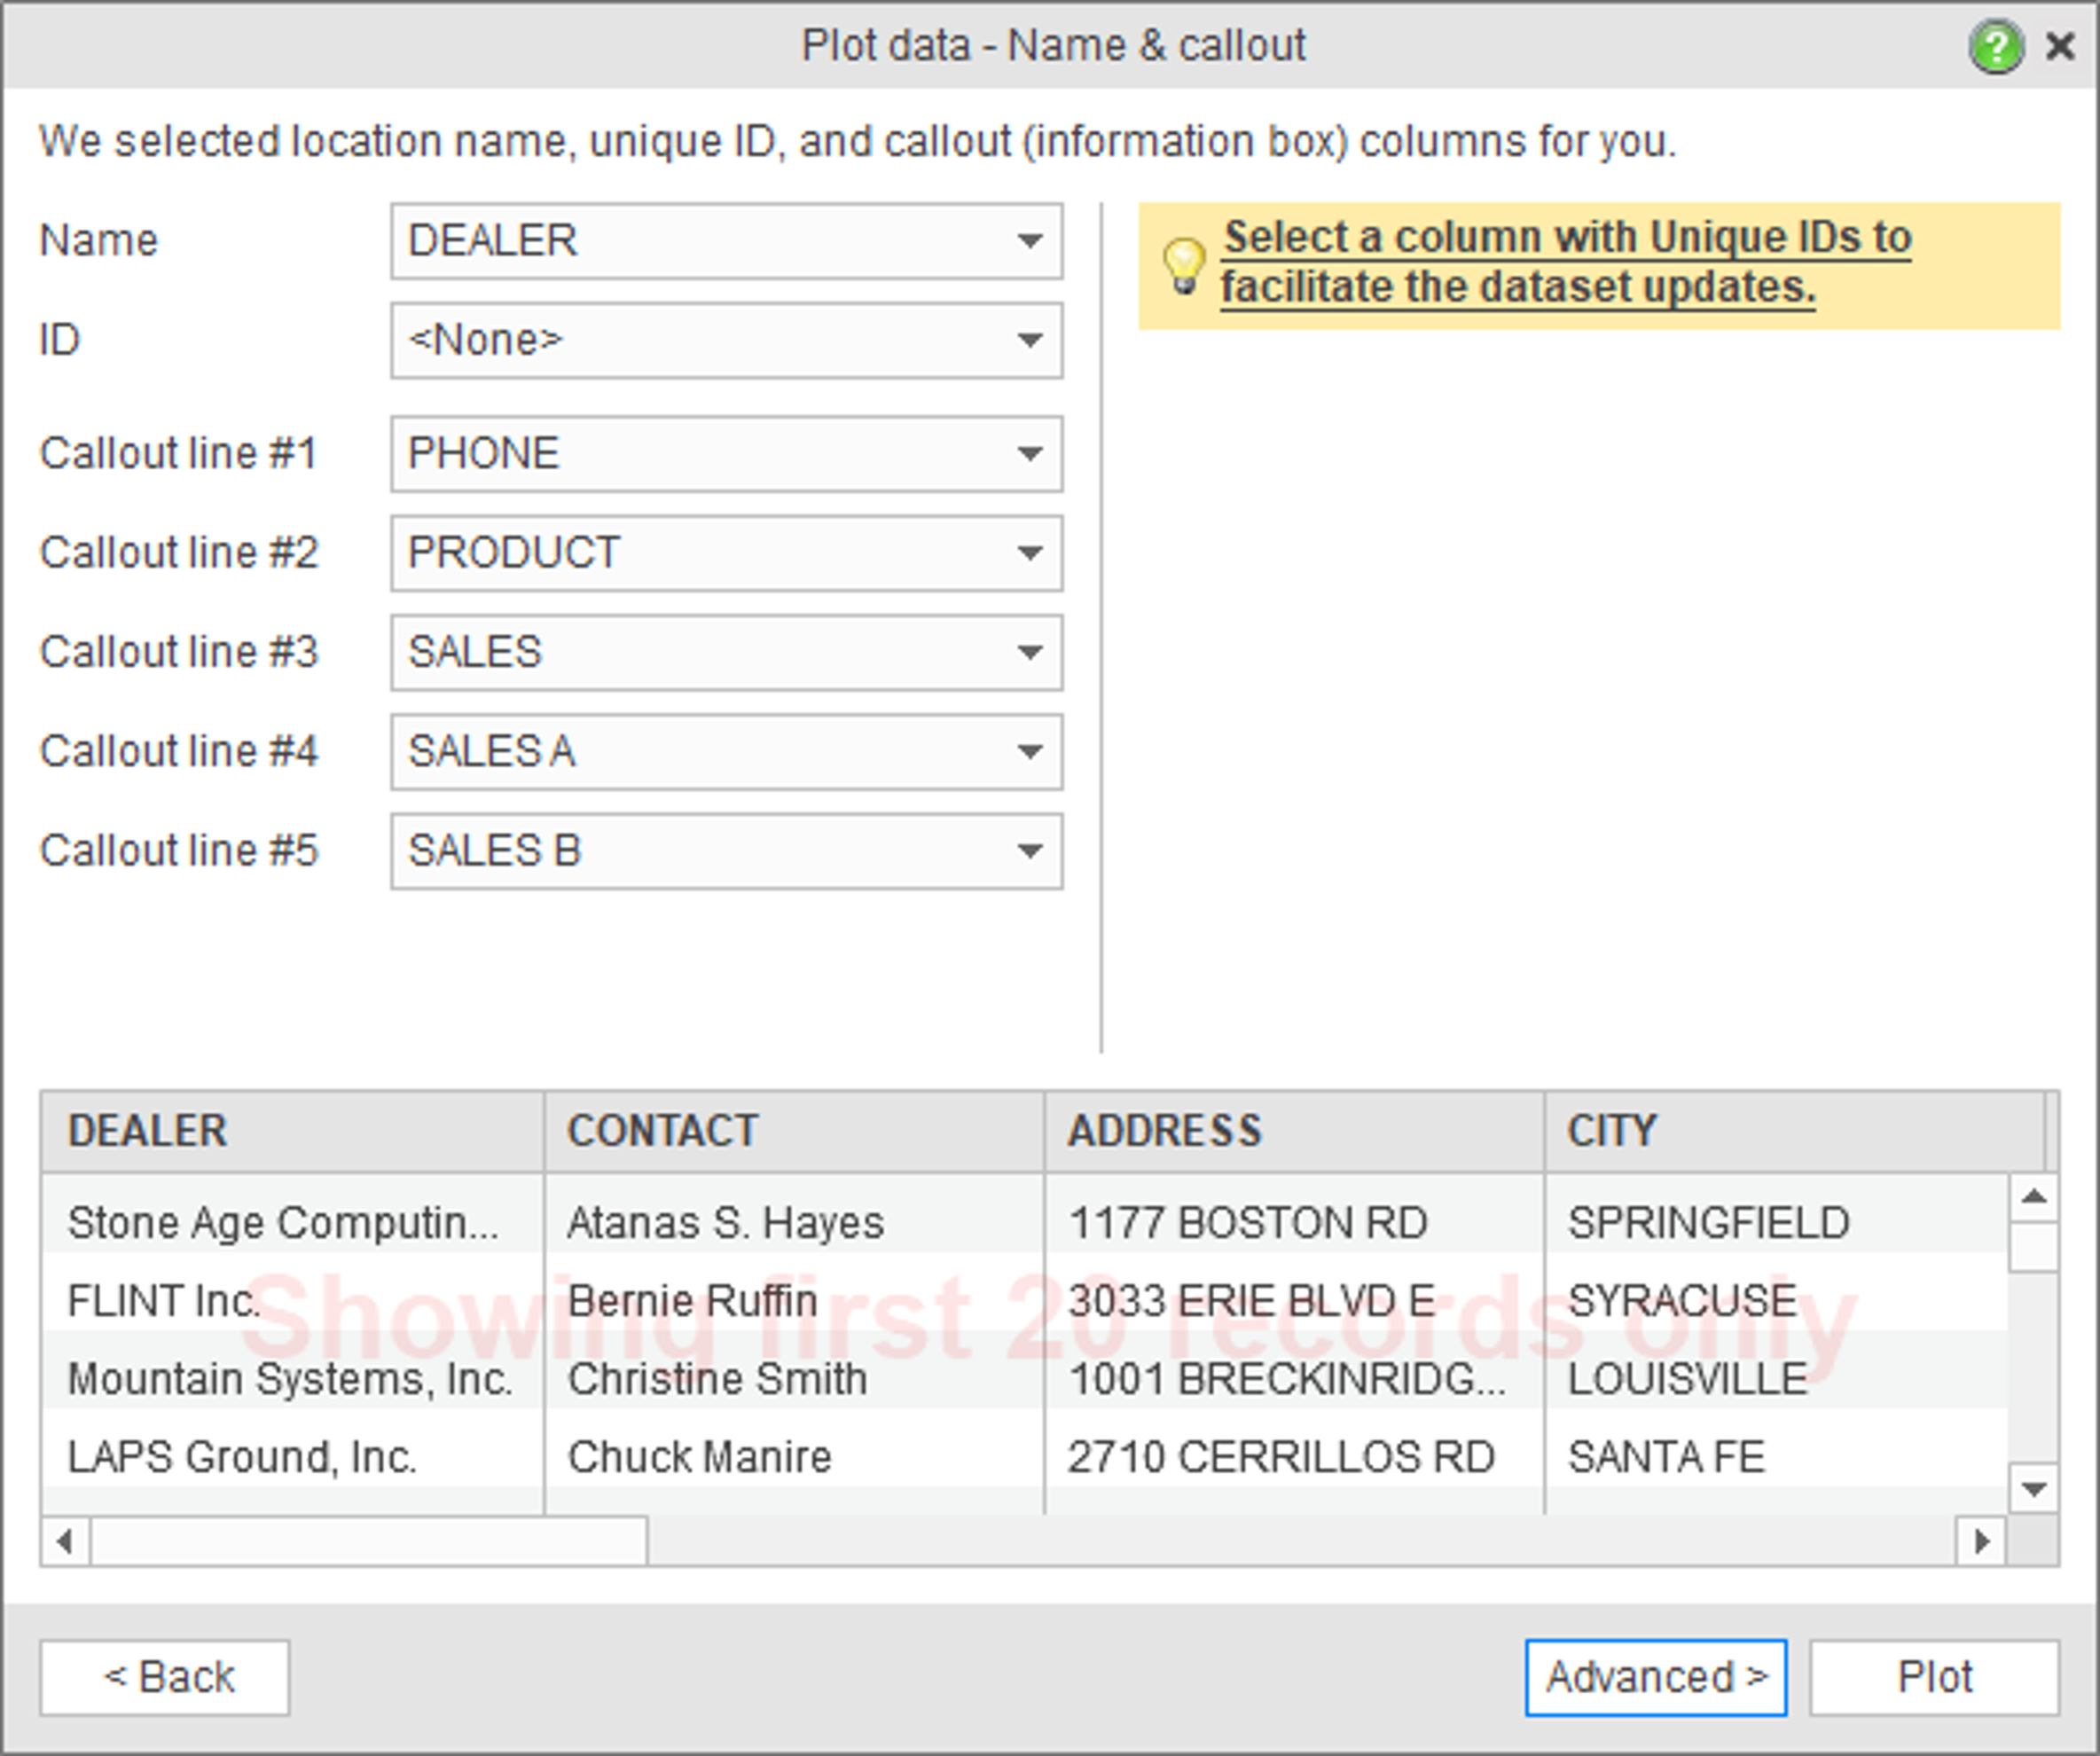
- On the following page provide more information about the data being plotted. Check that a correct column is selected as the name. The Name column will be used to label your data on the map. Choose an ID column if you plan to update the data from a file later.
Select other columns containing business information that you want to show inside map labels (aka callouts or information boxes). For example: phone number, sales volume, number of products, product names, number of employees, territory, etc.
You can click the Plot button now, but let’s instead use the Advanced option to demonstrate more choices available.
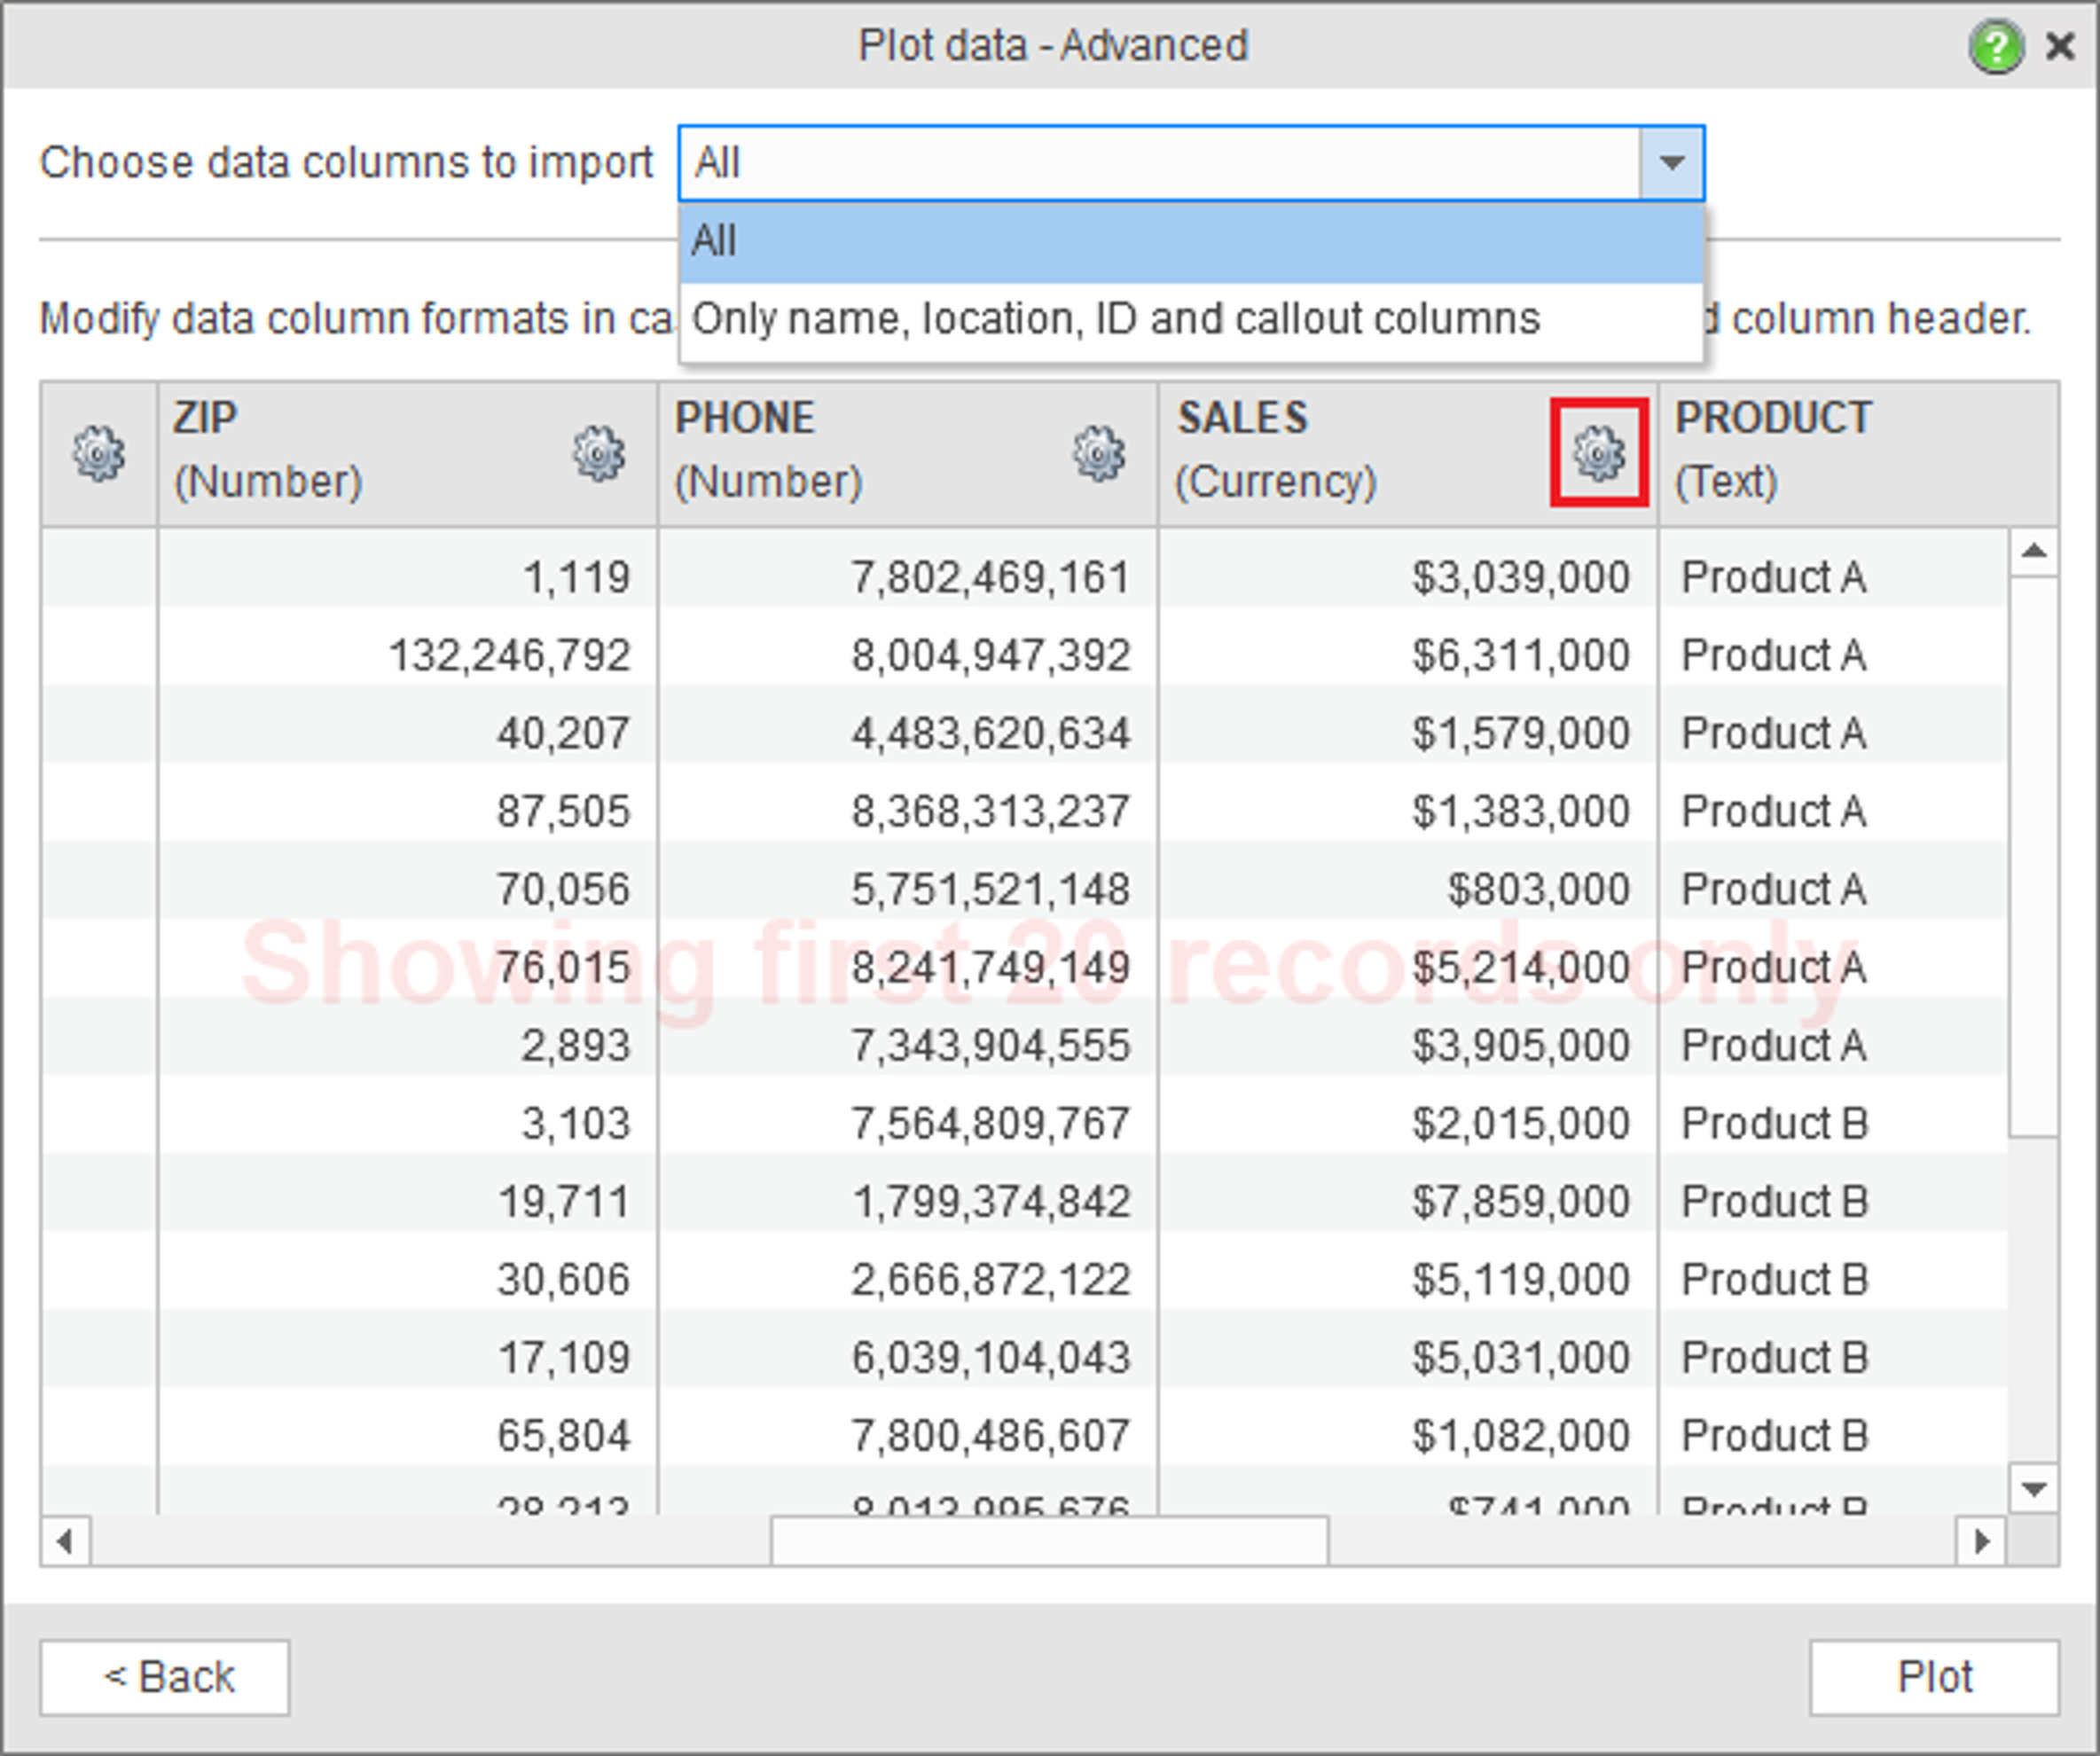
- On the Advanced page you can instruct the app to import just the columns selected as name, location, ID, and callouts. This way you control what data will be copied to the MapBusinessOnline cloud. In addition to that you can override a column name or format detected by the app. For example, you can tell the app that a column contains numbers rather than text values. That is useful when the spreadsheet is not formatted correctly affecting automatic detection. To change a name or format just move the mouse pointer over a column header in the data sample and click the Gear button that appears.
Click Plot.
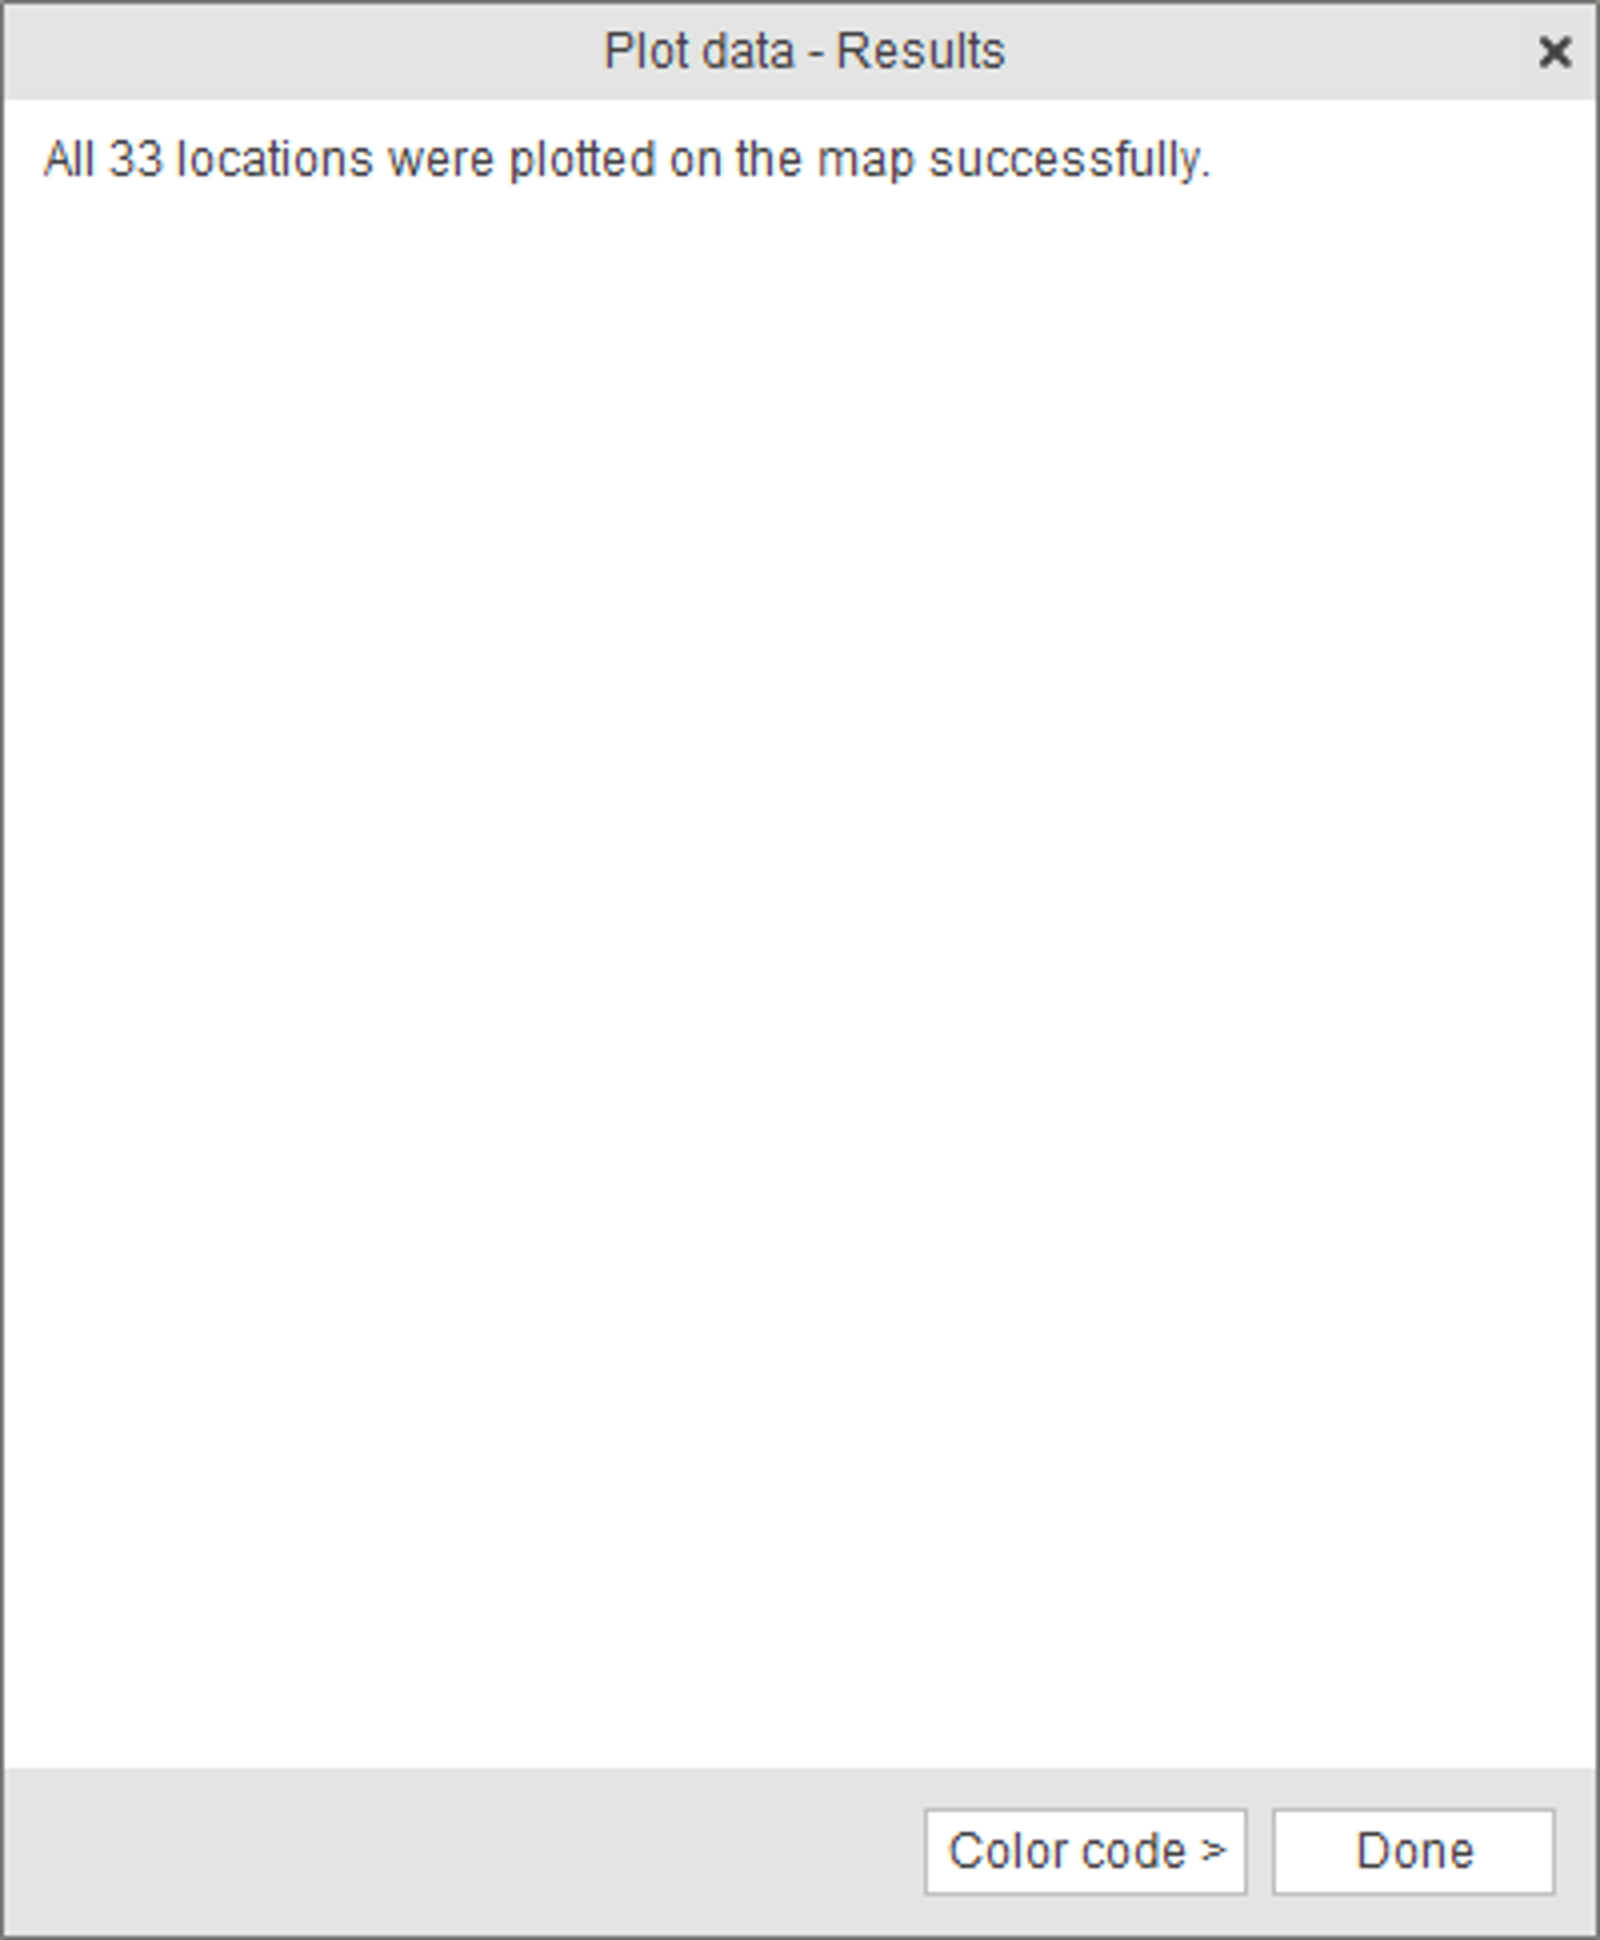
- Data plotting may take a few seconds or minutes depending on the data volume. Click Done to see the data on the map.
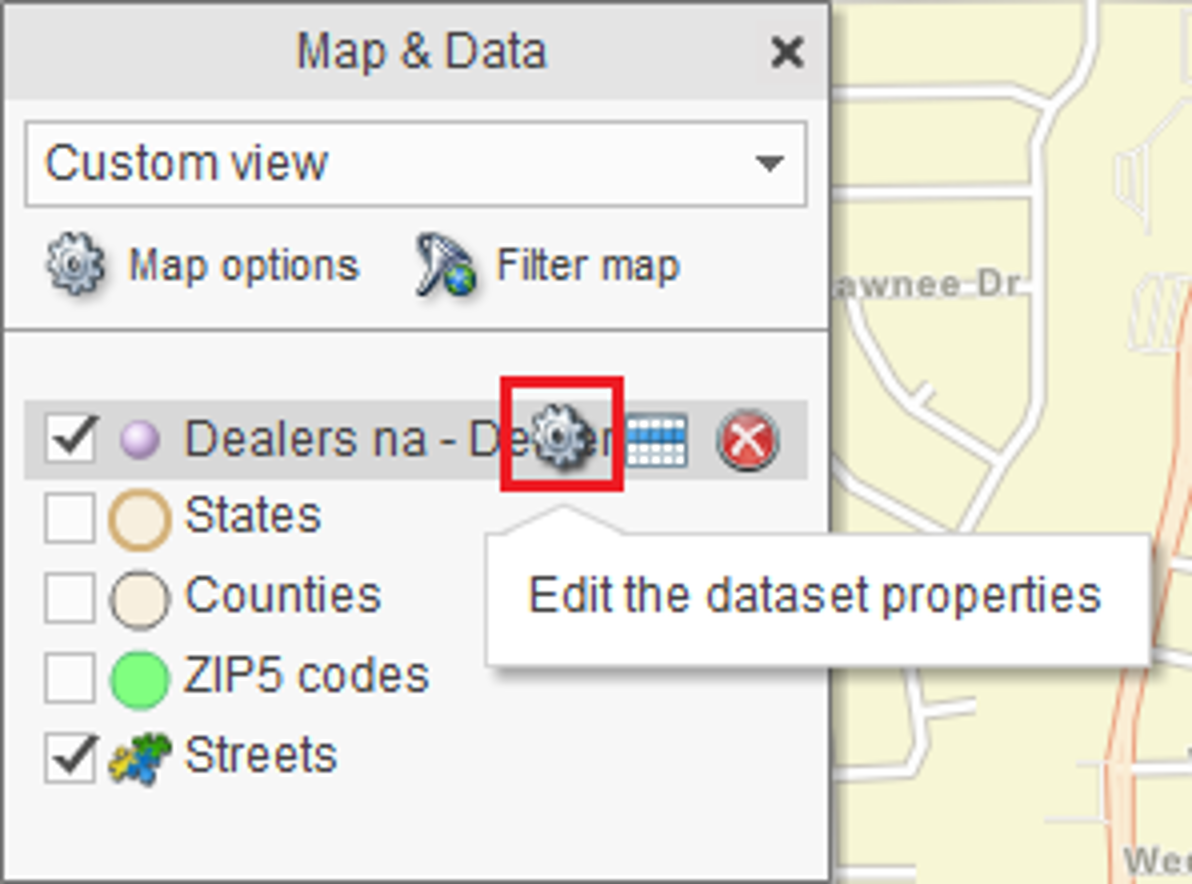
- After plotting the data, you may want to change dataset properties such as dataset name or symbol. You can access the dataset properties from Map & Data window. To show Map & Data window, if it is not already visible, just click the arrow button centered on the left side of the app.
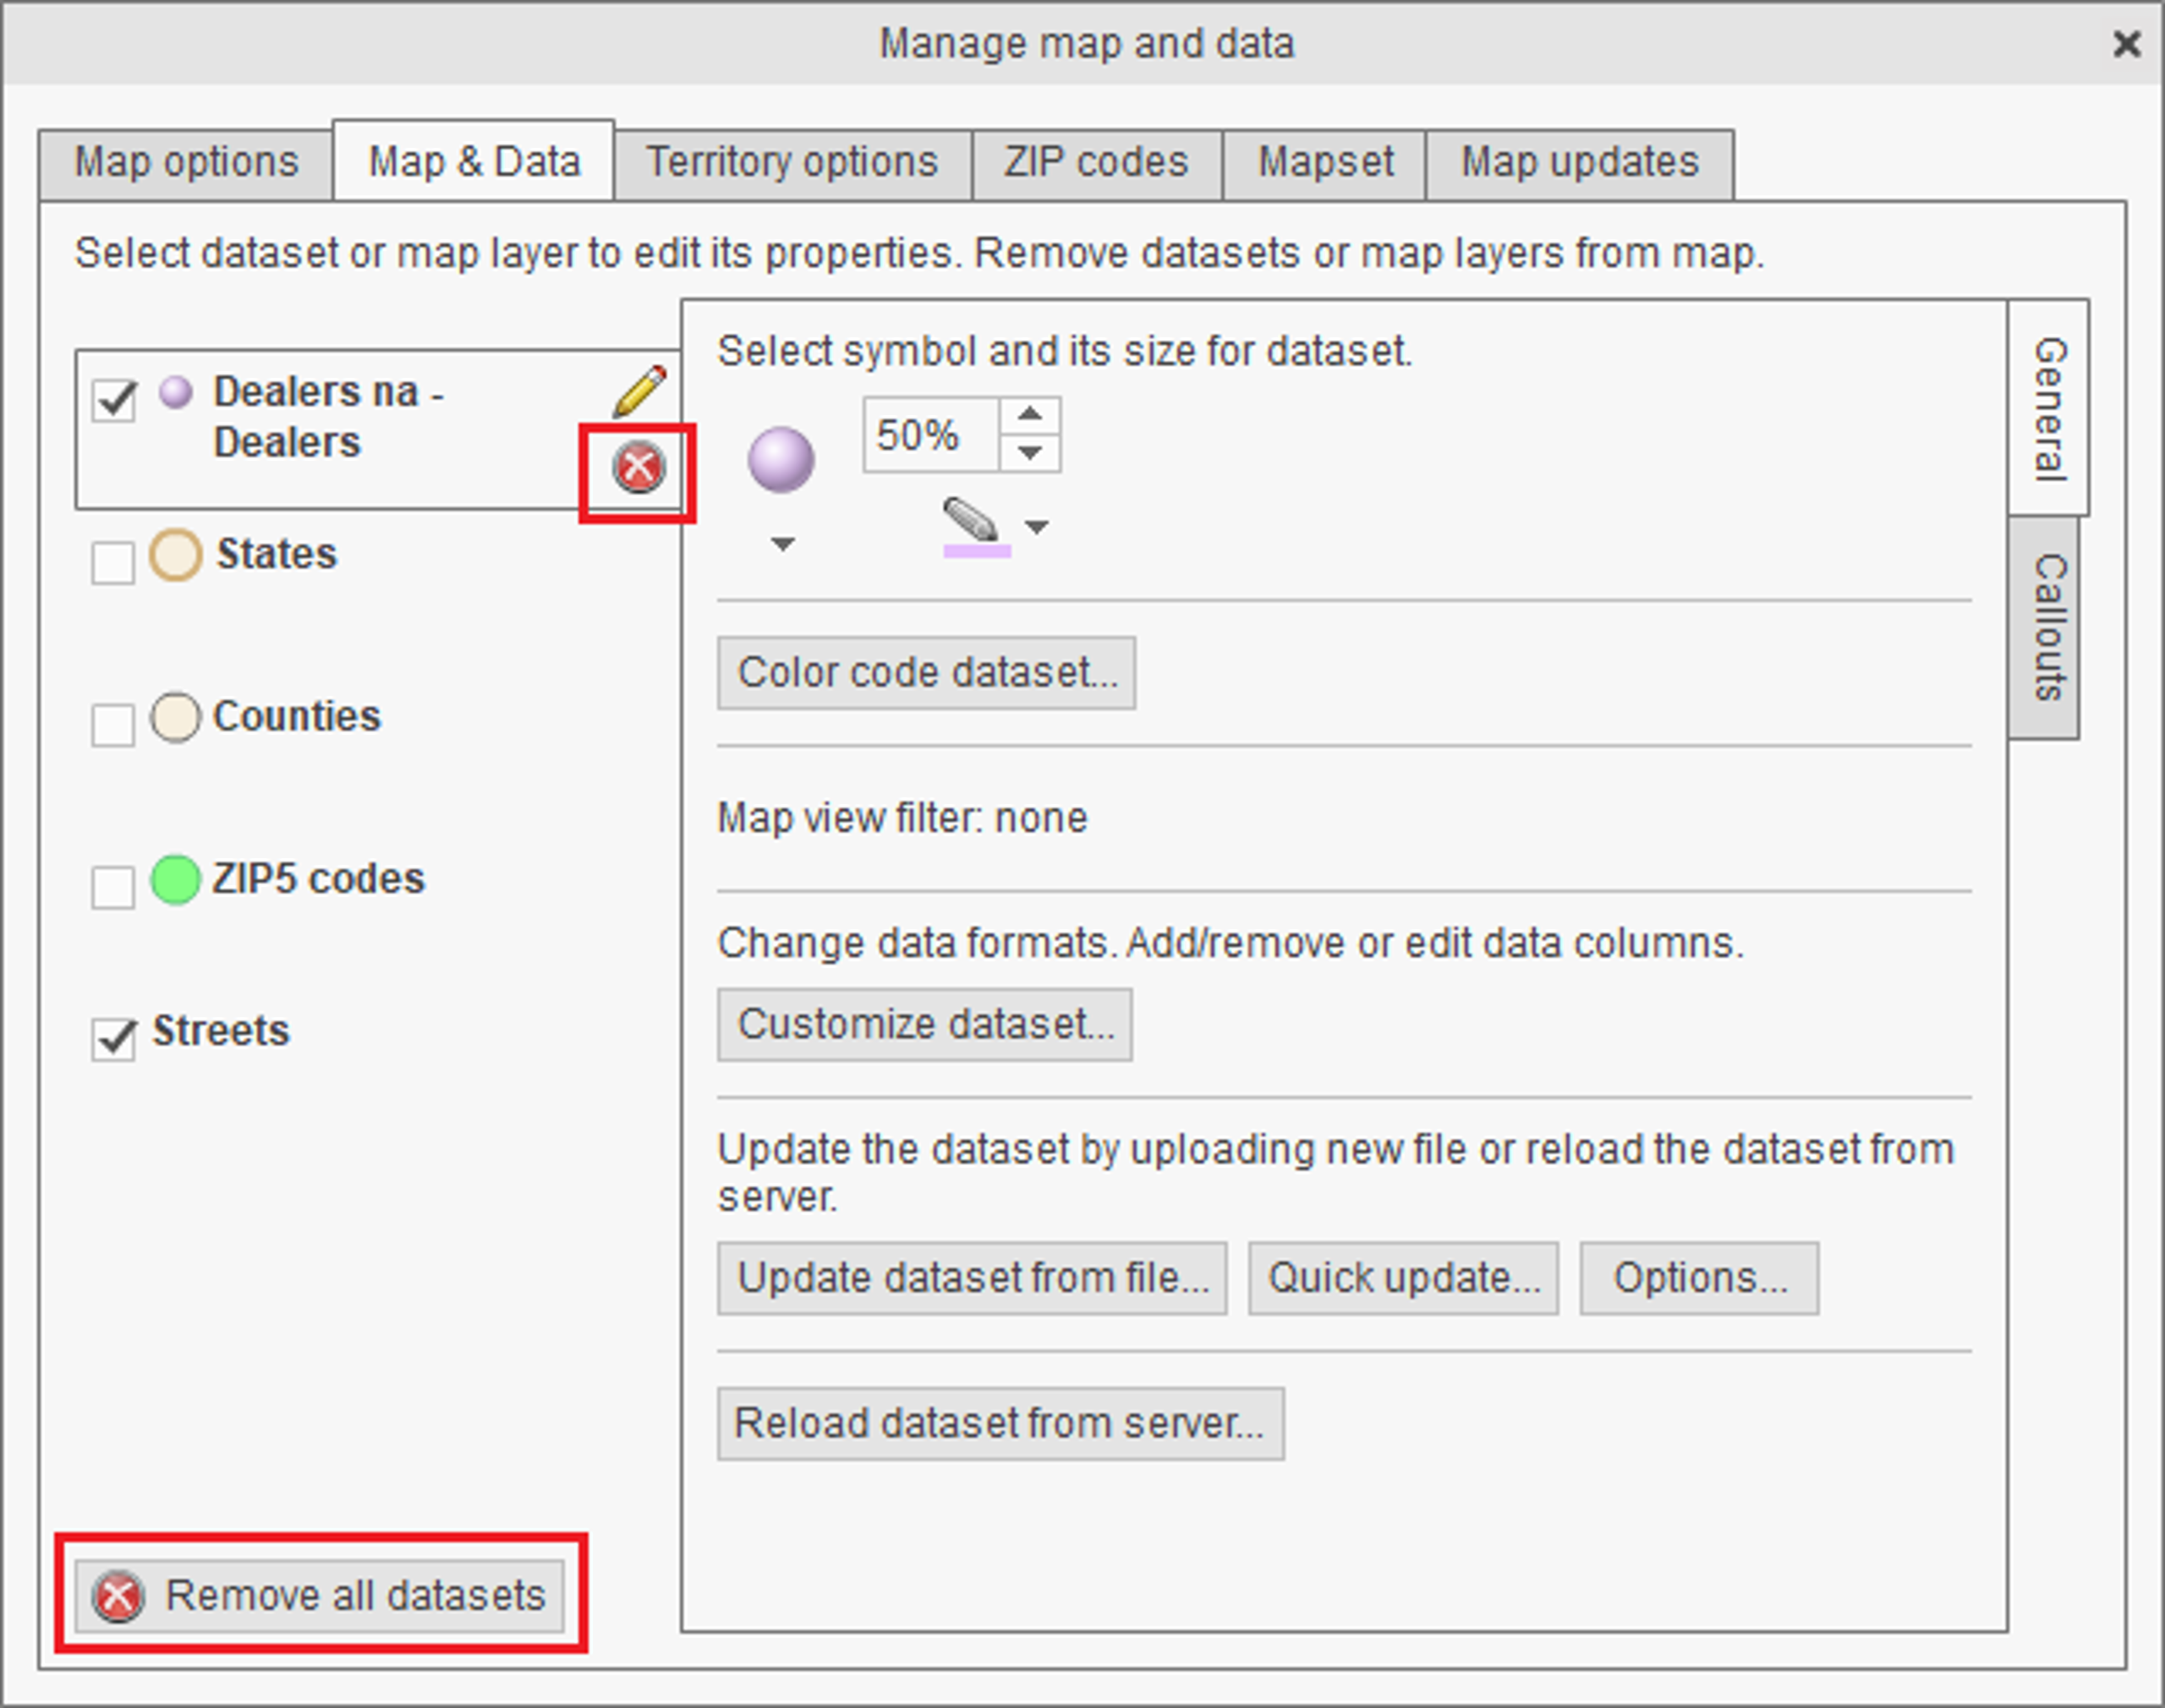
- Move the mouse pointer over a dataset name in Map & Data window and click the Gear button to open Manage map and data dialog.
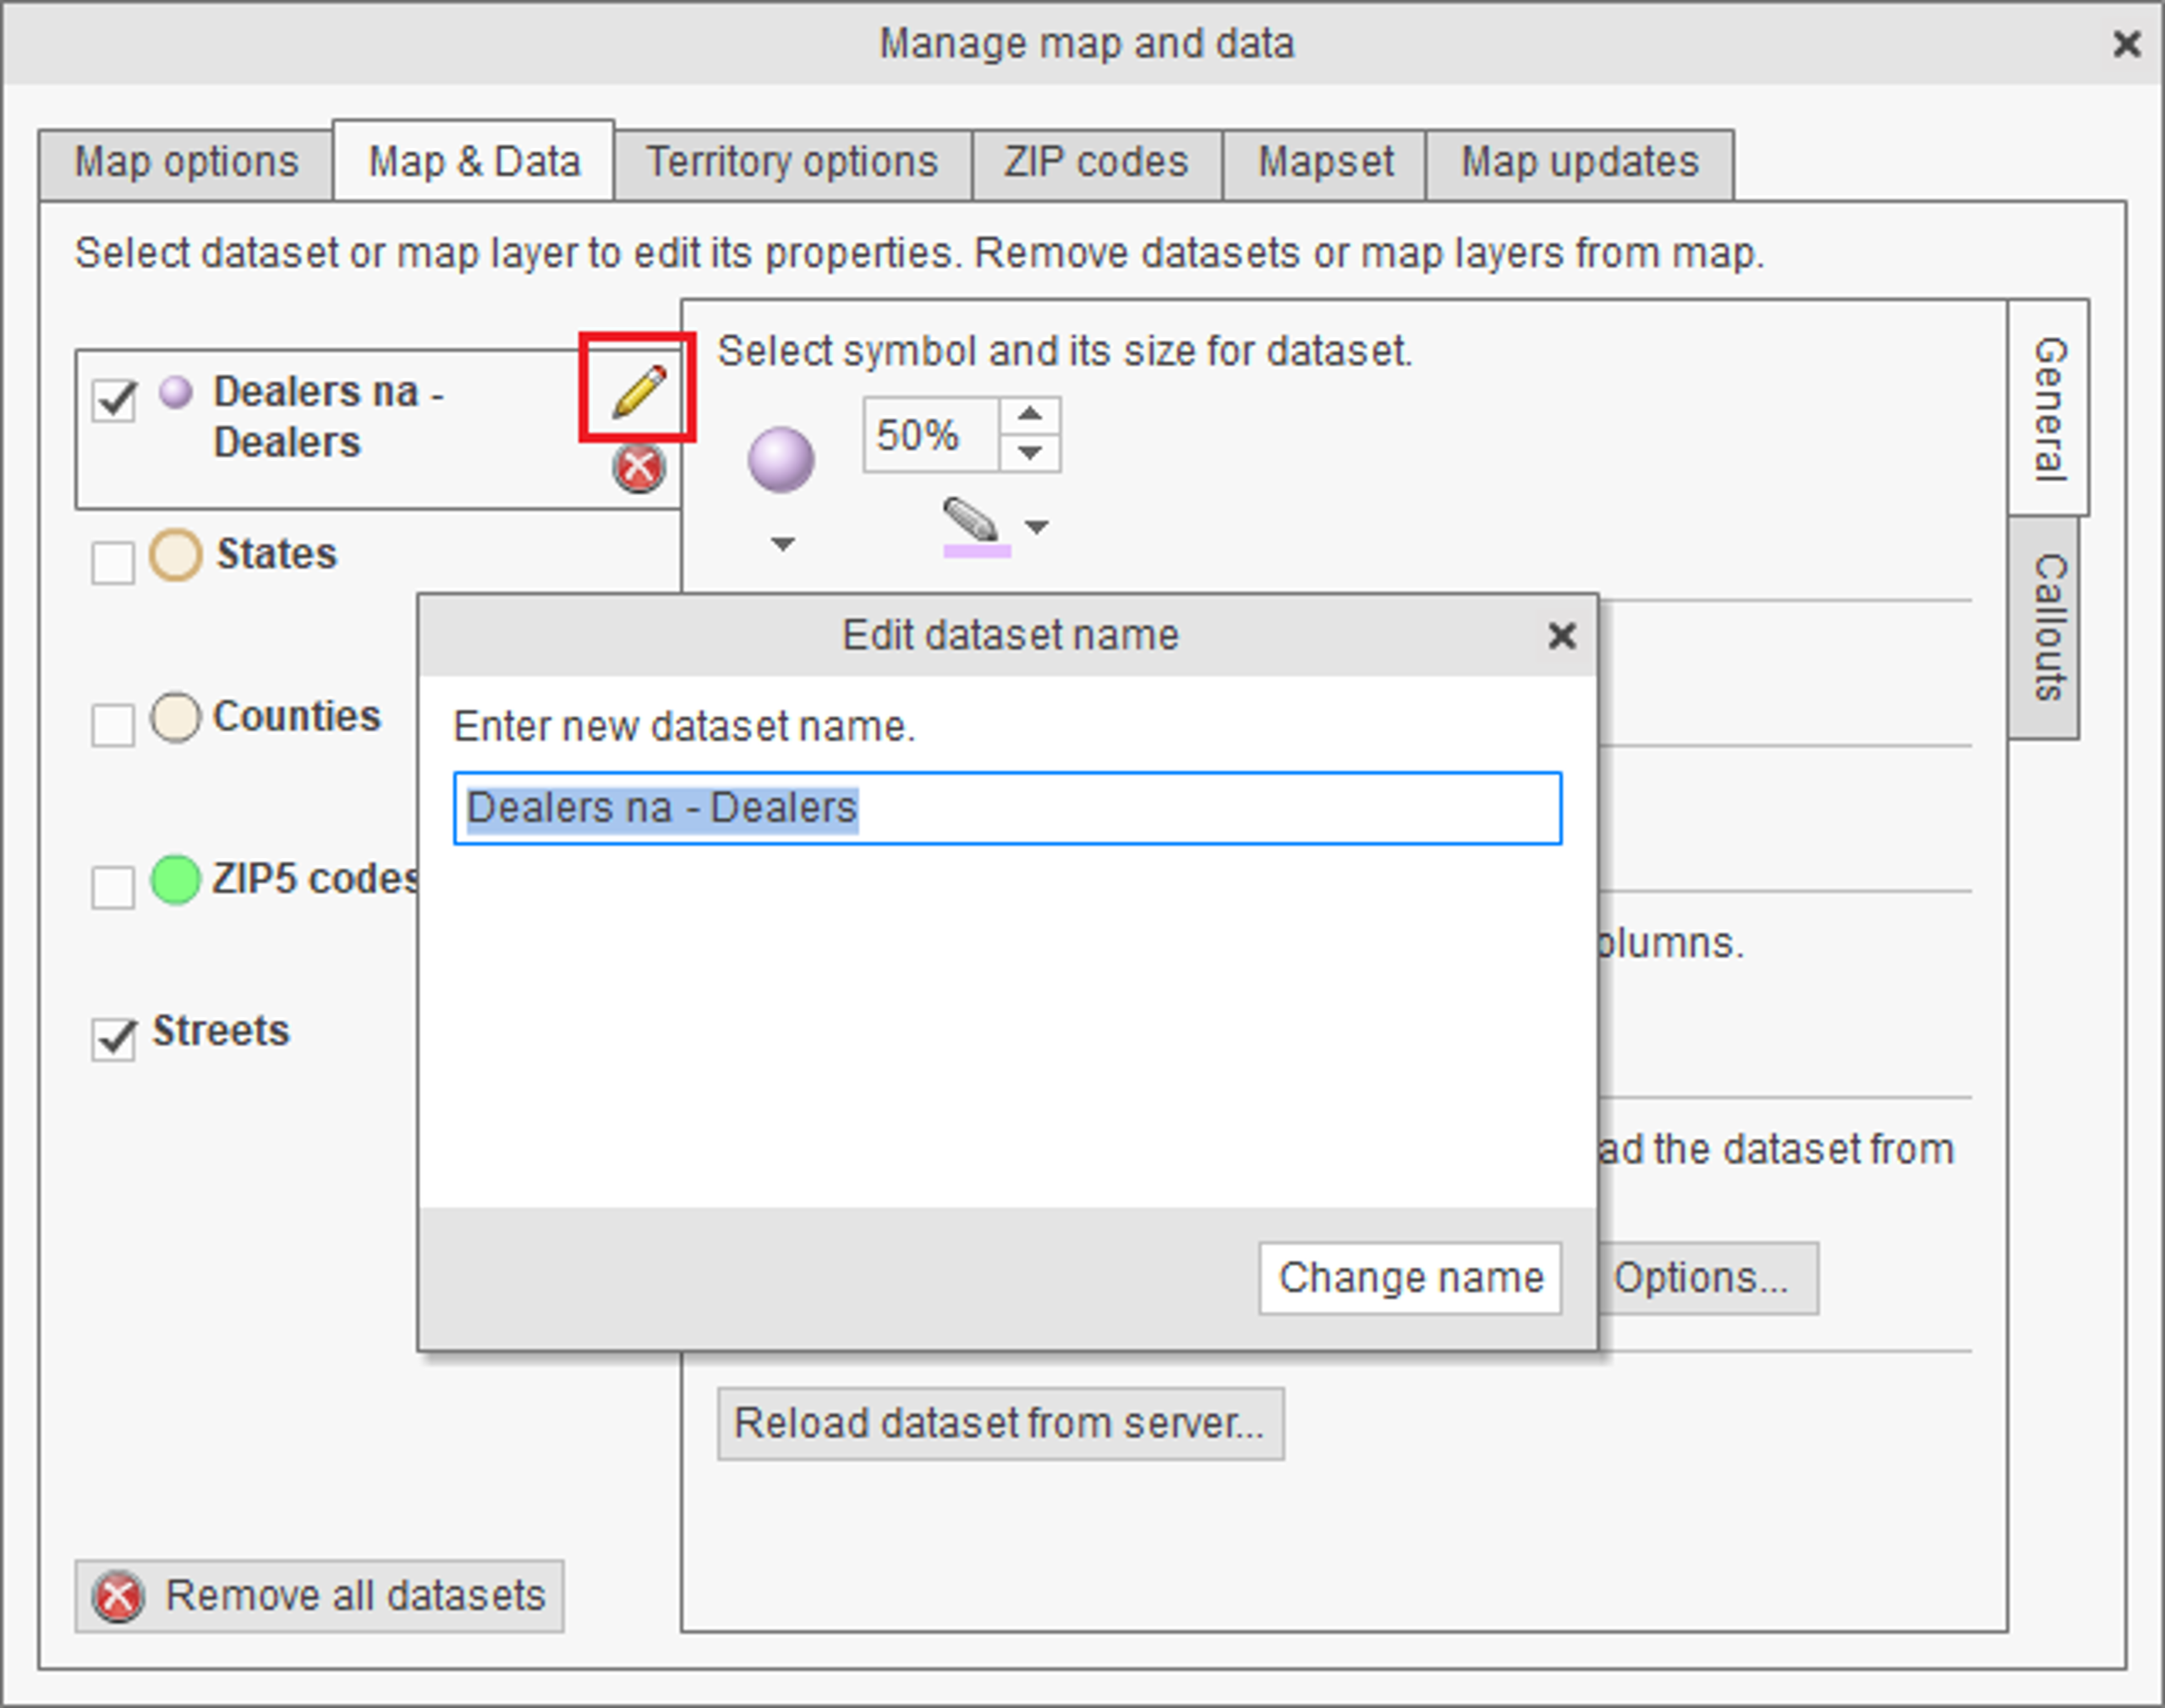
- Once inside the Manage map and data dialog click the Pencil button for the dataset selected. Enter a new dataset name and click the Change name button to apply the change.
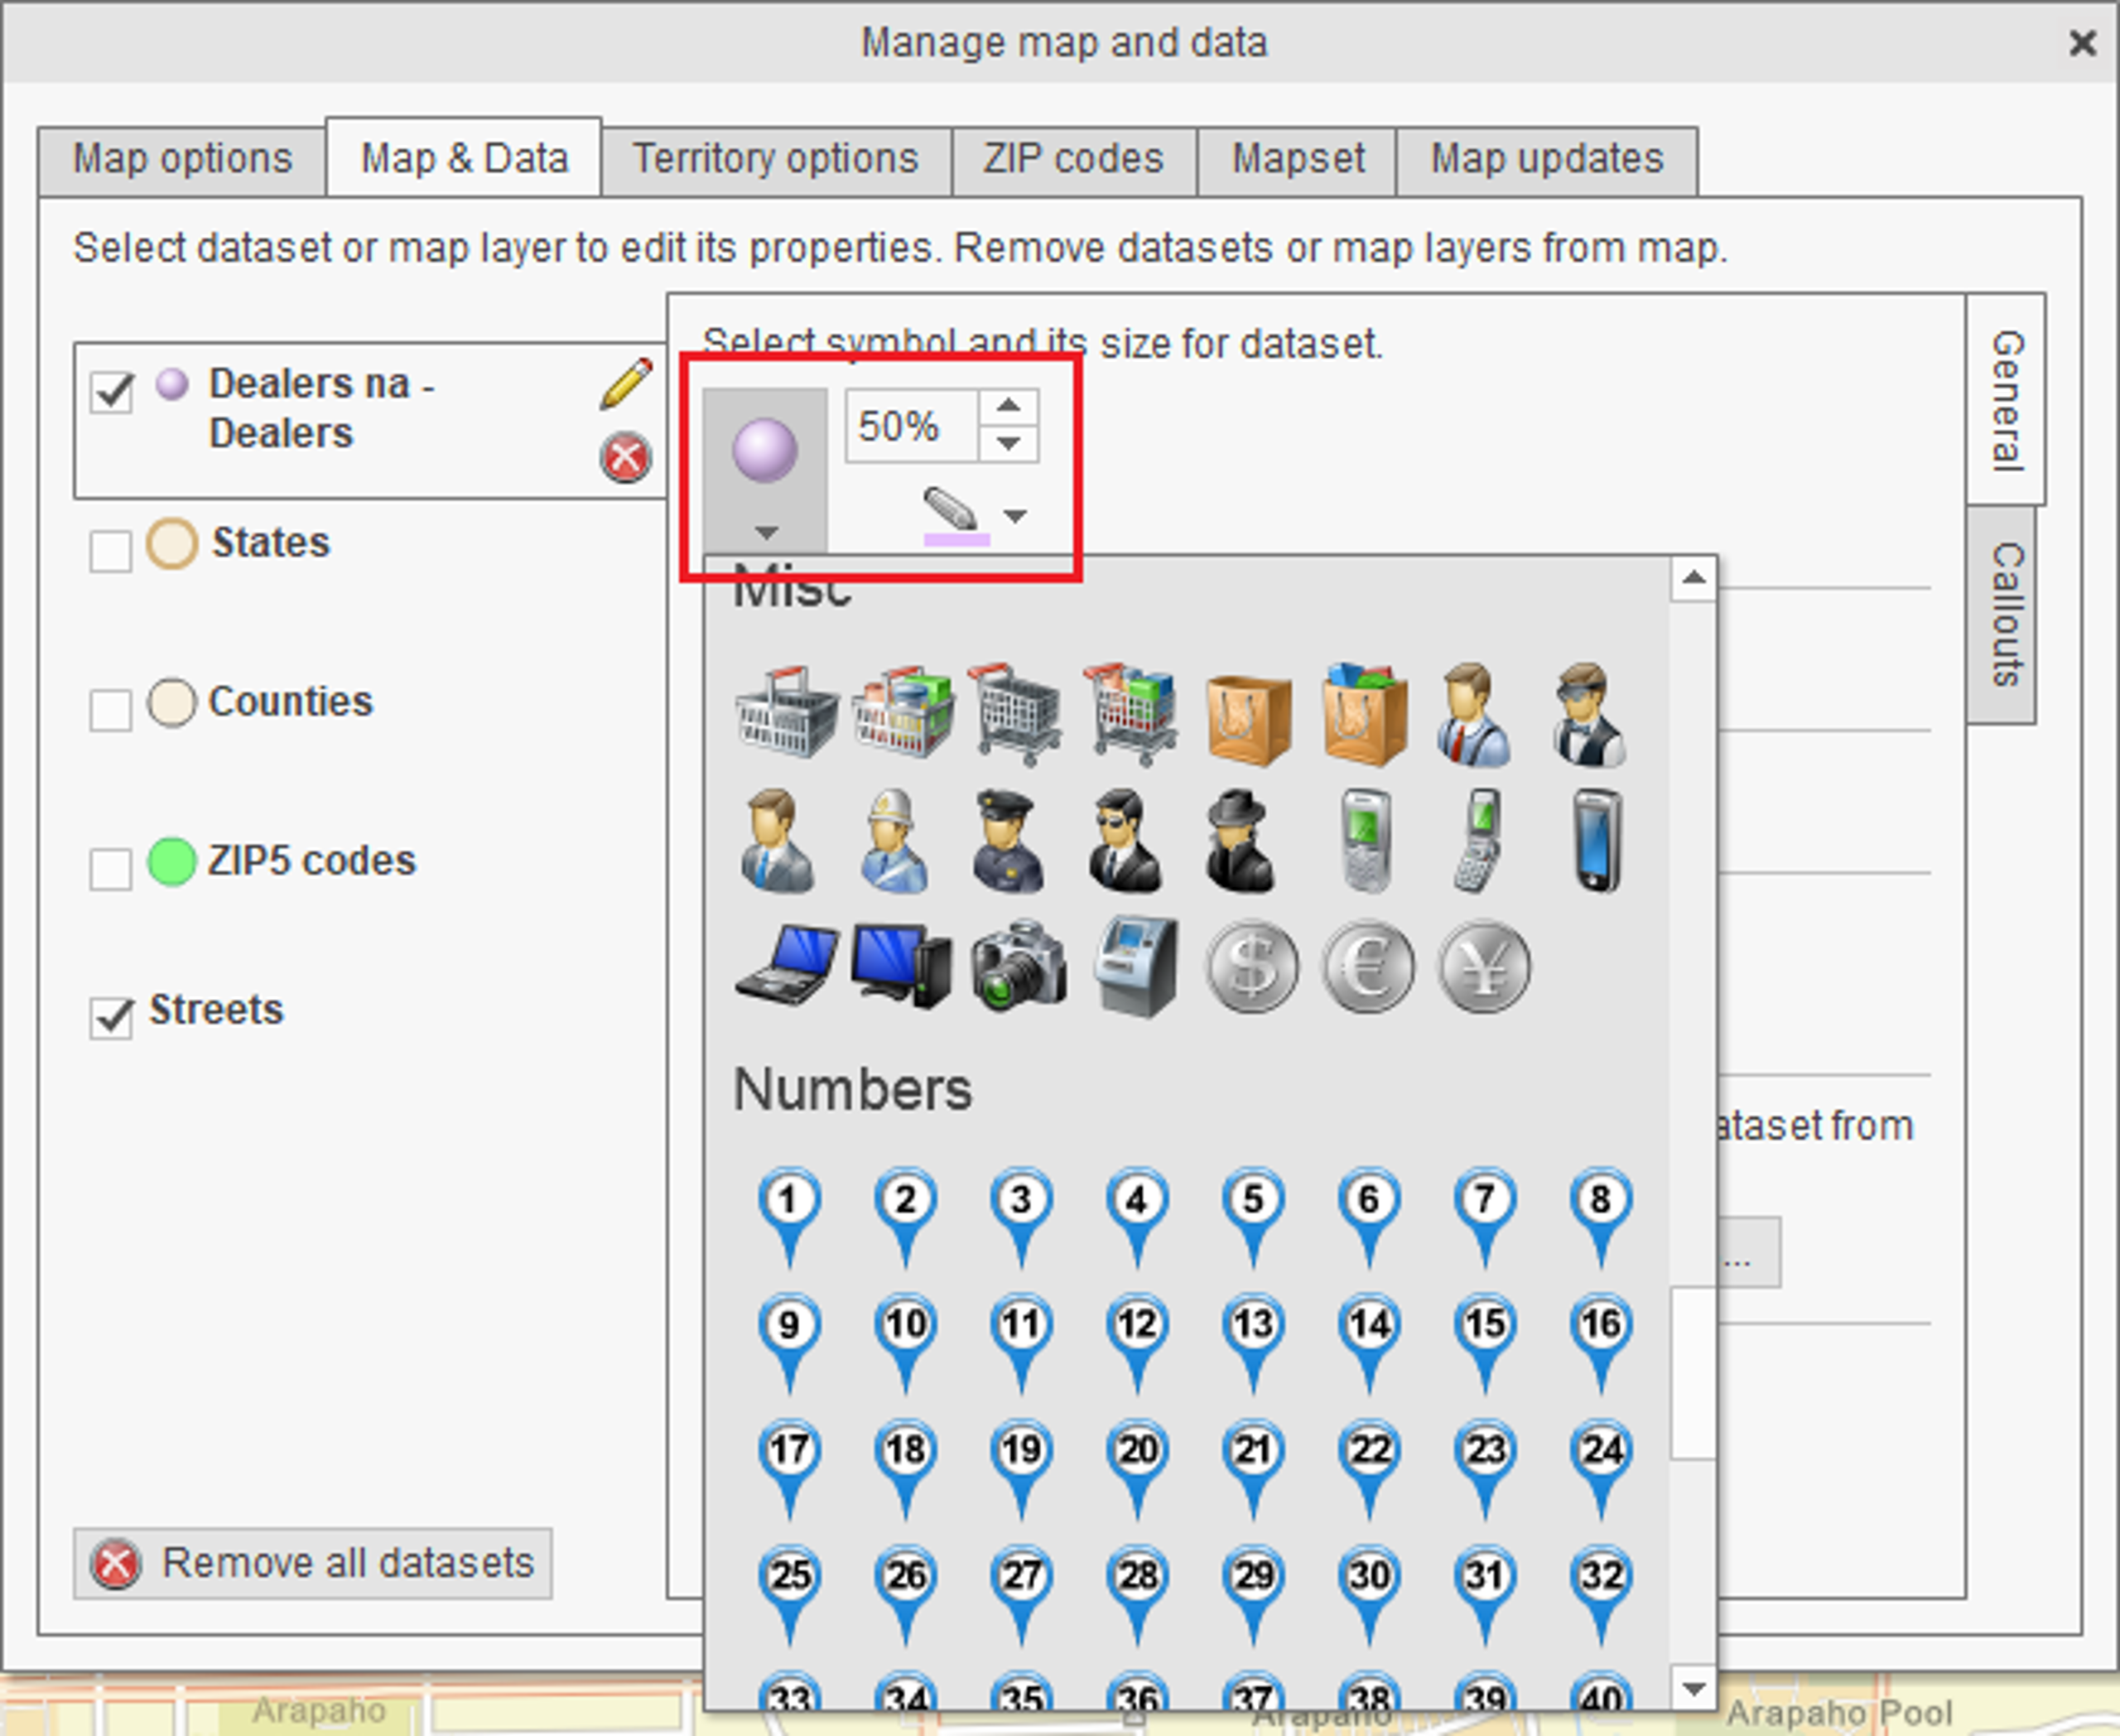
- If necessary, change the dataset symbol.
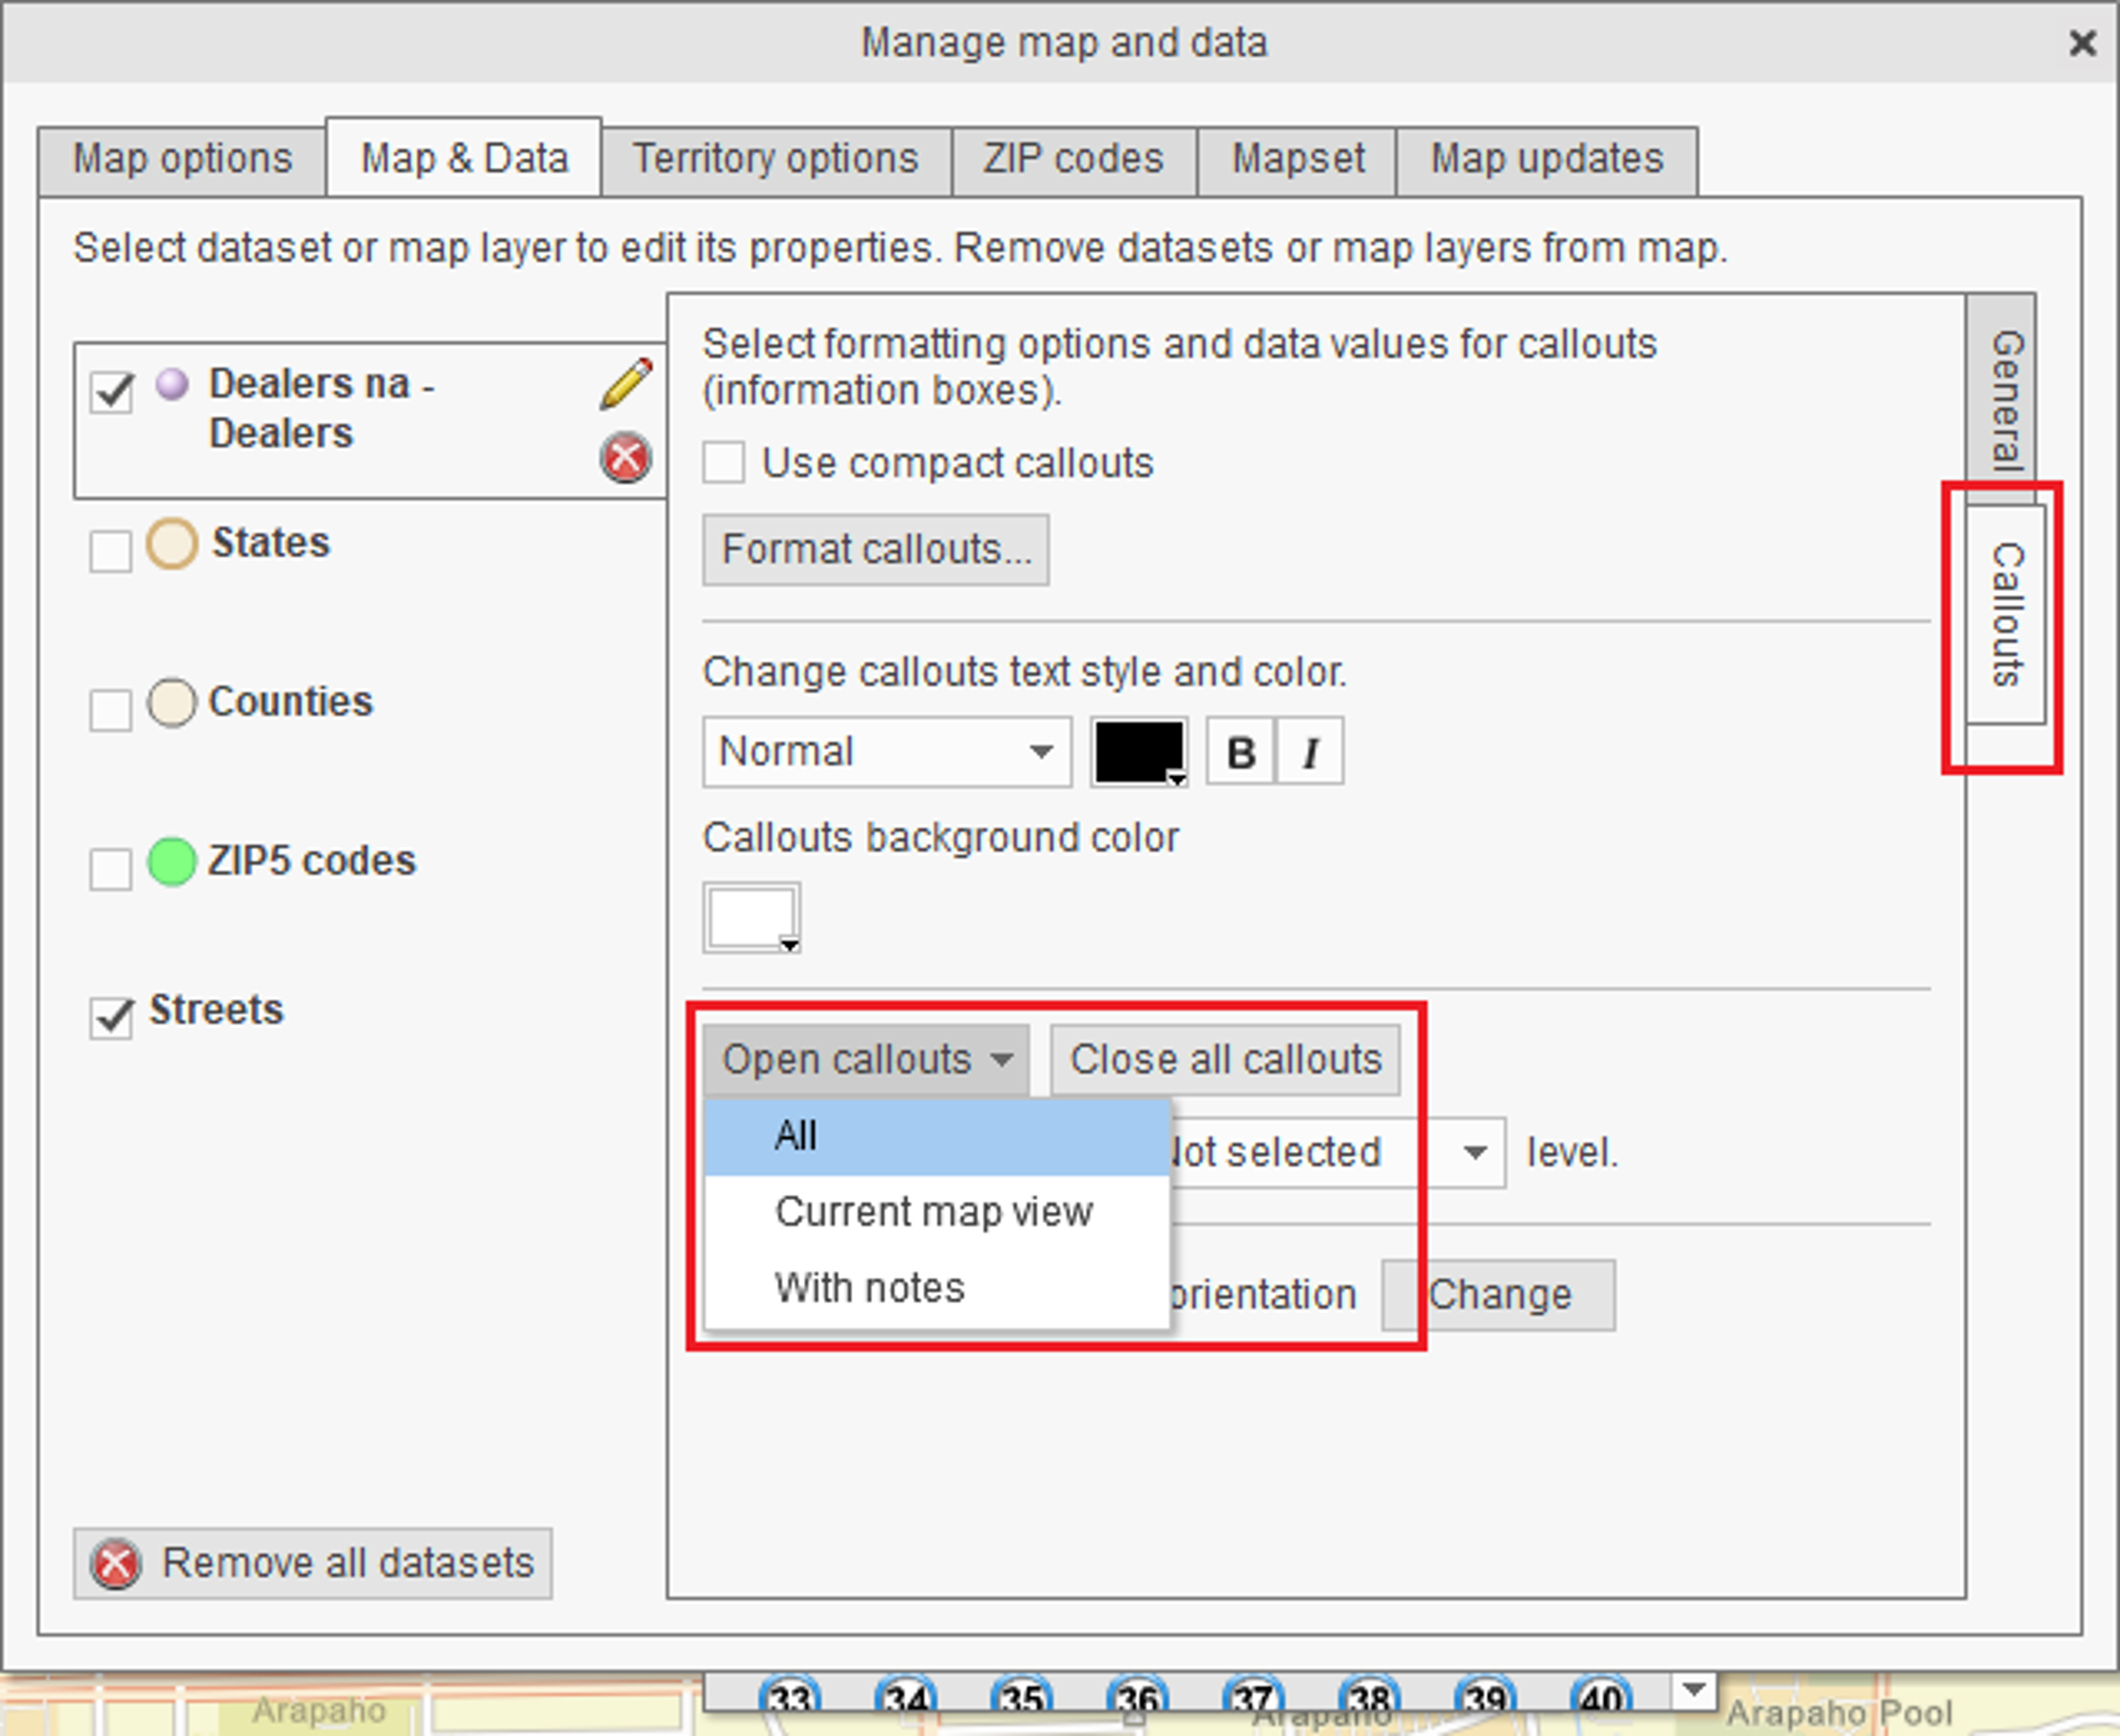
- To change callouts visibility on the map, select the Callouts tab in the Manage map and data dialog. Then click the Open callouts button and choose an option from the dropdown list or click the Close all callouts button.
- Control the dataset visibility on the map by checking/unchecking the box adjacent to the dataset name. You control visibility in the Map & Data window as well.
- To remove a dataset from the map, click the button with the Cross icon. To remove all datasets from the map, click the Remove all datasets button at the bottom of the Map & Data tab in the Manage map and data dialog. Dataset removal is also available in the Map & Data window.