Plot data from Intuit QuickBooks
MapBusinessOnline can import data directly from Intuit QuickBooks. That means you don’t need to save QuickBooks data in Excel file first and then import that file in MapBusinessOnline. Following editions of QuickBooks are supported:
- Online
Begin with setting up MapBusinessOnline connection to QuickBooks. To do that navigate to MapBusinessOnline page on Intuit App Center. Click Try it Now button and follow instructions that you will be provided to set up connection.
Once you have connection between MapBusinessOnline and QuickBooks setup, you can follow the steps below to plot and visualize your data from Intuit QuickBooks:
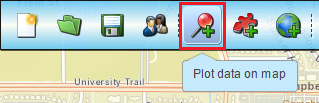
- Click Plot data on MapBusinessOnline toolbar.
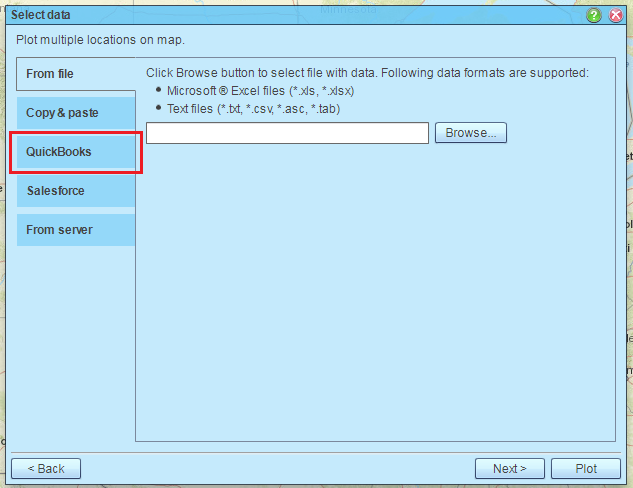
- On the Select data page click-select QuickBooks horizontal tab.
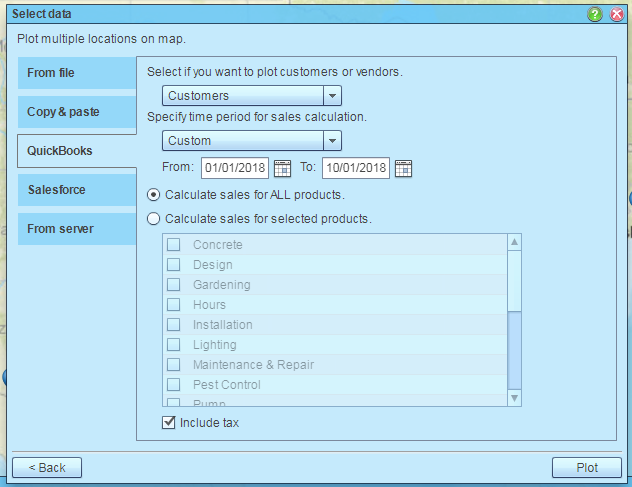
- Select locations you’d like to plot: customers or vendors. Then specify time period to retrieve sales information for. Choose whether you want to get total sales for all products or sales for selected products. Finally click Plot to start plotting data on the map.
NOTE: sales are calculated on accrual basis.
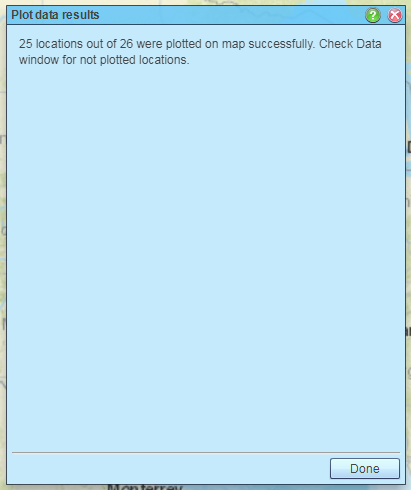
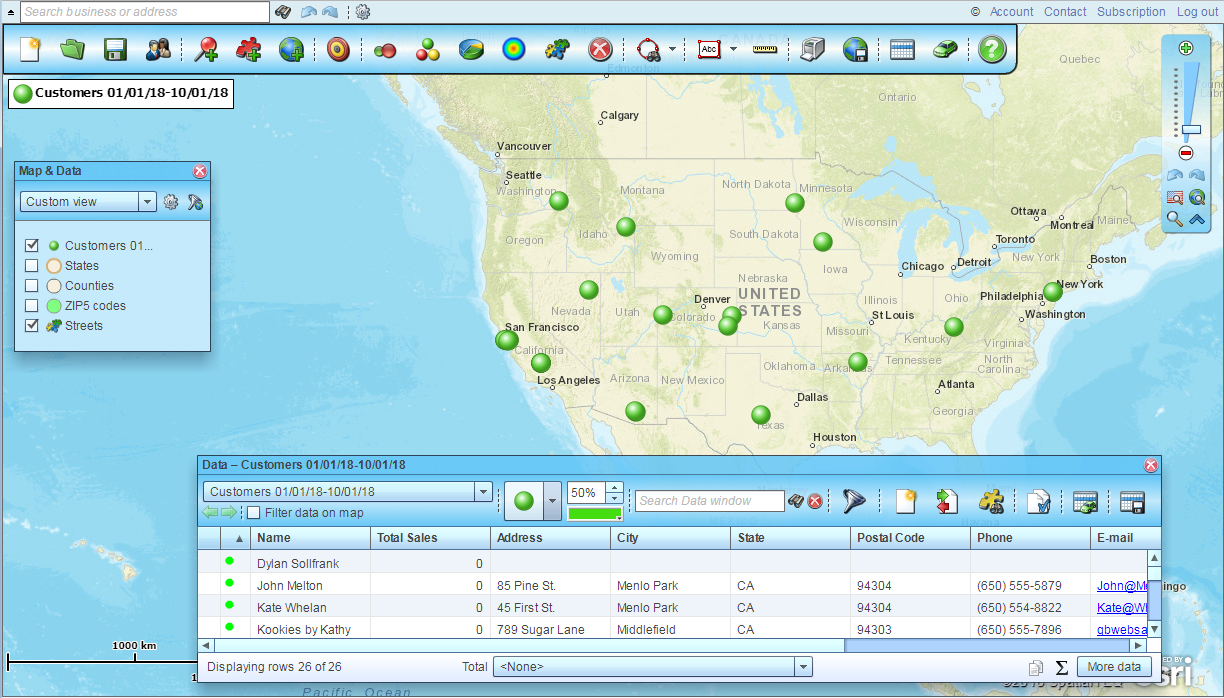
- Plotting data may take some time depending on number of records in your data and speed of Internet connection. On the Plot data results page click Done to see your data on the map.
- You can plot multiple datasets on map. Each dataset is identified by time period you have selected.
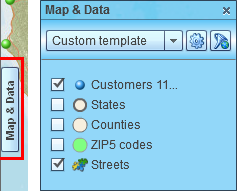
- After plotting data you may want to change dataset properties such as symbol or name. You can access dataset properties from Map & Data window. To open Map & Data window if it is not already visible just click Map & Data tab centered on the left side of map.
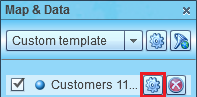
- Move mouse pointer over dataset name in Map & Data window and click gear icon that will appear to open ‘Manage map and data’ dialog.
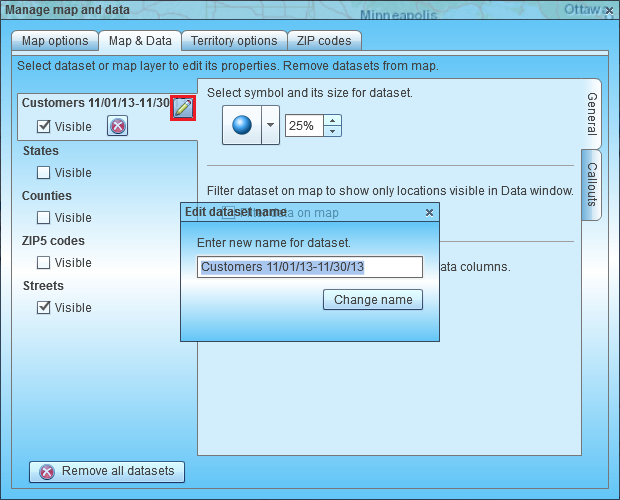
- Once inside ‘Manage map and data’ dialog move mouse pointer over dataset name (dataset tab) and click pencil (edit) icon that will appear. Enter new dataset name and click ‘Change name’ button.
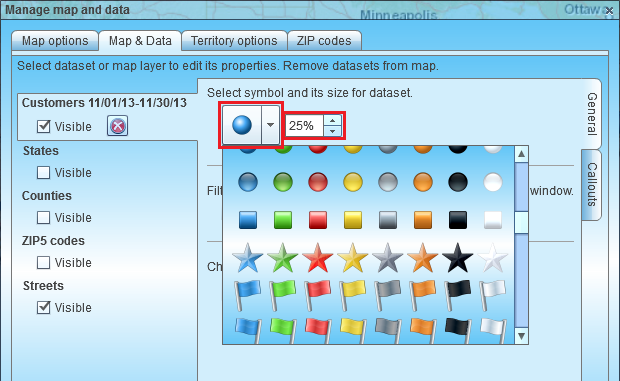
- If necessary change dataset symbol. You can also modify dataset symbol by clicking it in Map & Data window.
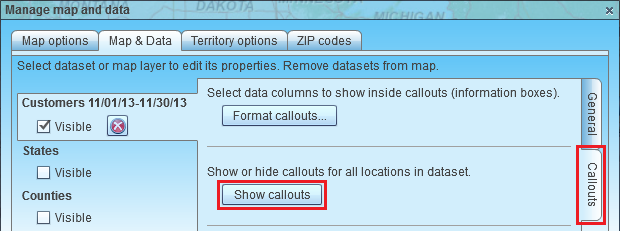
- To turn on or off callouts for your data on map first select ‘Callouts’ vertical tab in ‘Manage map and data’ dialog. Then click ‘Show callouts’ or ‘Hide callouts’ button (button will appear depending on current callouts state).
- To show/hide data on map check/uncheck ‘Visible’ box. You can also do that from Map & Data window.
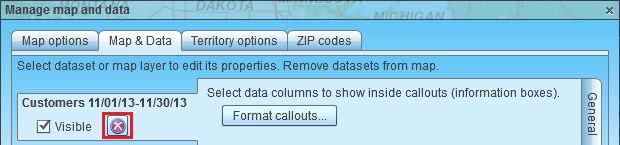
- To remove dataset click icon with cross symbol. To remove all datasets from map click ‘Remove all’ button.
- You may want visualize product sales by customer location. Please refer to this link: Color code dataset locations with circles
- You can also show product sales by ZIP code. Please refer to following link for more information: Color code map or territories


