Plot data from Microsoft Dynamics CRM Online
Follow the steps below to plot your data from Microsoft Dynamics CRM Online:
- Launch Internet browser and start Microsoft Dynamics CRM Online.
- In order to use Microsoft Dynamics CRM Online data in MapBusinessOnline export the data into Microsoft Excel file. You can use views or reports as the data sources.
Lets say we want to plot data from report. Open required report and check that it contains address information to be plotted on map ( Address1: Street 1, Address 1: City, Address 1: State/Province, Address 1: ZIP/Postal Code, Address 1: Country), customer or account name, and business data like sales, revenues, or products for color coding (for example Annual Revenue, Total Won).
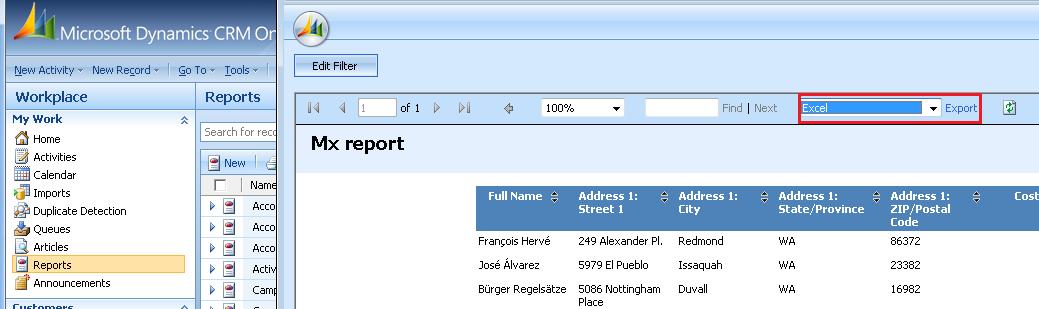
After report has been created within CRM Online, export it into Excel file. To do this select Excel format and click Export. Specify file name in the popup dialog and click Save.
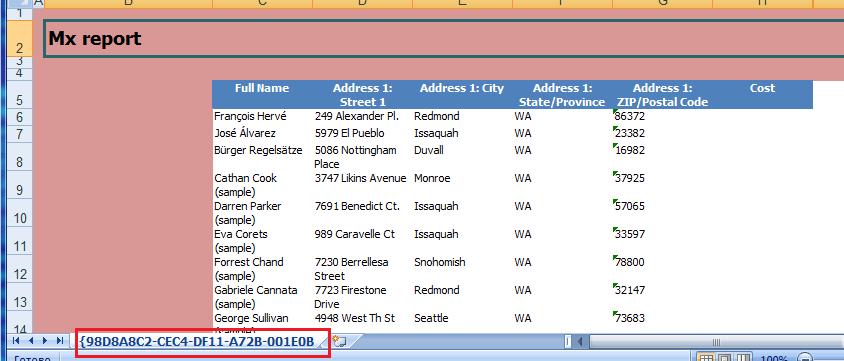
- Open just exported file in Excel and make some cleaning to allow MapBusinessOnline open the file correctly.
Remove rows and columns filled with red color on the following picture. Rename report worksheet to human readable name as MapBusinessOnline assigns this name to plotted data.
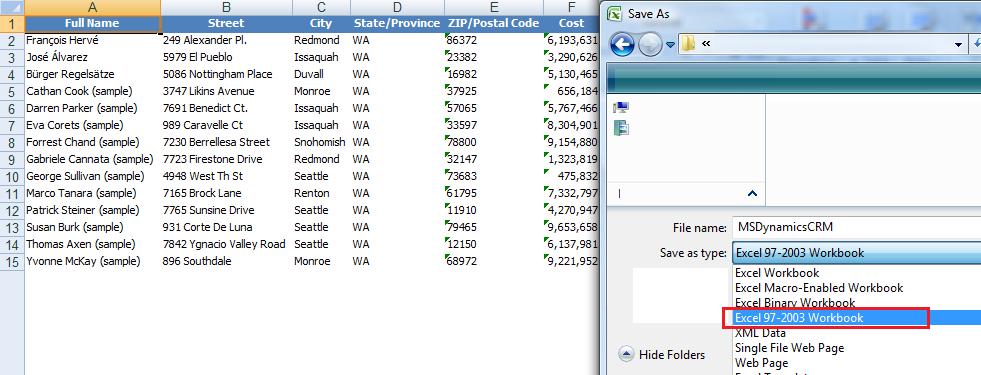
Finally select Save As in Excel and choose Excel 97-2003 Workbook (if you are using Excel 2007) or Microsoft Excel Workbook (otherwise) format to save the file in Excel format supported by MapBusinessOnline.
- Follow instructions on how to Plot data from Microsoft® Excel using Excel file you have just saved.


