Plot Included Location Datasets
MapBusinessOnline provides access to a variety of location datasets (public data) including data samples, cities, places, ZIP codes (point and boundary), and schools (availability of the datasets depends on the map region and level of subscription you have purchased). Follow the instructions below to plot such a dataset on a map.
- Click the pushpin with plus sign button on the main toolbar to begin plotting locations.
- Plot data wizard will start. Skip the introduction (welcome) page if it appears.
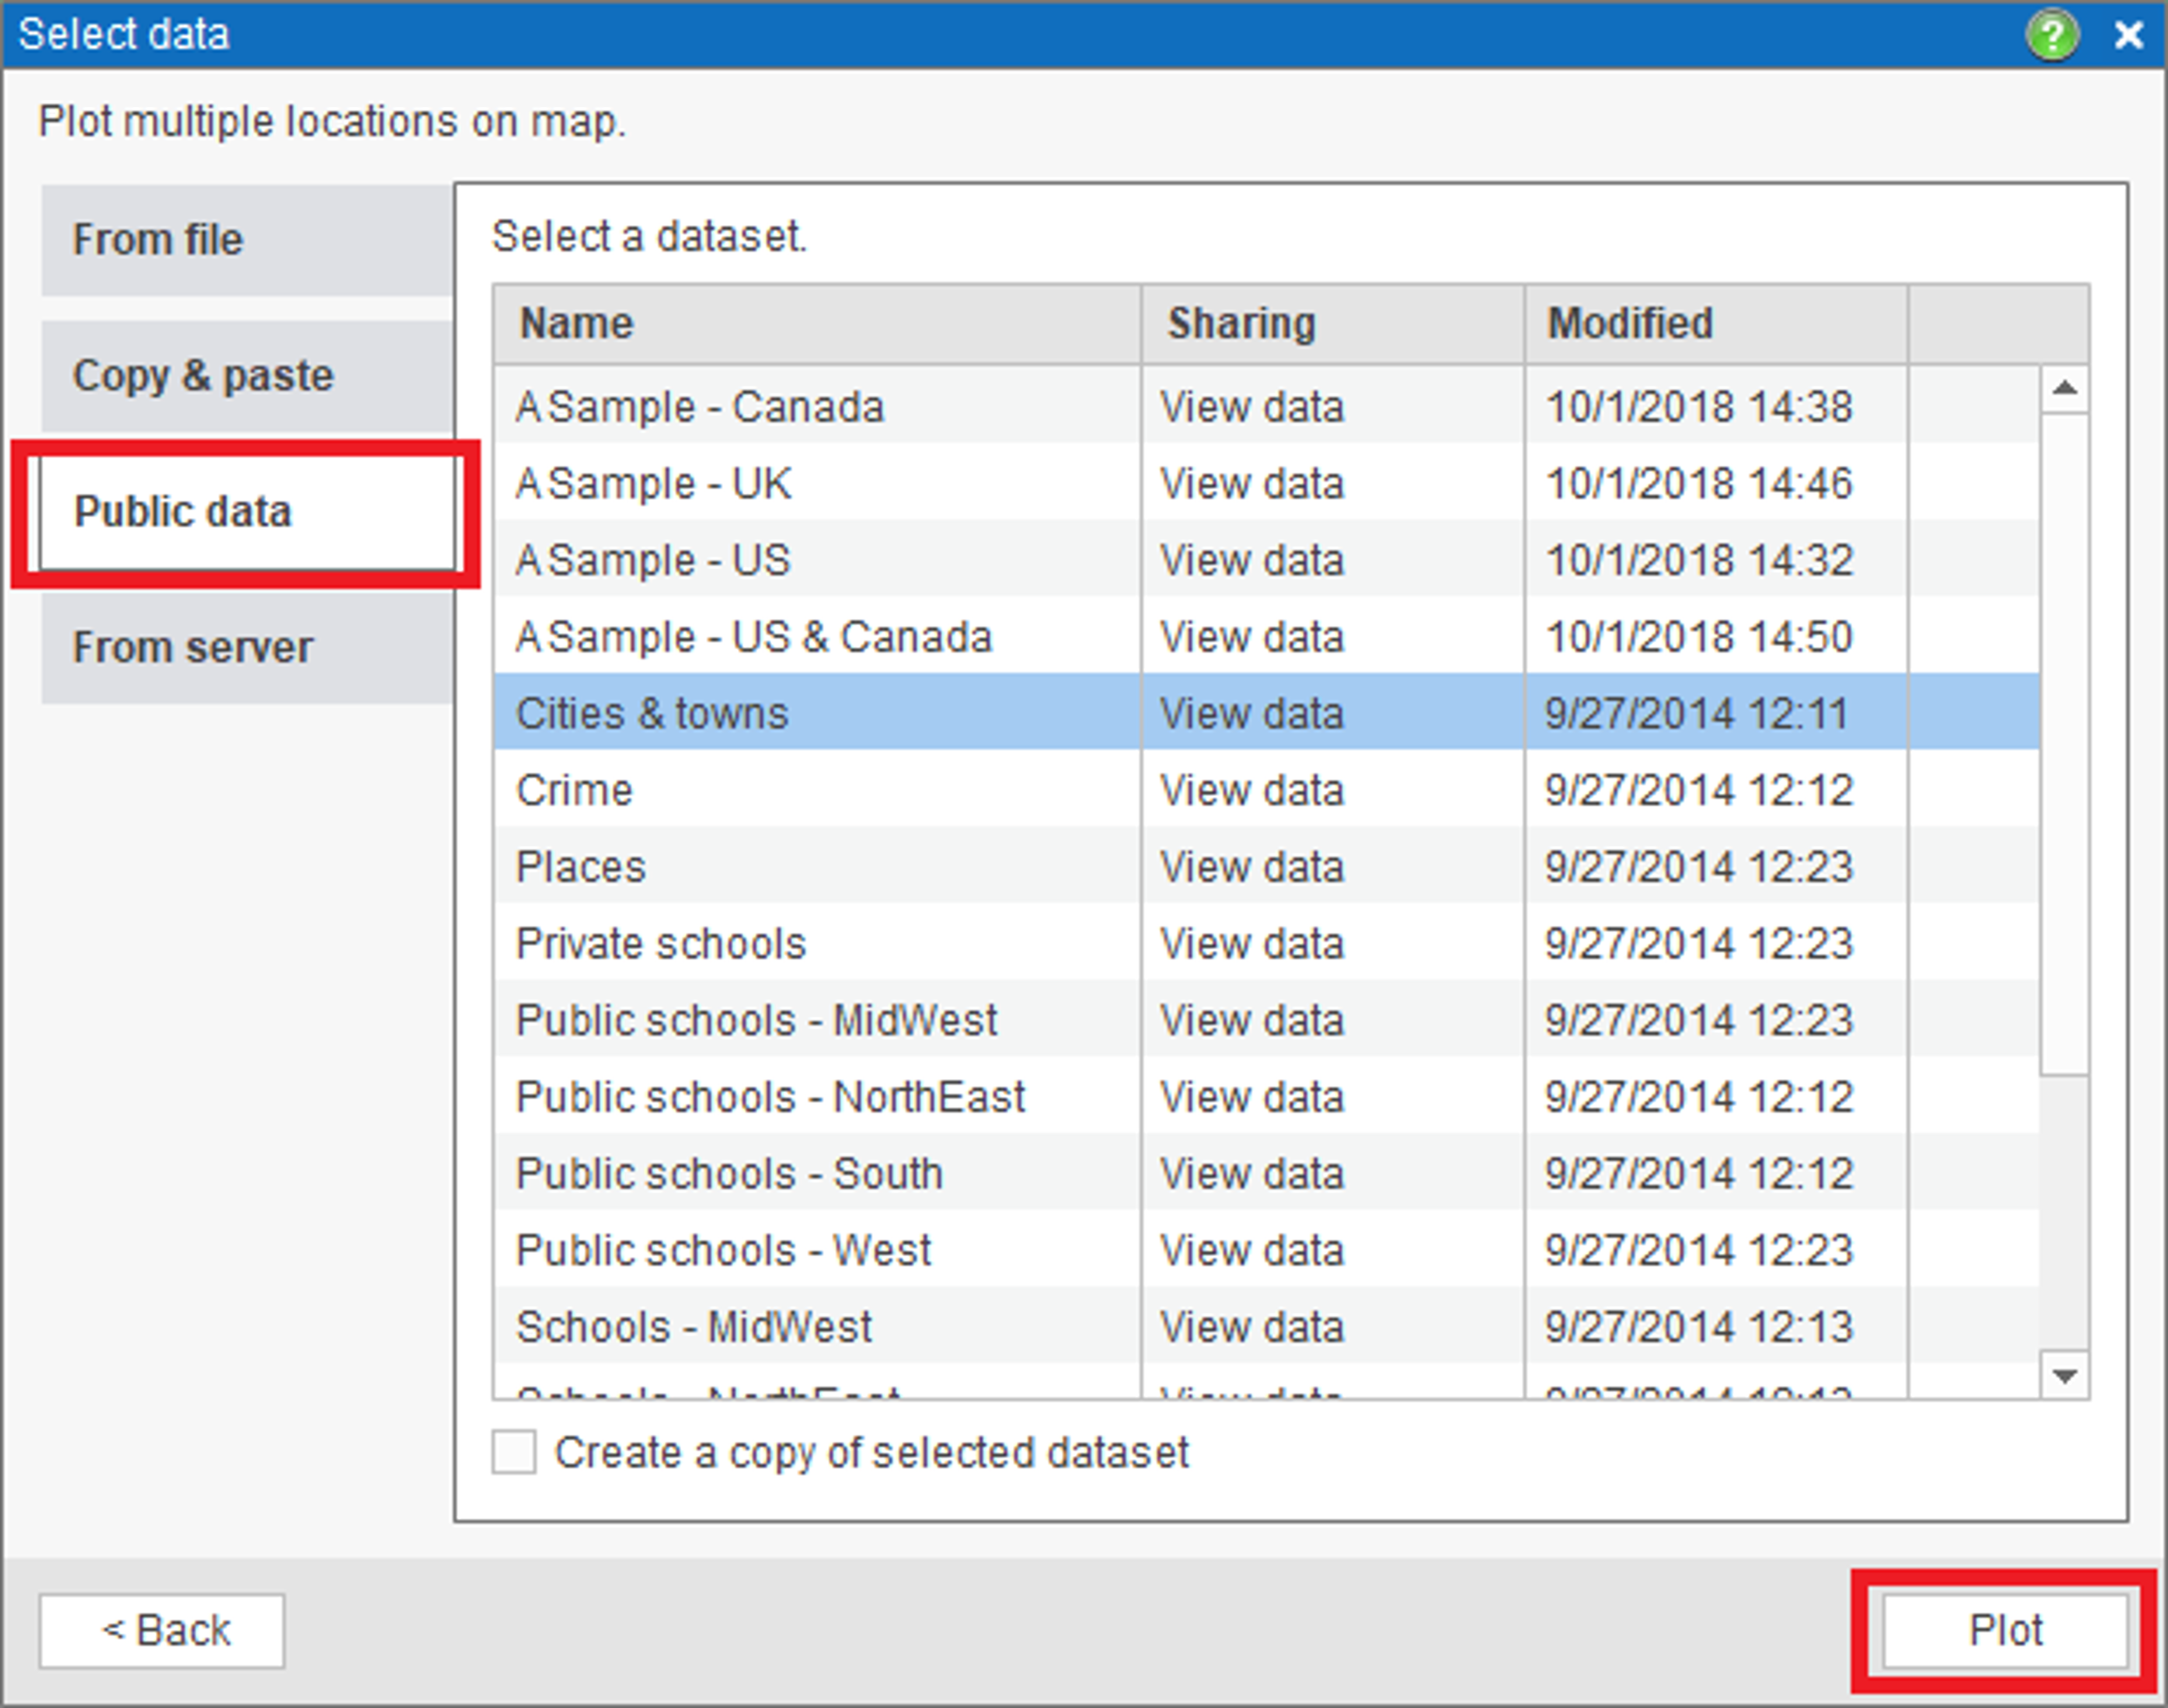
- On Select data page choose Public data option as you can see on the picture below. In the list of datasets select one you want to plot and click Plot button.
- MapBusinessOnline will start plotting the selected dataset.
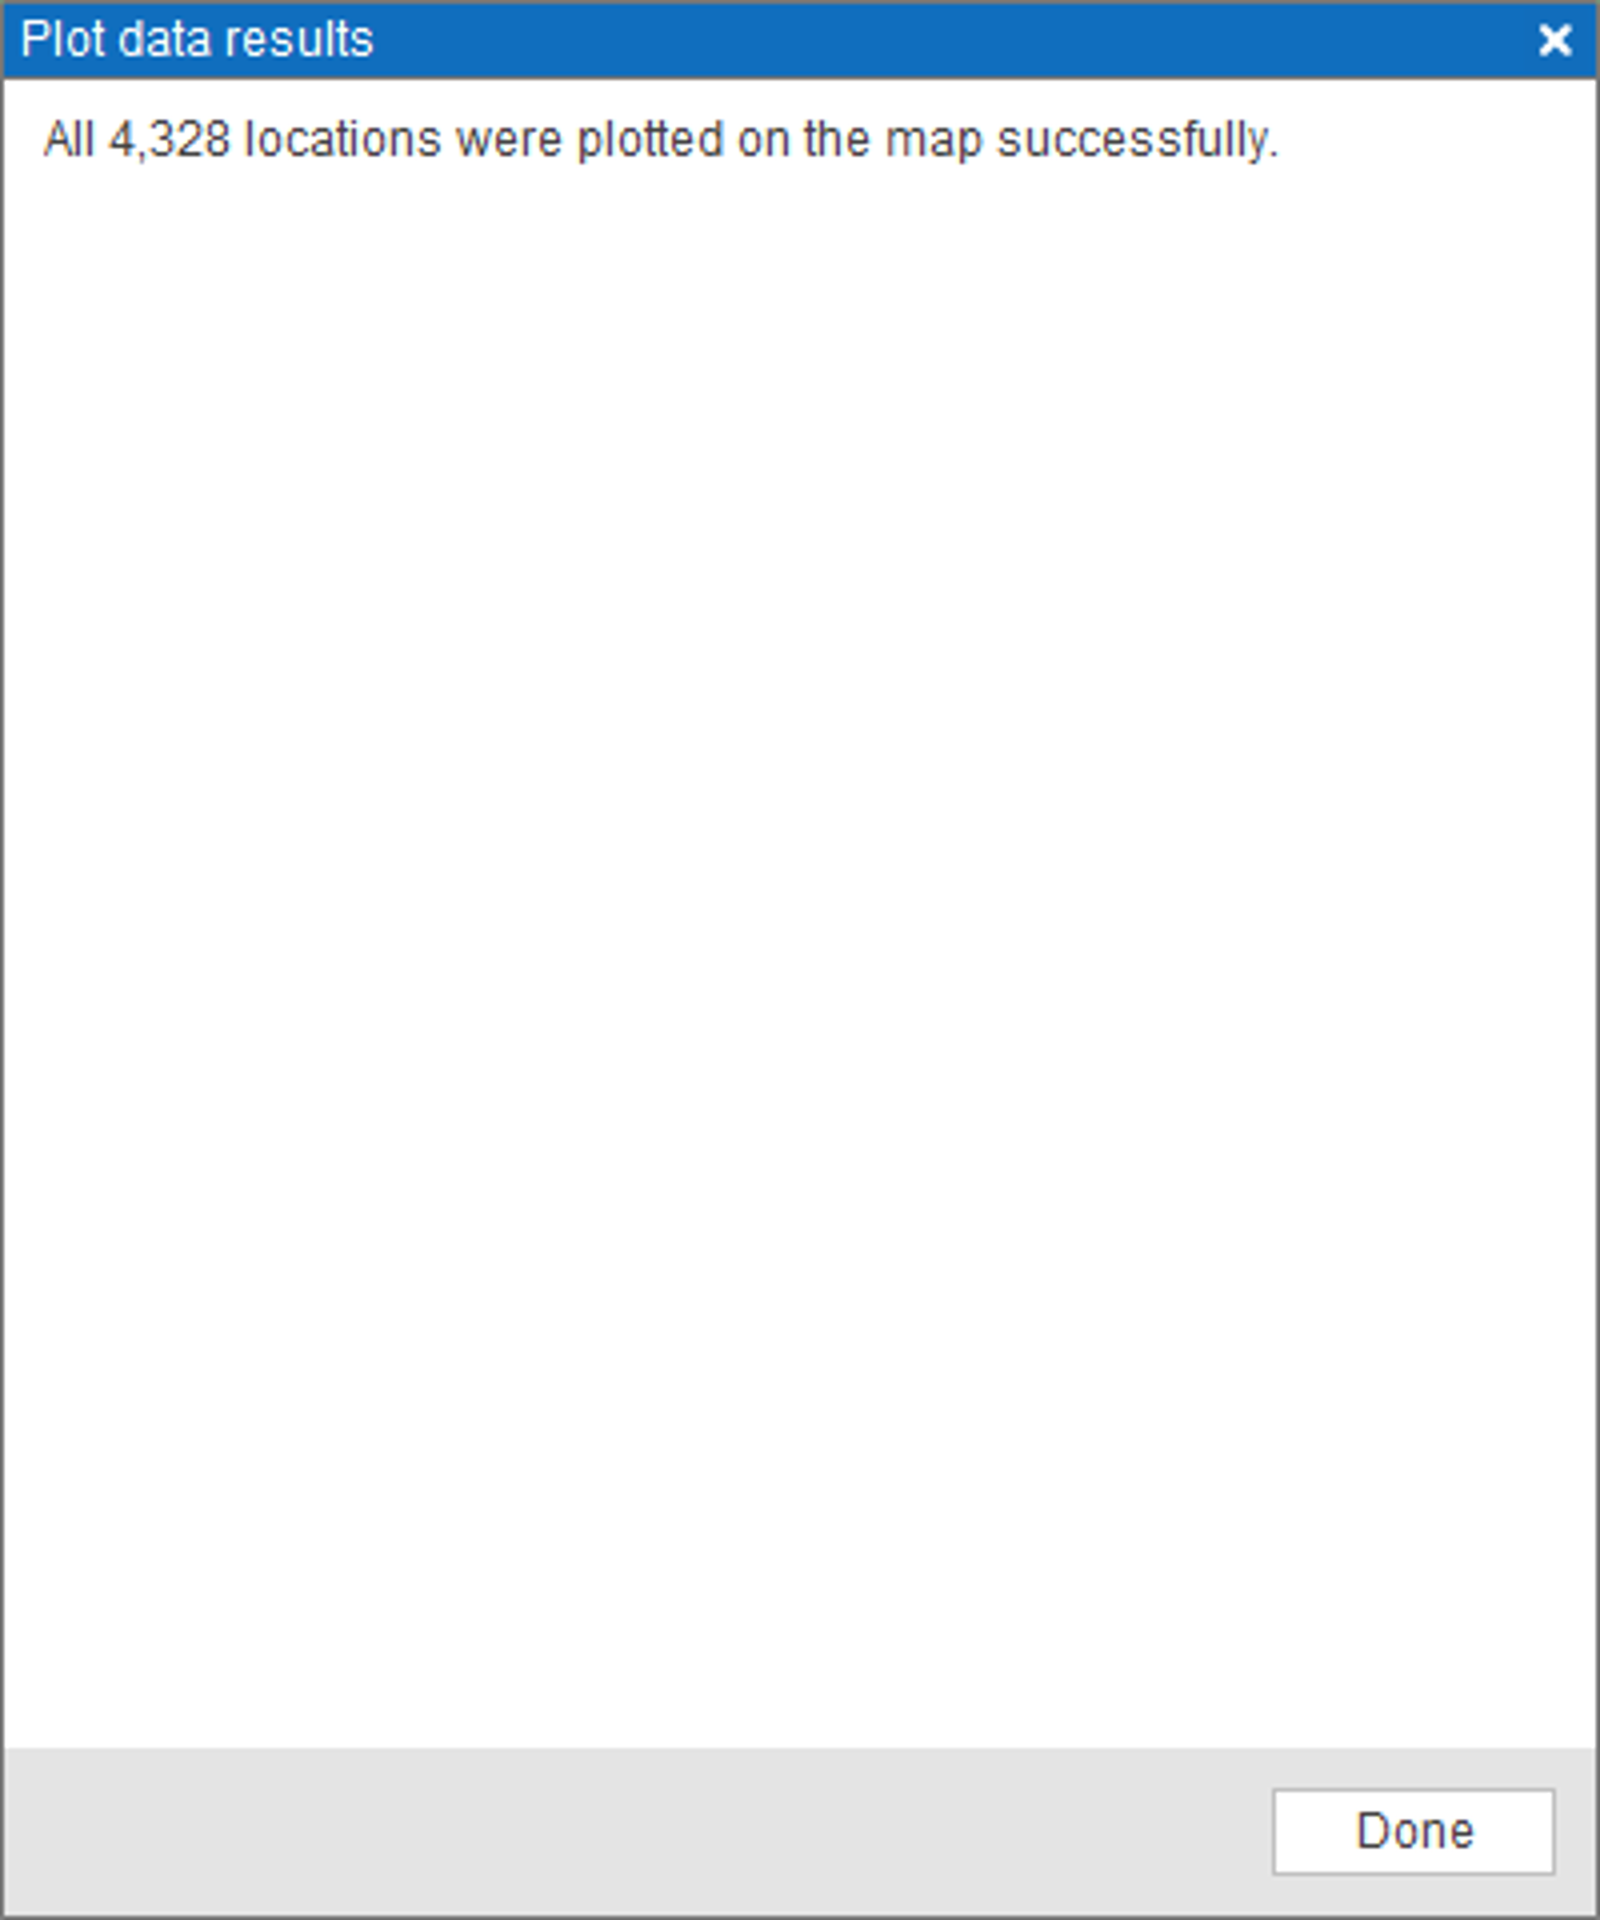
- Once dataset has been plotted simply click Done button on the Plot data results page.
- Your map is ready!
Related articles
Add Cities, Highways, Census tracts, ZIP3 codes and other layers to map


