Summarize Demographic Data for Multiple Locations
This article provides step-by-step instructions on how to obtain demographics for multiple market areas at once.
Related article: Aggregate demographic data in circle
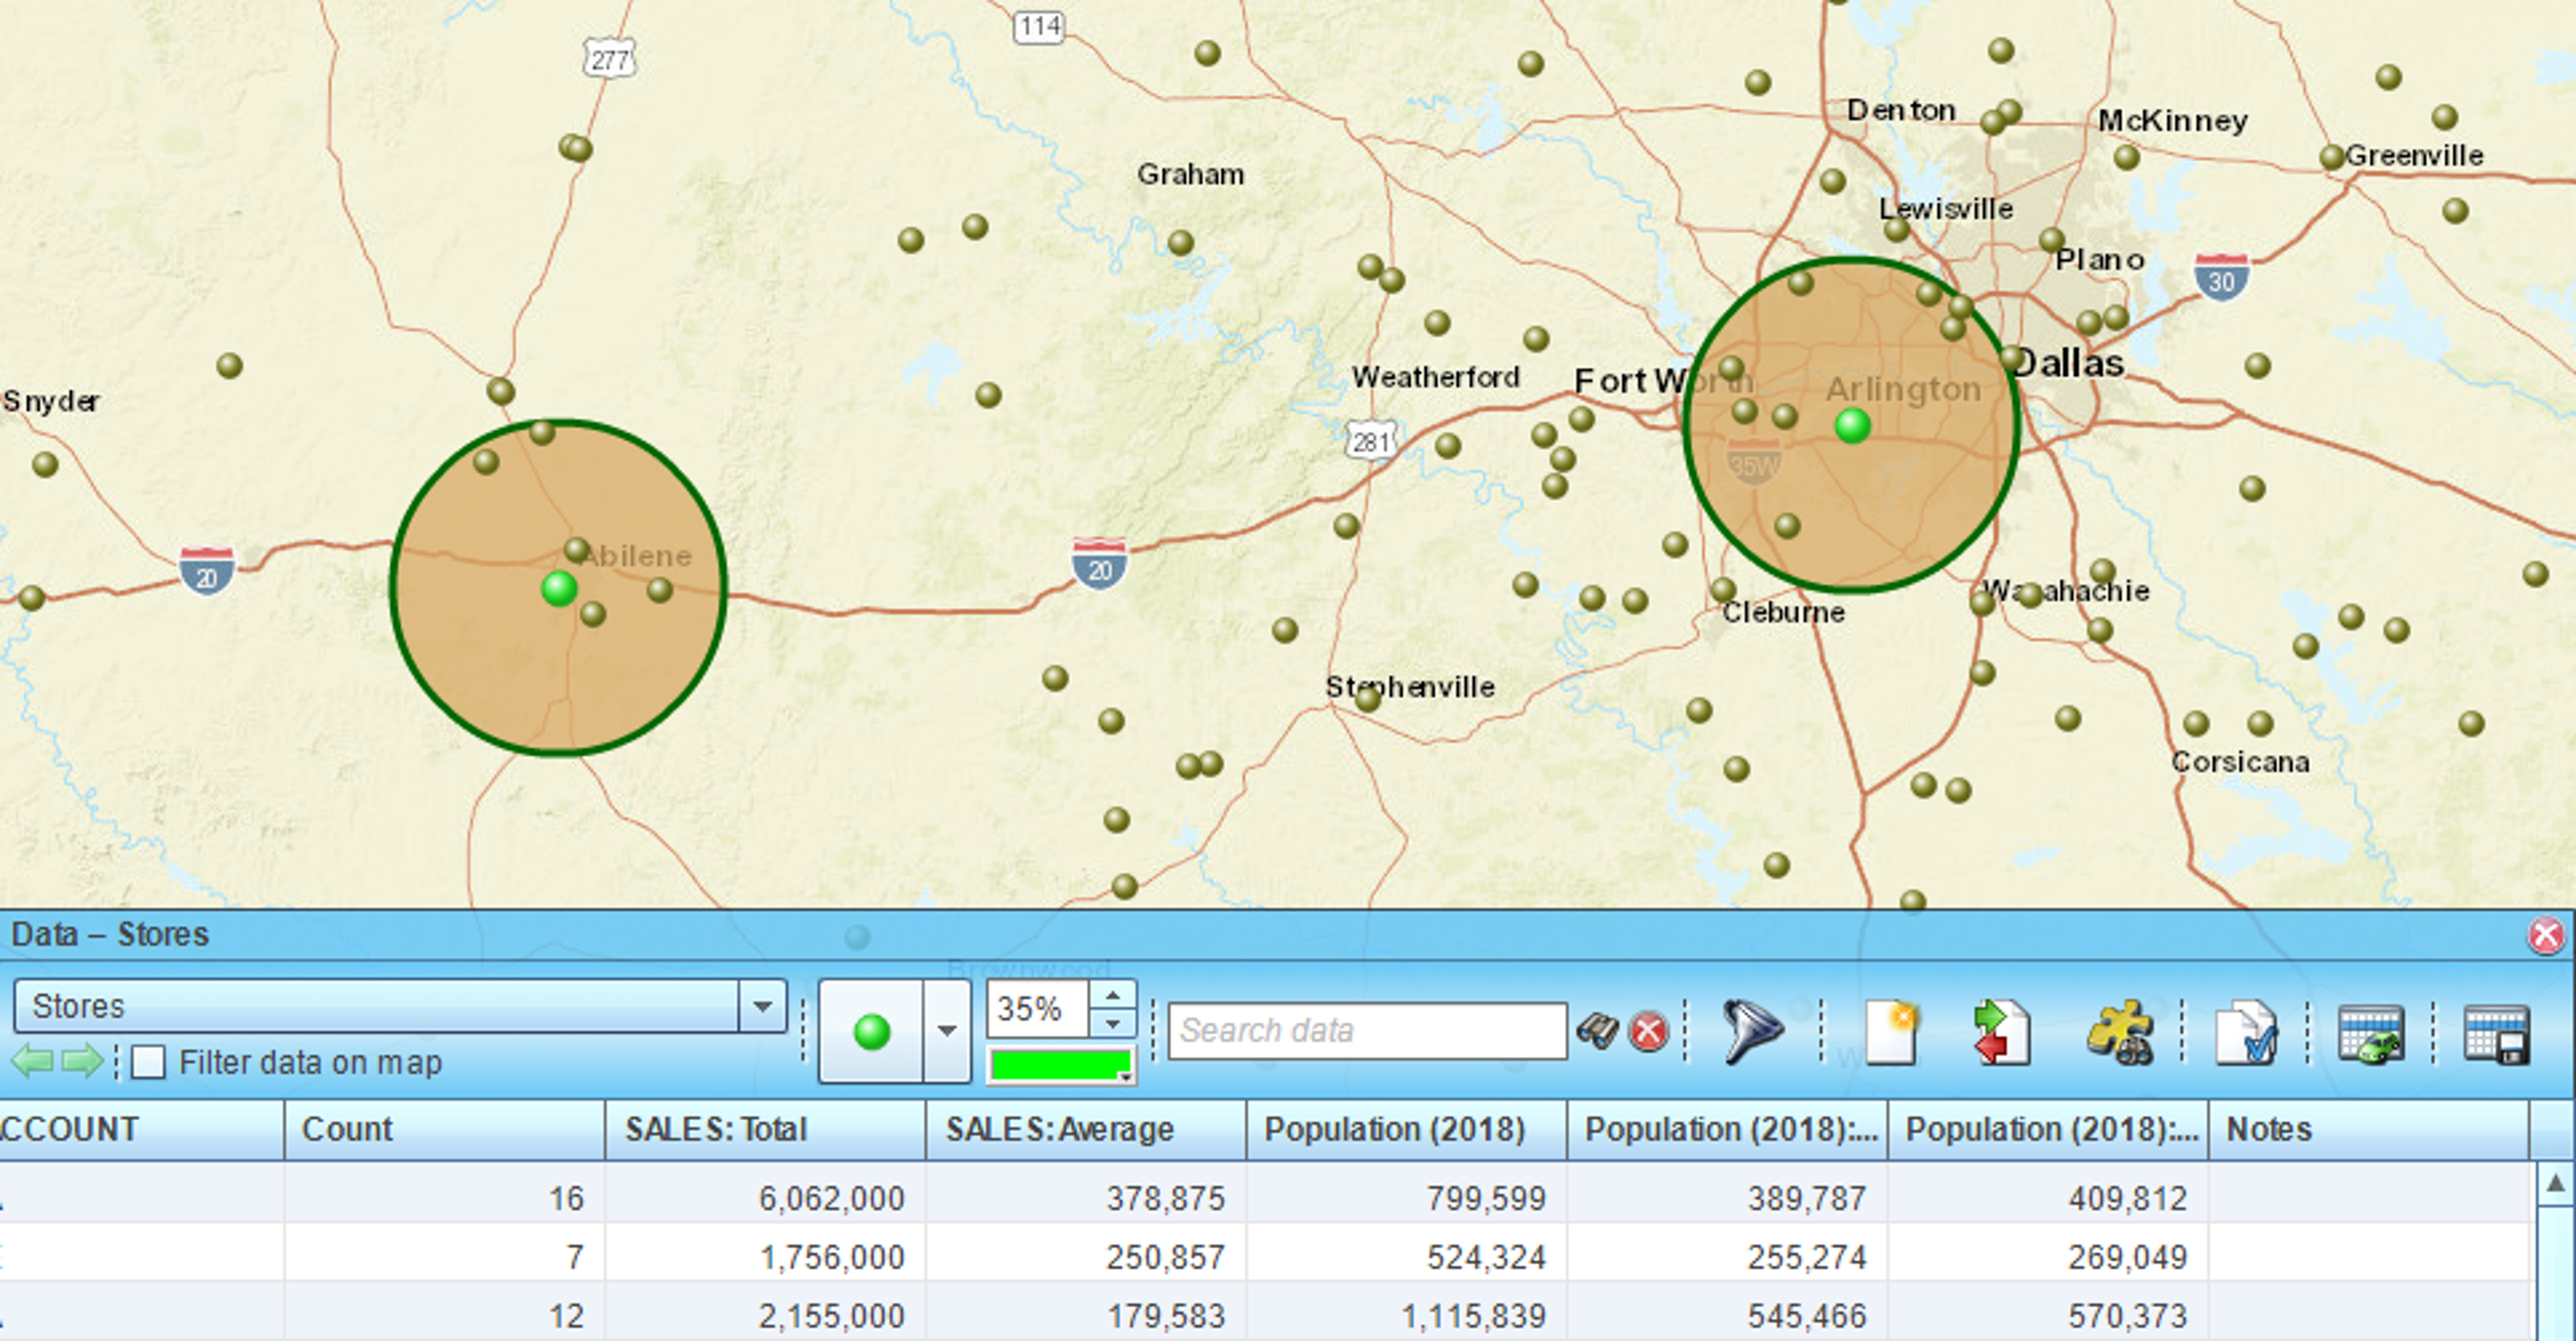
MapBusinessOnline supports summarizing demographic data not only within a single radius or a custom area but also within a radius for multiple center locations. For example, as part of a site analysis to find the best location for a new store, you can calculate demographics such as household income or population in certain age segment within 10 miles from each potential site.
- Start by plotting your locations on a map. Read this article for detailed instructions.
- Click Market analysis icon on the main toolbar.

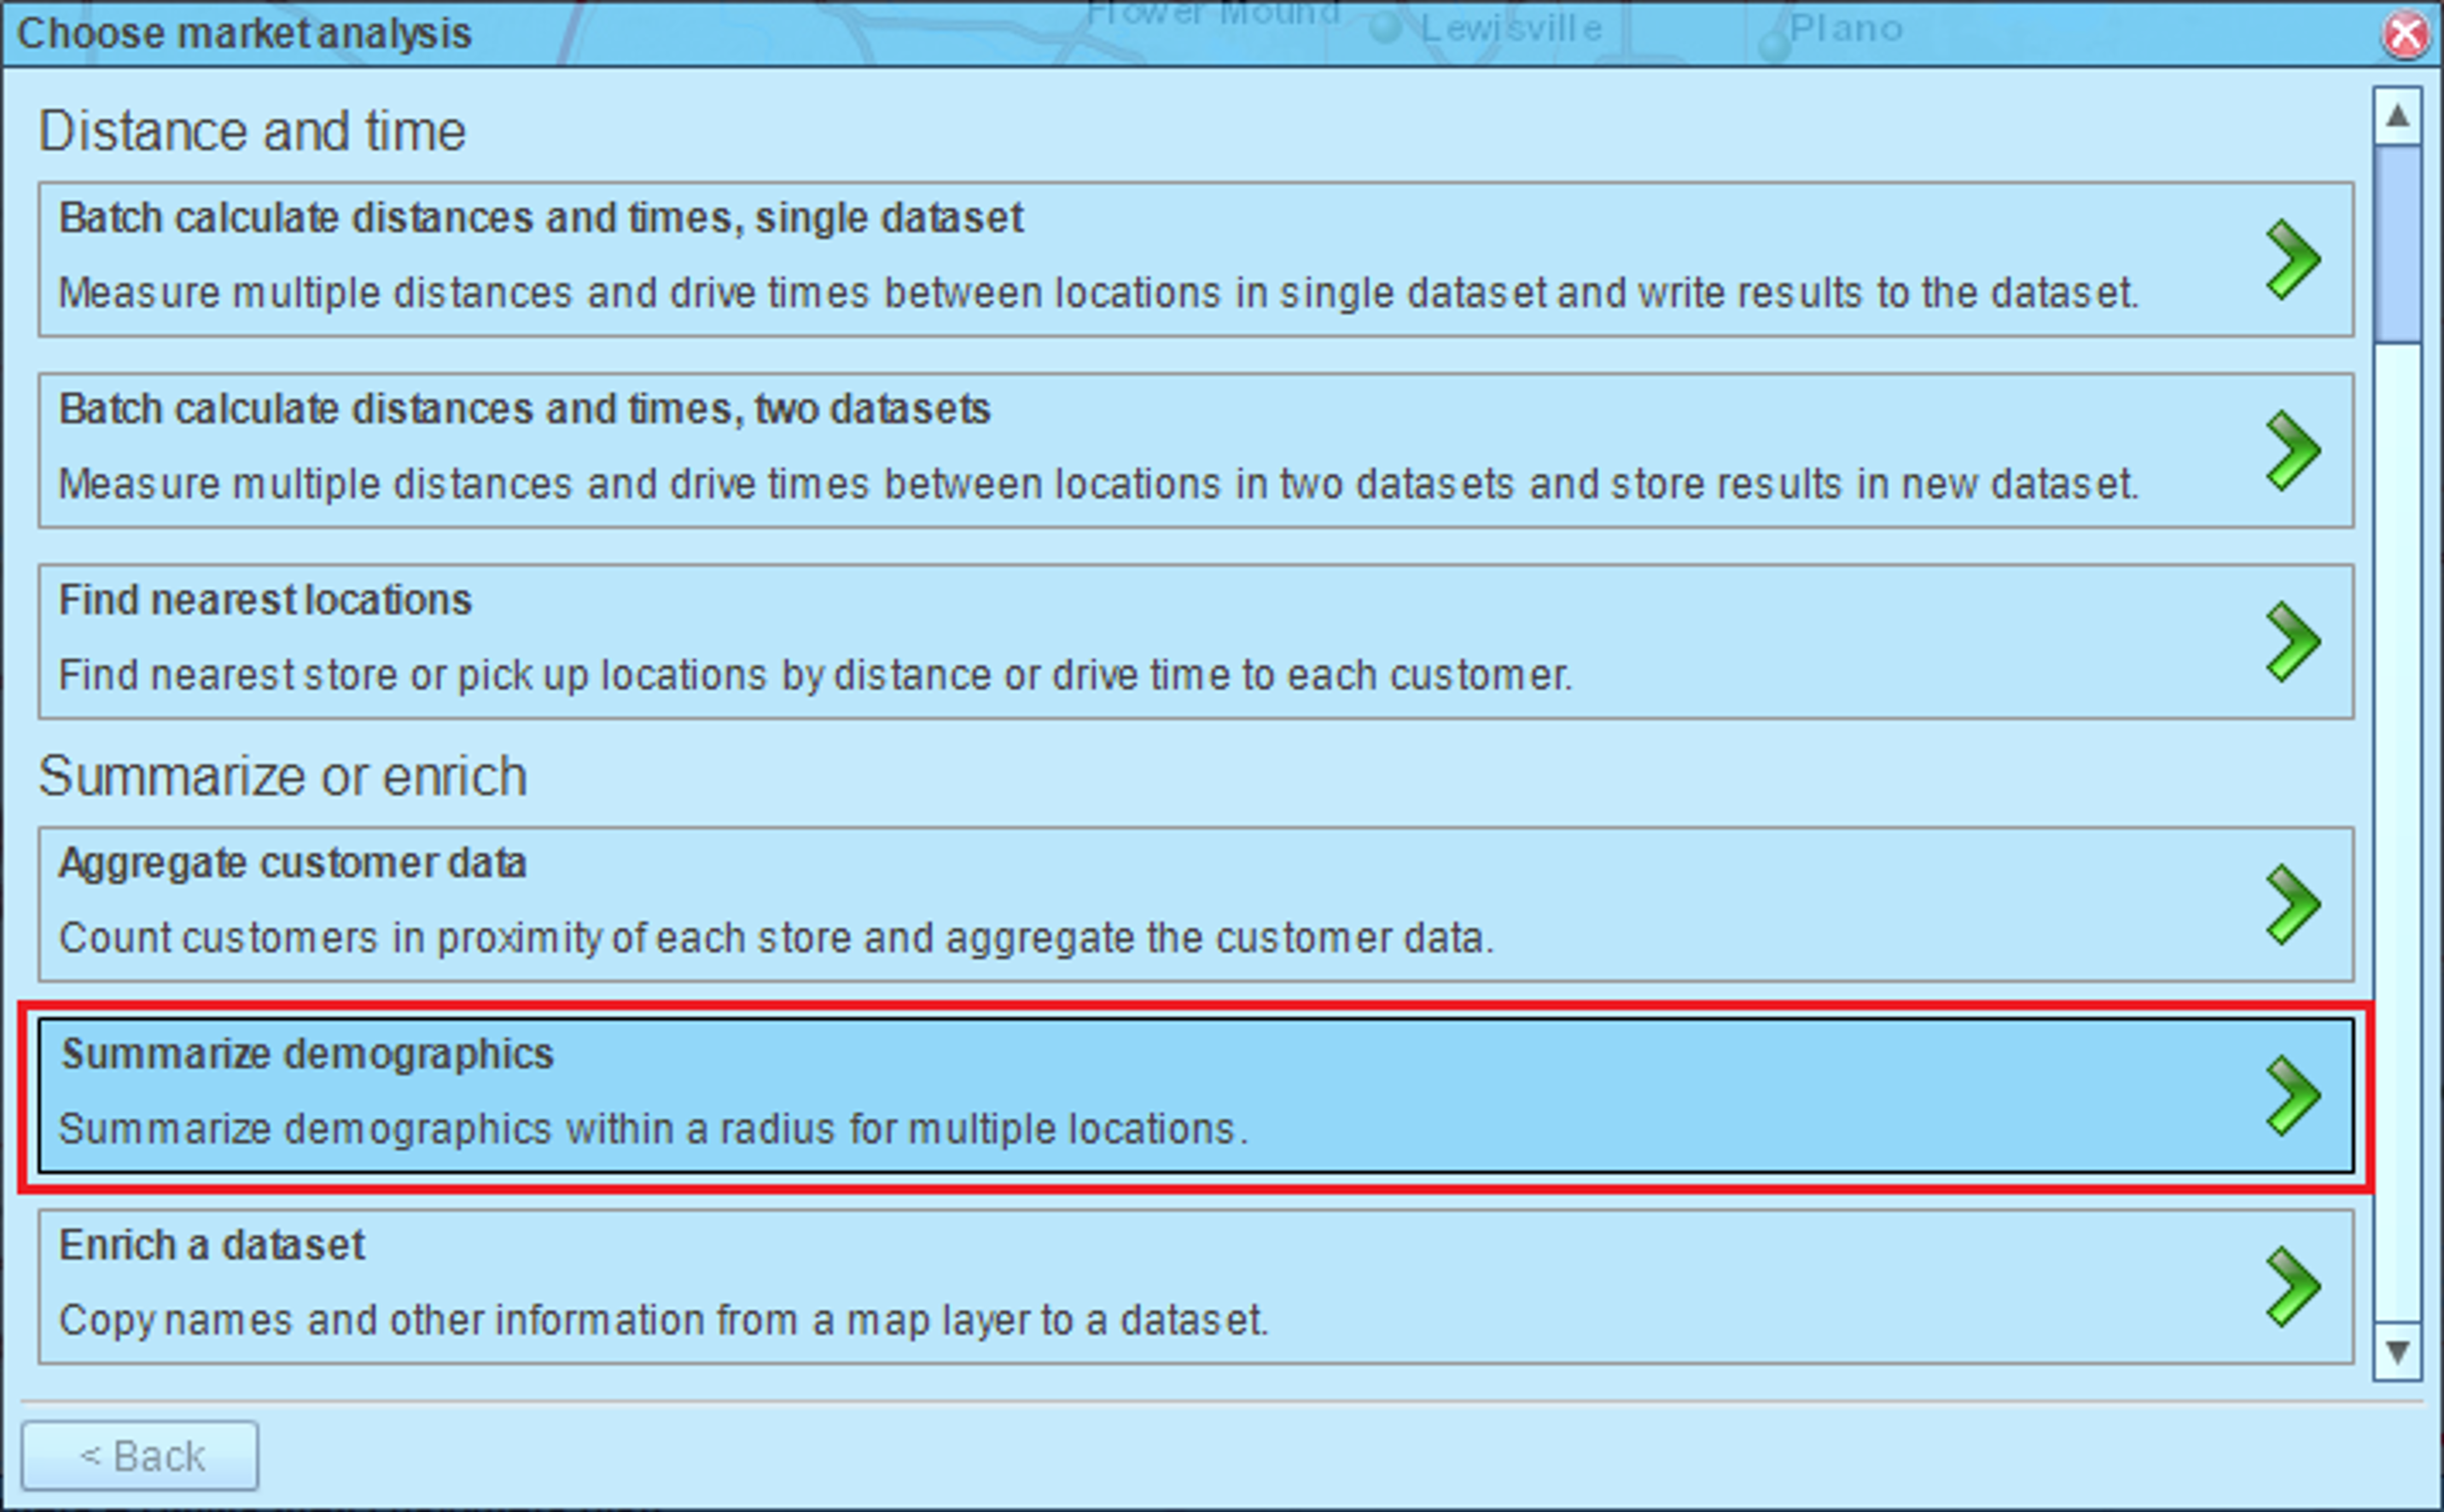
- In the Market analysis wizard choose the Summarize demographics option.
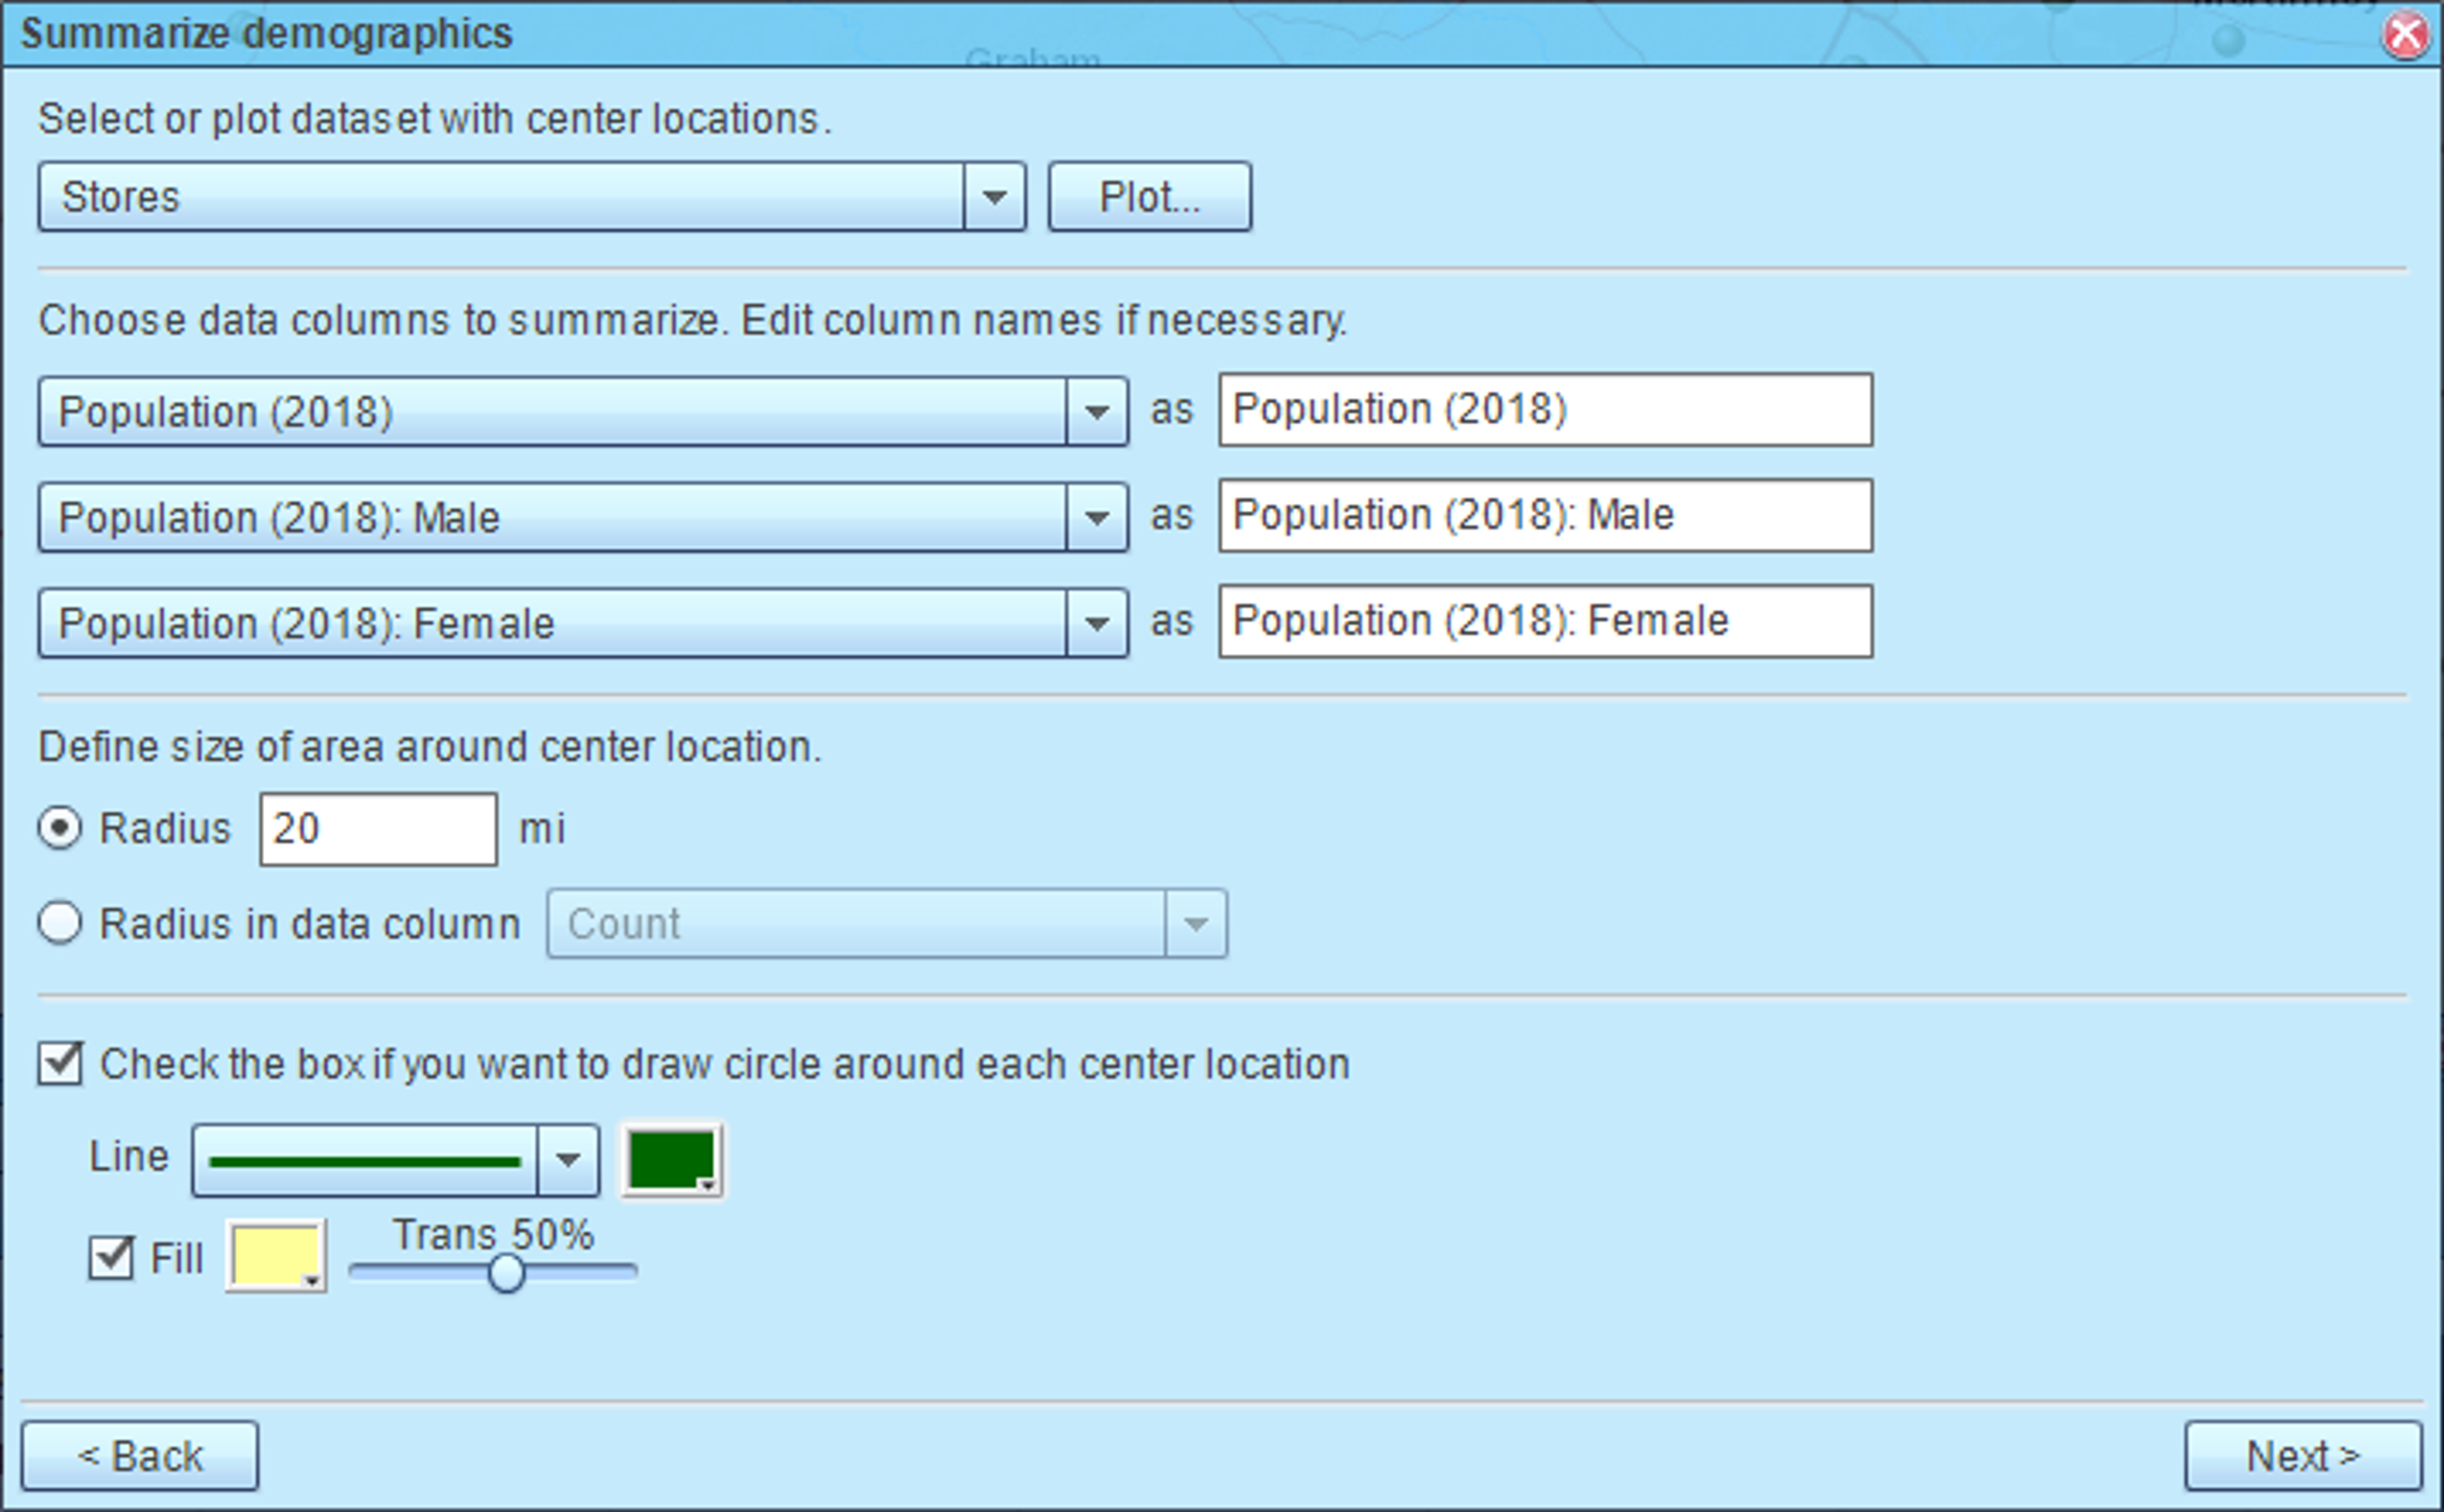
- On the next page select a dataset with center locations. You have the option to pick a dataset or a marketing list here. Choose data variables to summarize. The demographic data will be added to the selected dataset of center locations. You may change default names for the data columns. Set radius of a market area around each center location. You can set one radius for all centers or select a data column with a radius for each center location. In the example below we set 20 miles radius for all center locations. If you want a circle figure added to each search location on the map, check corresponding box and choose circle drawing options. Click Next button when ready.
- MapBusinessOnline will start processing demographic data. Upon summarization completion you will see the confirmation dialog. Click Done button to close it.
- MapBusinessOnline will open selected dataset in the Data window and will update the map to show circles added.