
Creating a basic local map, like a fifty-mile radius around a city, should not be a lot of work for any business mapping user whether you subscribe to Map Business Online or My Freakin Map’s Perfect.
In the real estate business, the usual online mapping programs for realtors don’t always cover every need. There may be a few expensive real estate mapping tools applied by large real estate conglomerates, but most one-off or small group realty firms require business mapping software they can afford and software they can figure out.
At $299.95 per user per year for the USA or Canada, I think Map Business Online has the price figured out. But what about building a wicked quick map of a specific area?
We recently got a call from a client who wanted a fast, real estate map. “Dude I just need a fifty-mile radius around a city with counties and major highways displayed.” Seemed simple enough to me.
To build that map as requested took me all of one minute. It’s a straight forward process from the Map Business Online new map start screen – keeping in mind that you do need an annual subscription to access the city limits and highway overlays, which are premium layers.
So, the first thing I’d did was key in my city of choice into the address bar – “Springfield, IL.” That zooms the map into the middle of Springfield, IL (the area of interest) and places a mini-tool bar on the map near my center point. I clicked the Radius Search button on that mini-toolbar and searched out 50 miles around my center point.
Once my circle was drawn on the map I pulled my Zoom View scroll bar in the upper right corner of the application back to see the entire 50-mile radius. I then turned on the County layer in Manage Map & Data and edited that layer, clicking the Edit Gear and choosing to make the counties 90% transparent and the county boundaries a thin red line (no pun intended.)
Next, I selected both the City Limits and a Highway layer from the Premium Layer or Add Map Layers button on the master toolbar. The highway layer didn’t require tweaking; it lays on top of the map background streets but adds the Interstate Highway Logo. I left the City Limit layer boundaries and fill untouched, but I did adjust City labels making the font larger and adjusting background color on the label.
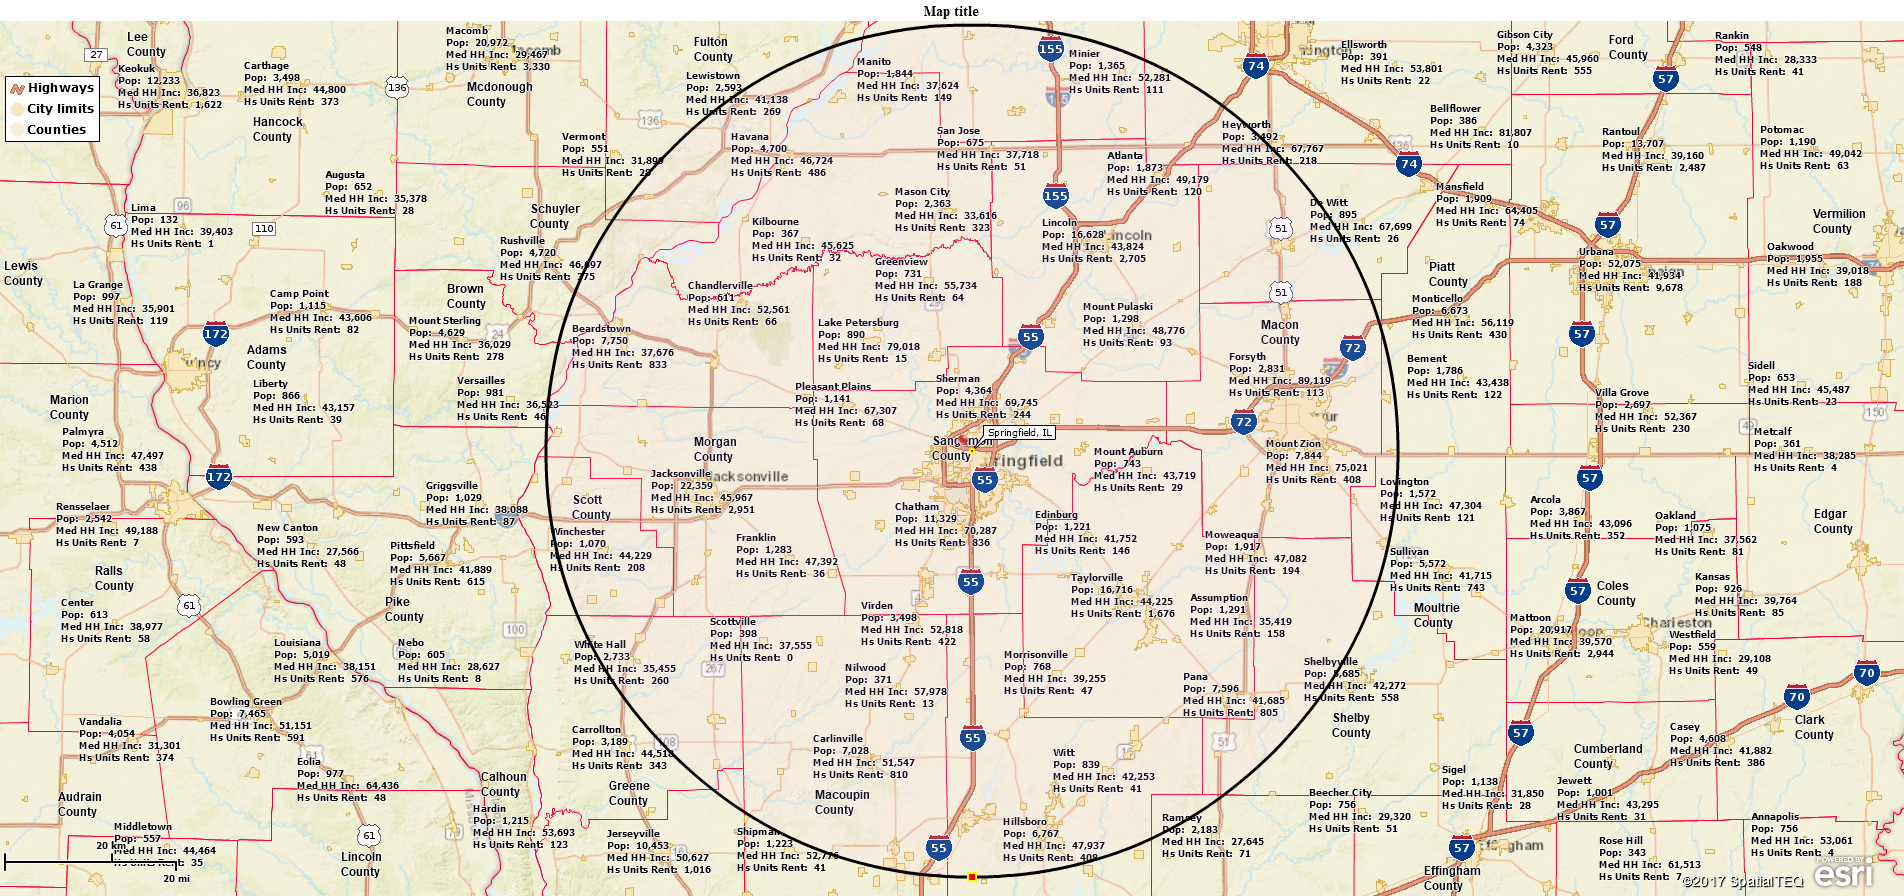
I figure a real estate business may want some extra information, like the surrounding demographics, visible on the map for quick reference. So, using Map & Data, I clicked the Edit Gear on my City Limit layer and chose Labels and Format Labels. Making sure the Auto Label tab was selected I:
- Choose Number 1 of the five flexible label fields to edit
- I selected Demographic Data as my data source
- I chose Population 2017 for my first additional label field
- I added a little explanatory text: “Pop:”
- I repeated the above process for two more of the five flexile label fields
- I then clicked Change Labels and viewed the results
Once I was done with labels, I viewed my map. This is an important stage in business map development. You’ve taken the time to build a map, now make sure it does what you expected it to. Ask yourself some critical mapping questions:
- Is the map too busy? Did I lose the emphasis on my original intent?
- Is there additional location information I could bring to bear on this map to make it more informative?
- Does the map background enhance or detract from my presentation?
- Are the colors I chose for map objects (the circle on this map) clearly displayed or do they blend in too much? Would more transparency help or hurt the map view?
- Is my zoom level of detail support the original business reason for the map?
You have many choices for sharing the map. Generate image files in PNG or JPEG formats for presentation graphics. Try a PDF map to print larger format maps or wall maps. Or share the map as an interactive web map. You could even use Map Business Online to present your map view.
Conducting a presentation while using Map Business Online is probably the coolest way to go, because you can emphasize layers and overlays by turning them on and off as you speak. Wowing everyone with your mapping skills as you emphasize your presentation point.
“In closing, shaded in red are the ZIP codes that show the most promise for our summer marketing campaign, based on disposable income and our key age demographics per ZIP code, and the number of two bedroom homes per city limit.” And the crowd goes wild.
NEW! Refer a business associate to Map Business Online in exchange for a $20 Amazon Gift Card!
Find out why over 25,000 business users log into www.MapBusinessOnline.com for their business mapping software and advanced sales territory mapping solution.
Contact: Geoffrey Ives geoffives@spatialteq.com or Jason Henderson jhenderson@spatialteq.com (800) 425-9035
MapPoint users please consider www.MapBusinessOnline.com as your MapPoint Replacement.
Please read customer reviews or review us at Capterra, G2Crowd (LinkedIn connected), or at the Salesforce.com AppExchange.