How To Generate Demographics by Radius
We often get requests for workflows that achieve specific business mapping results. One common request is to derive demographic data from a radius or circle around a point on a demographic map. In other words, here's an address; draw a 25-mile circle around it and tell me the population by radius map. The above describes demographic mapping by ZIP code.
Many clients seek to extract demographic reports from radius search results in their work. These Census-based population, age, or income categories add value to strategic planning, expansion planning, competitor mapping, and other business analysis. The ability to generate a population within a radius query by address makes MapBusinessOnline a demographic mapping software.
Learn More About Demographic Data Available in MapBusinessOnline.
Like a Circle in a Circle or a Wheel Within a Wheel
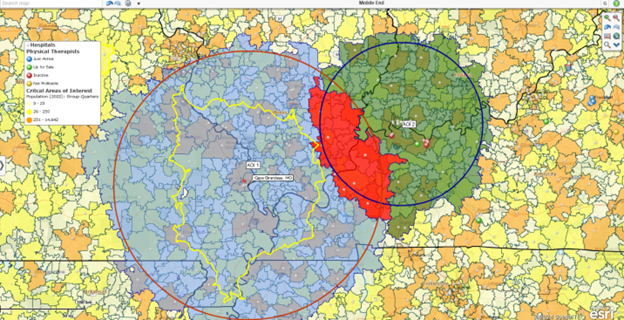
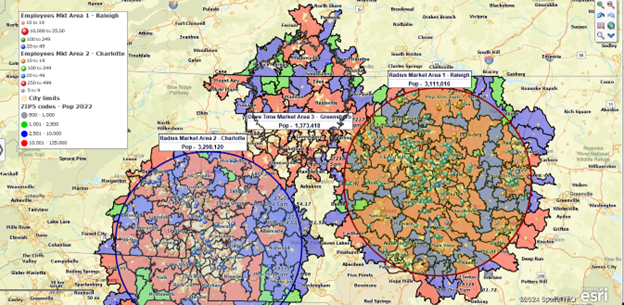
Circle or radius search parameters can vary greatly depending on the industry or business using MapBusinessOnline and the nature of the query. Some users zoom into the map, viewing circles just a few miles across. Others prefer a broader, more comprehensive view and could request a circle radius of 50 miles or more. And yes, for Thomas Crown enthusiasts, you can make multiple radius map circles.
Demographics by Radius Search
Demographic data requirements can vary as well. Most often, the population by radius is the sought-after demographic category. However, median income and household data inquiries are common, and many more categories are available within the tool’s growing US Census data library. Decennial Census data is compiled every ten years. The 2020 decennial count is available within the MapBusinessOnline data library. Interim Census Bureau ACS releases get uploaded a few months after release.
Demographic data is visually presented in MapBusinessOnline by map layer. Most often accessed by ZIP5 code, demographics are also derived by county, census tract, city limit, Congressional District, metropolitan statistical area, state, and ZIP3 code.
The demographic data search matches the drawn shape to all intersected and contained map layer segments and exports included data as a CSV file.
The MapBusinessOnline process for extracting demographics is:
- Under Search Tools, draw a circle or radius search shape and then select the desired map layer – usually, people choose ZIP codes. That area will approximate the circle or polygon based on the map layer boundaries. The resultant shape will include any area of the map layer touched by the drawn object. So, any ZIP codes the circle touches are used to generate demographic results.
- The object drawn on the map presents a menu of options. Select the Summarize option.
- Move up to ten of the desired demographic categories from Left to Right. Click Next.
- The application presents several options for data display and export. The user can add the data to the map view or export it as a CSV file.
Configure Search Area Extent
In MapBusinessOnline, the user can adjust the search area intersection rules in Map and Data. Click the Map and Data -> Map Options button. At the bottom, select Edit Search Options to change how your map object considers layer segment intersections - intersect 50%, intersect fully inside, or intersect.
The circle or radius draw tool is available at multiple places in the application:
- On the Master Toolbar under Search Tools
- On the mini toolbar at selected data points or from the list of draw tool options.
- Drive time queries are also available on the master toolbar and at the data point – see the mini-toolbar.
Let's create a quick ZIP code map. The map user should check on the ZIP code layer in Map & Data. Under Search Tools select a search option. Use your cursor to draw the search on the map. In this case, the spatial query will default to a search based on the ZIP code layer and immediately offer a Save-name option for that ZIP code area of interest or territory. You have just created – a ZIP code map.
Build Demographic Analysis
The Data Window is a tabular data view within MapBusinessOnline. The Data Window, with your area of interest on the map view, is where you can build analysis by clicking Choose Columns and grabbing the General data drop-down option on the left. The Data Window pops up to show you your list of Zip Codes, Counties, States, etc. Choose Demographic Data and go to town (or have fun, as the case may be). Population, households, and even ethnicity are added or removed from side to side in the panel. Then Set the Data Column values in the lower right. Refer to the video above for a step-by-step view of the process.
Business Listings
MapBusinessOnline's Master Toolbar includes a Yellow Pages Book button under Search. Search ZIP codes, City limits, counties, polygons, and radius objects for business listings. Great for sales prospecting and competitor maps. Read more about business listings.
Totally
Once you've assigned your demographic data to your area of interest or territory, you'll notice a Total button at the bottom of your Data Window view. The total tab will let you see the total population by territory. Use the Total tool to visually select an area of interest by circle or shape and fine-tune that area by adding additional zip codes to the territory thereby increasing the population. Your totals will show at the button of the view.
MapBusinessOnline demographic data analysis is exportable. Use the Export button at the far right of the Data Window toolbar to export data. Data is exported as a CSV file.
Conclusion
Business mapping software provides access to US Census demographic data to give the map users and viewers insights into the nature of their areas of interest. Creating demographic maps and analysis is easy to set up and helpful in establishing a comprehensive understanding of business realities.