How to Create Hierarchical Territories Using MapBusinessOnline?
Territories, regions, and divisions are geographic areas designed to enhance and organize the sales management process. These sales territory alignment areas highlight account responsibility, provide a platform for communicating strategic objectives, establishing sales accountability, and tracking progress against organizational goals.
MapBusinessOnline provides easy-to-use sales territory mapping software. Its sales territory creation process offers a choice between incremental cursor selection, polygon tool lassoing of areas, or a territory spreadsheet import process for creating new territories.
Easy territory editing tools let the territory builder quickly alter their ZIP code, county, or other map layer selections. Ex-MapPoint users will find MapBusinessOnline to be a vital, refreshing step forward in digital mapping and sales territory management while still providing a familiar map user interface.
Why Use Hierarchical Territories?
Hierarchical territories provide a structured approach to sales management. Many large organizations use a tiered sales territory hierarchy. Division managers oversee regions in this structure, while regional managers handle specific territories. Sales managers responsible for a region focus on the overall performance within that area and guide their team of territory managers to achieve regional sales goals.
Regional sales revenues and expenses aggregate into divisional totals. A division manager maintains a broad perspective, ensuring that regional managers have the necessary resources to meet their specific goals. This focus helps to align and achieve the overall company objectives for the year.
Creating Hierarchical Territories
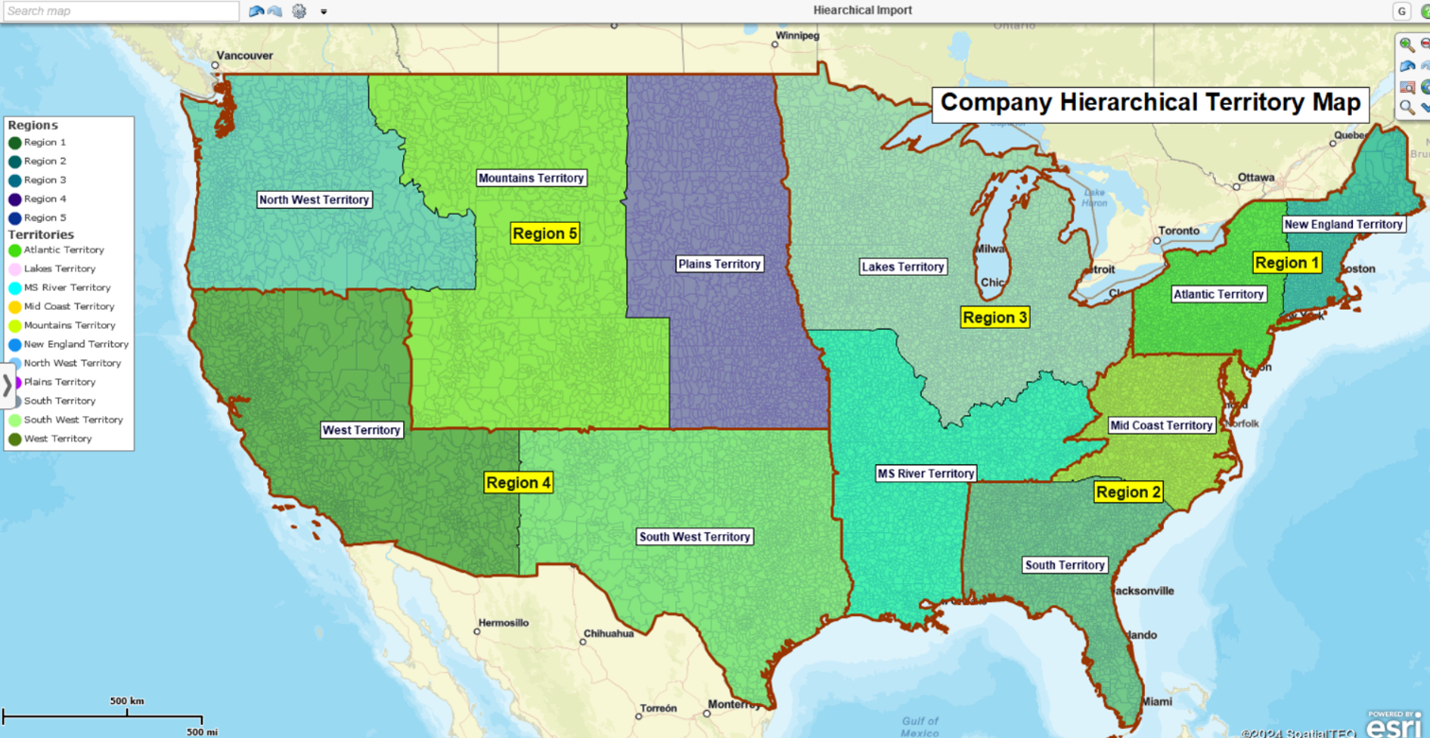
The thing to remember about developing territories, regions, and divisions is that they are built hierarchically - territories first, then regions, and then divisions. One builds upon the other.
1. Create Territories.
From Spreadsheets. Territories in MapBusinessOnline can be created from spreadsheets referencing ZIP codes, counties, state map layers, and a column for Territory Name. Other map layers, including Census tracts, Marketing Statistical Areas, and ZIP 3 areas, can also be applied.
Using Search Tools. Territories can also be constructed using polygon, circle, and freeform search tools to gather a series of ZIP codes, counties, or states into a territory.
From Drive-Time Areas. Territories can be defined based on drive-time analysis, allowing users to create zones that represent the time it takes to reach specific locations, ensuring that territories are practical for service delivery and customer access.
By Incremental Selection. Finally, a user can create territories incrementally by selecting one ZIP code or county at a time with the mouse cursor (hold down the shift key for multi-select.)
2. Create Regions.
Regions are created by merging multiple territories using a polygon, circle, and freeform search tools. Once you have chosen your target group, finish the search and name the region. Do this for all your regions. When all territories have been assigned to a region, your region layer is complete.
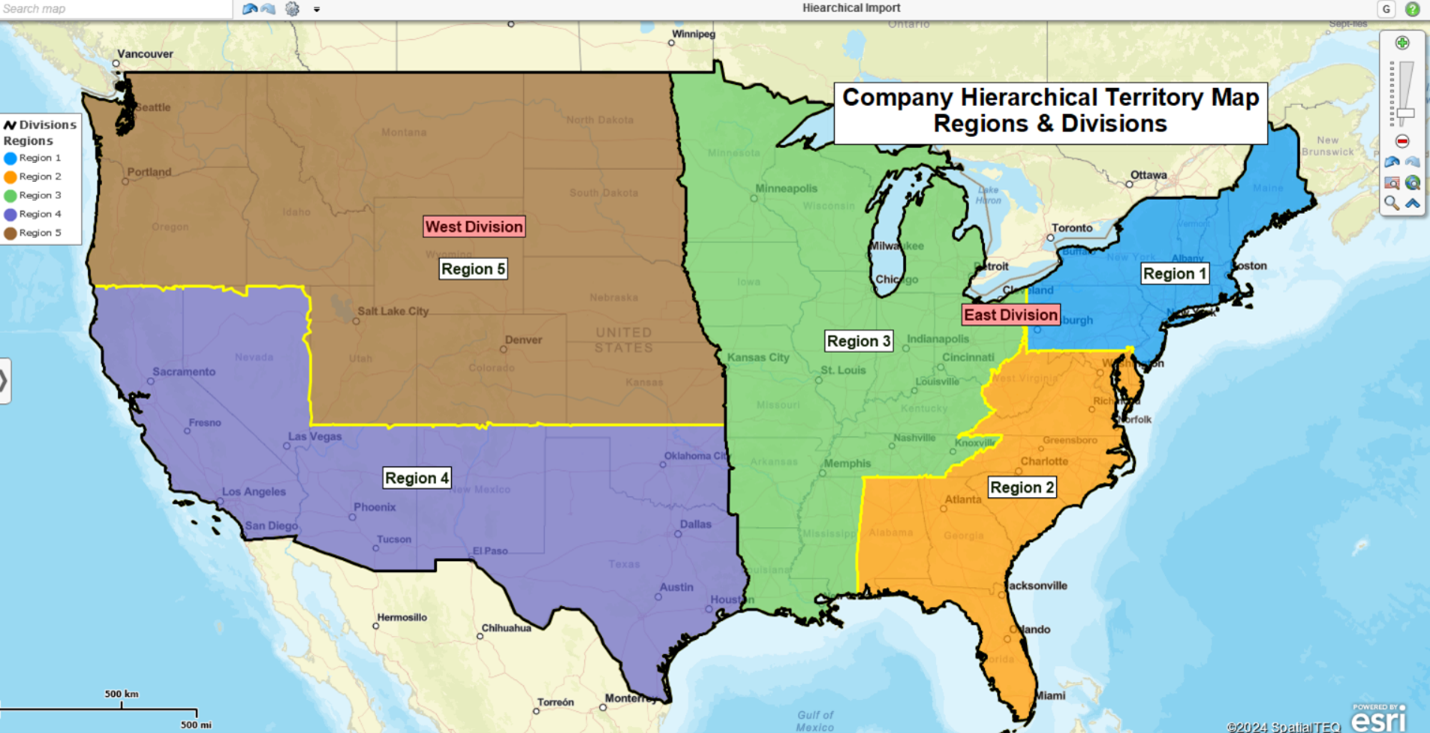
3. Create Divisions.
Divisions are the final step – a division is created similarly to the regions. The only difference for division creation is that the search tools select regions instead of territories. For the record, territory, region, and division terminology can be changed to zone or other area designations as required.
Importing Hierarchical Territories from Spreadsheets
Hierarchical Territories, complete with Regions and Divisions, can be generated by map creators through spreadsheet import. The process works like this:
- Create a hierarchical territory import spreadsheet with columns for Territory, Region, and Division Names.
- Process the hierarchical territory spreadsheet through the MapBusinessOnline Import Territories button on the Master Toolbar.
- Follow the import territories dialog and select the Create Territories – Alignment Options. Adjust as necessary and click Done.
Adjusting Your Territory Map's Look and Feel
Use the Edit Map Layer Properties function in the Map & Data window to edit the look and feel of the various map layers. These editing tools help users create exactly the map view their map audience needs to see.
To access these map adjustment tools, hover your mouse cursor over the Territory Map Layer and click the Edit Map Layer Properties Button. A panel opens up and displays various tools that support territory map editing. Within the Map & Data layer tools, you will find tools to:
- Adjust the thickness and color of territory map boundaries.
- Adjust the color fill of the territory areas. The Transparency Scroll Bar is critical to territory, region, and division management. Transparency controls allow your viewers to see all hierarchical layers at once if you desire it.
- Choose to Hide Internal Boundaries (like ZIP code areas) in your territory map. You could choose to leave base layers visible if they are essential to your map audience.
- Choose to color code the territory map based on demographic data or a numeric element, such as sales results included with your imported data.
Edit Map Layer Properties also allows the map creator to enable and display areas of territory overlap. Users typically highlight the overlap with a specific color choice, like bright red. Here, in the Intersections tab, the user can choose an appropriate map background - or none at all.
All of these tools impact the way your map looks. This means you must decide what look and feel best supports your business's territory map requirements. But in general:
- Avoid obnoxious colors.
- Keep boundaries dark and not too thick.
- Make any text concise and keep it pertinent to your map's intent.
- Avoid map clutter – too many data layers can be overbearing.
- Try a variety of color schemes and select the most appropriate.
- Ask a colleague for their perspective.
Import and Display Business Data
A critical aspect of sales territory maps is aggregating sales data by segment and displaying the difference between regions and divisions. Customer data imported by customer address could include a column for total sales by account. These sales records, or points on the map, can be easily aggregated into labels using MapBusinessOnline, displaying sales totals by territory, region, and division.
MapBusinessOnline labeling tools are in Map & Data. Click Edit Map Layer Properties for the territory layer and choose the Label Tab. Here, you can fill five flexible fields under each territory or region label with your most critical data totals. You could also fill these fields with demographic data (included with your subscription).
The above-described sales territory mapping tools provide various visual options to help your sales managers establish, monitor, and update sales progress against territory, region, or division goals. Use MapBusinessOnline tools to share progress with your sales team or present results to the management team.