How to Create a ZIP Code Heat Map
Up here in New England, it's getting hot outside. What better time than during a heatwave to discuss heat mapping? After all, heat maps are excellent tools for exposing activity that's heating up.
Heat maps describe business or human activity by color-shading data values related to specific locations or areas. A heat map depicts the concentration of sales activity by address, like a weather map describes the intensity of thunderstorm activity.
MapBusinessOnline includes a Heat Map option under the Color-coding section of the Master Toolbar. This button creates color-intensified areas across a business map based on the numeric values of imported location data points. Heat maps are terrific for showing sales intensity by account or salesperson—a great addition to a sales territory or planning map.
The MapBusinessOnline Heat Map button does not display the intensity of data by ZIP code area. Use the Color-coding toolbar button labeled Boundary to create ZIP code heat maps that depict intensity by ZIP code areas.
There are actually two different types of heat maps:
- Heat maps that reflect data intensity by location points - like the heat map button in MapBusinessOnline or
- Heat maps that reflect data intensity by areas such as grouped ZIP codes or Counties.
Your boss or associate may expect their requested heat map to show either point-based or ZIP code-based heat mapping. Please make sure you get clear on their requirements.
Steps to Create a Point-Based Heat Map
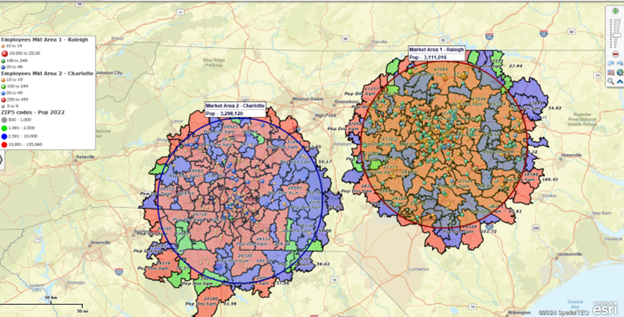
A ZIP code heat map links a set of location data points to a group of ZIP codes. The ZIP codes are color-coded based on the numeric value of the data the map creator has decided to highlight. The map below reflects imported location data showing sales records for key business accounts across the northeastern US.
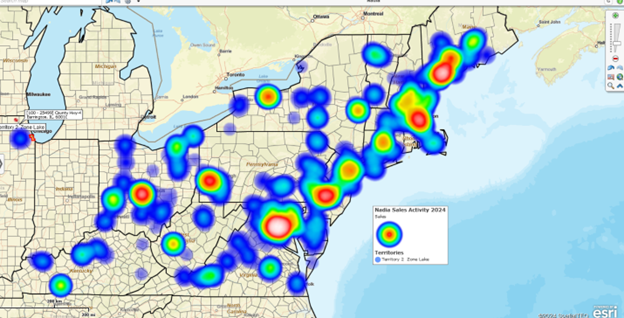
The term heat map is applied because these maps display data intensity and use colors toward the red or hotter side of the color spectrum. These business heat maps use redder colors to reflect more intense, or hotter, concentrations of the imported numeric data.
Steps to Create an Area-based Heat Map by ZIP Code
MapBusinessOnline users can also generate heat maps by area, as opposed to points. These area-based heat maps are generated from the same location data as point-based heat maps.
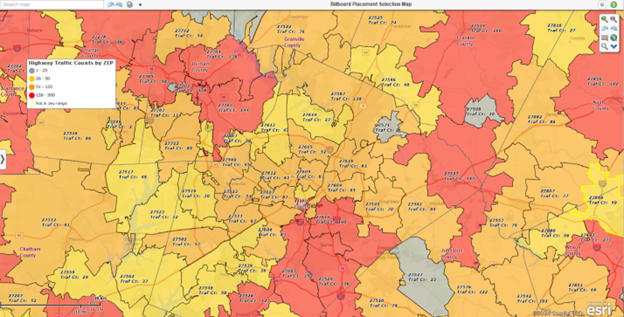
MapBusinessOnline area-based heat map generation options include city limit, county, state, or Census tract map layers. ZIP 5 codes are the most popular area map layer used for heat mapping because they are relatively small and familiar to US citizens. ZIP codes can be color-shaded by the user to reflect local or national data values. MapBusinessOnline also includes ZIP 3 codes, Metropolitan Statistical Areas, and even Congressional Districts, all available for area-based heat mapping.
Below are the directions for generating a MapBusinessOnline area-based Heat Map using your location data:
- Import the location data you'd like to display as a Heat Map – Under Adding to Map on the Master Toolbar, click on Datasets.
- With your location data displayed on the map, select the Heat Map option under Color-Coding. Choose your target imported data and a numeric data column for Heat Mapping.
- Click the Color-Coding Boundaries button on the Master Toolbar – 3 Puzzle Piece Icon.
- Select the map layer you want to Heat Map – in this case, ZIP codes.
- Select your target imported dataset.
- Select your numeric value column.
Below are the instructions for color-shading heat maps ZIP codes:
- Under Color Coding on the Master Toolbar, select the Boundary button.
- Choose the ZIP code map layer and then Next.
- Within the Color-code Map dialog, select the Number of Color Code Groups. You have a range of 2 to 100 groups. The color options are noted below the groups.
- In general, keep the groups at 2 to 5 in quantity. Fewer groups maintain a less chaotic map. Too many color options make the map difficult for the user to understand.
- Apply colors for Heat Maps with a gradation scheme – cold to hot, low to high.
- Preselected graduated color schemes are listed at the bottom of the Range/Color tools. These color arrangements are easy to read and apply.
- Click Done.
- Review the map and your ZIP code color scheme. Make sure your map intent is achieved. It's easy to rerun the Color-Code Map process and adjust.
That's how ZIP code heat maps work in MapBusinessOnline. Compare it to our traditional heat mapping approach outlined below, which you might like better.
- Click the Heat Map button within the Color-Code Map section of the Master Toolbar.
- Select your target imported data layer. Click next.
- Choose a color scheme and a heat radius that controls the intensity.
- Select which column in your data contains the numeric data to be heat-mapped.
- Finally, choose Preview or Done.
Once your heat map with ZIP codes is displayed, reviewing the dialog and adjusting settings is easy. Click Done and see how it looks.
Alternatives to heat mapping include color-coding a point layer. To do this, use the Symbols button under Color Coding. Read more about color-coding options here.
So, go forth and Heat Map. But, as always, keep your heat maps uncomplicated and easy on the eyes, or your heat mapping experience may not be so hot.