
Being new to business mapping is never be an obstacle to creating your first business map. View the challenge of mapping as an opportunity to learn something new like paddle boarding or Zoom meetings. We’ll help you through the first steps so you’ll be on your way. For most users, MapBusinessOnline is an easy territory map and a wicked easy radius map.
The MapBusinessOnline platform or dashboard includes three major map control sections that enable map creation and later map optimization:
The Master Toolbar – A ribbon of 23 buttons that you will find stretches across the top of the mapping platform. The Master Toolbar includes the New Map button, a Save button, an Open button to retrieve saved maps, a Print button, and all sorts of map options. Read about the Master Toolbar.
The Map & Data Box – Map and Data is a light blue box that floats over the map and contains a CheckBox list of all the map layers, like ZIP codes and States. Map and Data also controls any datasets you’ve imported, as well as the Map Background options. Hover over any layer or dataset with your mouse cursor and click the Edit Gear to tweak the look and feel of a map layer. Read more about Map and Data.
The Data Window – The third button in from the left on the Master Toolbar is the Data Window. It opens up a world of easy-to-use Database Management. On the left side of the Data Window, notice the dropdown option. This dropdown provides access to any map layer or imported dataset. Drop down to a layer and view the data or manipulate the data for your business map’s benefit. Read more about the Data Window.
At the bottom of this blog, I’ve listed some additional links to blogs that describe basic processes for map construction for first-timers. Each link in this blog will contain written instructions and videos that can help you navigate your first few business maps.
Five Basic Steps to a Business Map
- Register and download the Map App – MapBusinessOnline is a cloud-based service. You will access the tool by logging in with your email and a password. The Map App is a simple, quick download that includes a button for launching MapBusinessOnline either from the Windows Start menu or from the Mac applications folder. You can create a Task Bar button for launching MapBusinessOnline from the Map App.
- Create a New Map – With MapBusinessOnline launched, use the map template presented by the application or Click the New button on the left of the Master Toolbar along the top of the application to start a new map. Choose your map template, usually the USA, and view your base map within MapBusinessOnline
- Use the Map and Data Box to turn on the ZIP code layer or Postal layer for Canada maps. Edit the layer to adjust the fill transparency and boundary lines by hovering your cursor over the layer and clicking the Edit Gear. Turn county and state layers on and off as necessary and edit those layers in the same way as ZIP codes. By turning these layers on and off, adjusting boundaries, fill-color, and transparencies, you have optimized your map visualization. Think about your map audience as you do this – How can you optimize your map viewer’s experience?
- Import an address-based dataset of your business customers or clients and thereby creating a basic Map Visualization of your business data. This process is initiated from the Dataset button un Add to Map on the Master Toolbar. There’s a dialogue included in the process to help you import your business data:
- Import a list of ZIP codes with additional columns for sales or other data – Create a ZIP Code Map
- Import a list of address points or LAT/LONG coordinates and Create Radius objects around each point – Import an Excel Sheet
- Color-code your imported dataset – To represent numeric values or text records in your data, click the Symbol Color Coding button on the Master Toolbar and select your data. Assign symbols, colors, sizes to your critical data column. Import your customer symbols through the options listed at the top of the Color Code dialogue
- Save your map as a My Map or as a My Template. With your map started and gaining form be sure to save it using the Save Button on the left side of the Master Toolbar. I often recommend saving maps in the MY Map Templates option of the Save dialogue. A template is useful because it protects the map work you’ve already invested. Open up new maps from your base map Template to address various business issues. Intrigued? You should be. Read more about Map Templates.
These five simple steps outlined above will help you to create your first Business Map. Most first-time MapBusinessOnline users follow a similar process with their first business map – what we often refer to as a Map Visualization.
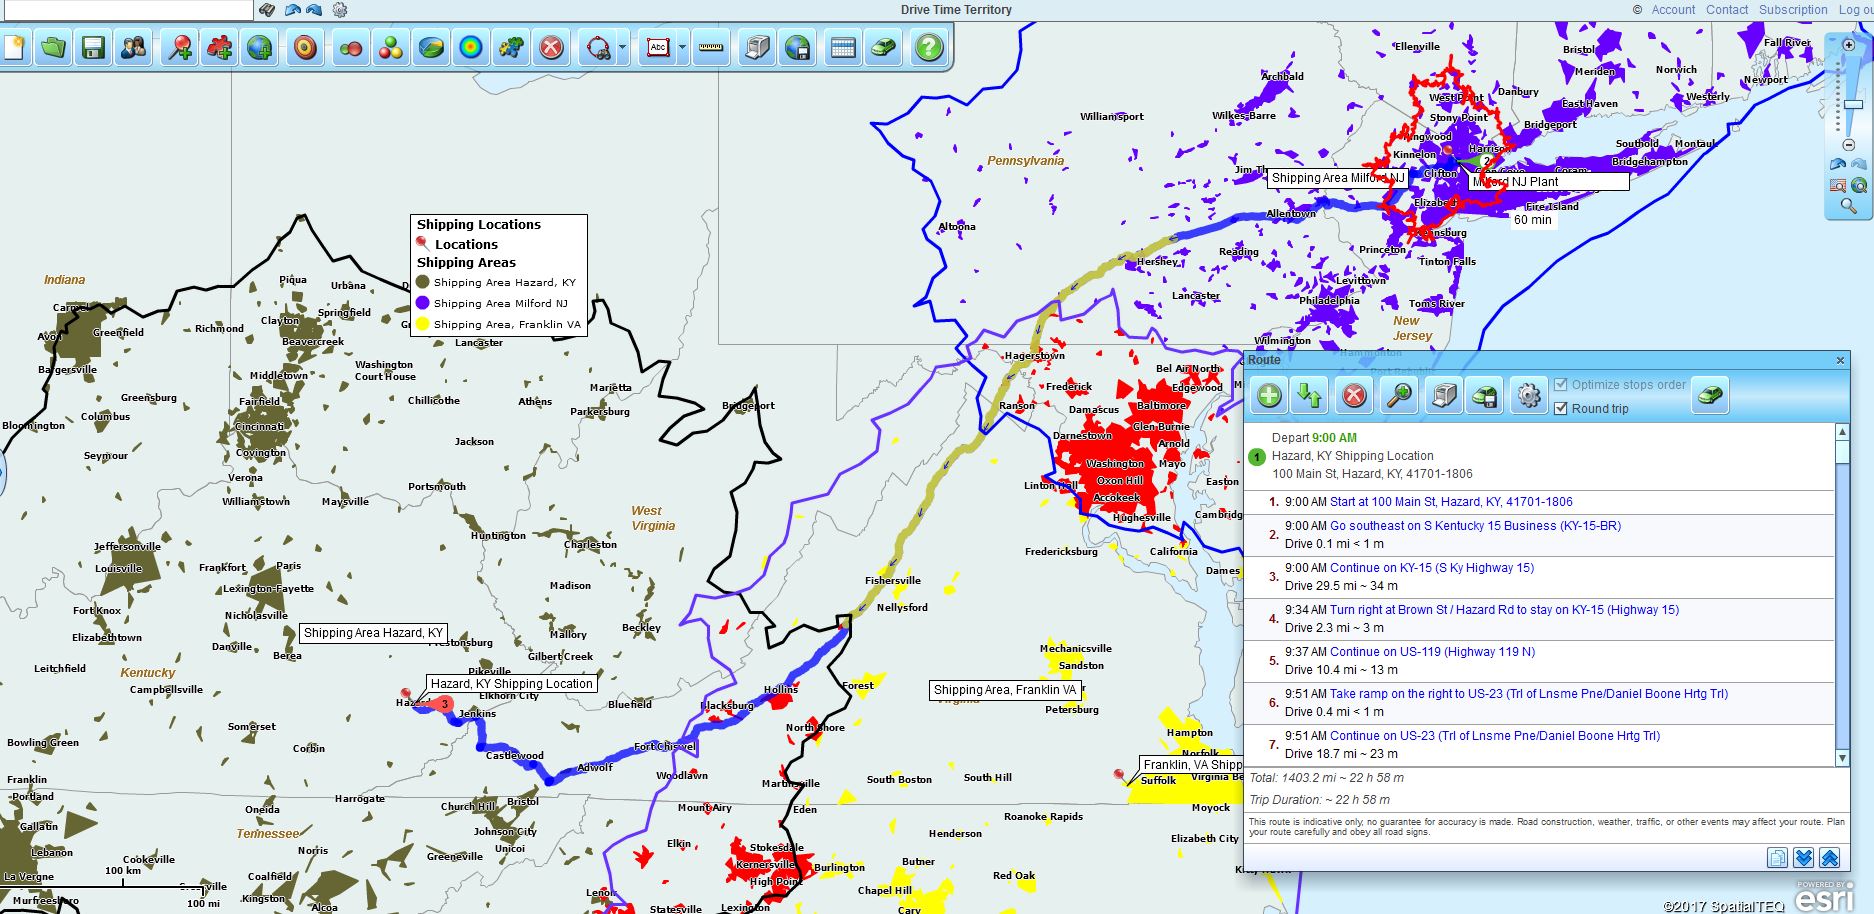
Using Drive Time Visualizations to Analyze Shipping Patterns
Now Add Value to Your Map
Below are multiple business map options you can add to your new business map to significantly increase its value:
- Color-code the map layer areas based on imported numeric data values. Use the Boundaries button on the Master Toolbar to select your imported data and assign colors and ranges based on your data column. Read about Color-Coding map layers.
- Create a Heat Map – Heat maps use numeric values in your imported data to display location data intensity. Click the Heat Map Button on the Master Toolbar. Select the target numeric value column in your imported dataset. Adjust color and intensity scroll bars as required. Read about Heat Mapping.
- Create a Territory with the Search Tool – Polygon Search – Select a group of ZIP Codes and save them as a territory. Adjust as necessary by selecting more ZIP codes with your cursor and the shift key. Here’s a blog about Where to Start with Sales Territories. Read more about Editing Territory Maps. Read all about creating Sales Territories in this deep dive blog.
- Create a Territory from an Excel Sheet – Import a spreadsheet of territory information data, such as ZIP codes and Territory Name. Use the Add to Map Territories button on the Master Toolbar. Here’s a video describing Importing Territories.
- Optimize Your Map – Use the map adjustment tools in Map and Data to optimize your business map and make it speak clearly to your map audience. Read about map optimization.
- Use the Summary button associated with Map Objects, like ZIP codes or polygons, to access Demographic Data for your business analysis. Or access demographic data through the analysis panel of any Territory view in the Data Window. Just click the Choose Columns button in the lower right.
Additional recommended reading:
- A Word About ZIP Codes – A blog about ZIP code options in MapBusinessOnline
- Ten Tips for New Users to MapBusinessOnline – Helpful hints for newbies
- Adjusting Your Sales Territory Map in MapBusinessOnline
- Arranging Labels on your MapBusinessOnline business map
- How to access Demographic Data in MapBusinessOnline
The MapBusinessOnline blog is searchable, as are the Help Docs and the YouTube help videos. Pretty much every subject we know of is covered in these self-help tools. But we’re also available through Chat, Email, and over the Phone.
There’s just no reason why you can’t create your business map today! Unless the power is out or there’s a global pandemic, or wildfires, or murder hornets, or something.
We recommend users access MapBusinessOnline via the downloadable Map App.
The Map App install is fast and easy. The Map App is a cloud-based service, once you’ve logged in you’ll have access to all of your previously saved maps and data. The Map App is a better user experience and provides access to more features than the Web App. The Flash-based Web App link will remain available until December 15, 2020.
The Map App includes the new Map Viewer app for free non-subscriber map sharing.
Win a $20 Gift Card! Refer a business associate to Map Business Online in exchange for a $20 Amazon Gift Card!
Find out why over 25,000 business users log into www.MapBusinessOnline.com for their business mapping software and advanced sales territory mapping solution. Read what our customers have to say about MapBusinessOnline on one of our review sites. Capterra.com and ShopperApproved.com The best replacement for Microsoft MapPoint happens to be the most affordable.
Contact: Geoffrey Ives geoffives@spatialteq.com or Jason Henderson jhenderson@spatialteq.com