Expansion Planning Using Heat Maps
Problem: Need to Transform New Product Success into New Market Opportunities
ABC Furniture manufacturing manufactures and distributes furniture through show rooms across the Eastern USA. The ABC reclining chair profits have proved to be significant and the company is interested in developing the market further. The best way to accomplish this is to either build showrooms or partner with showrooms in underserved areas.
Solution: Visualize Sales with MBO Heat Map - Find ZIP Codes for Growth
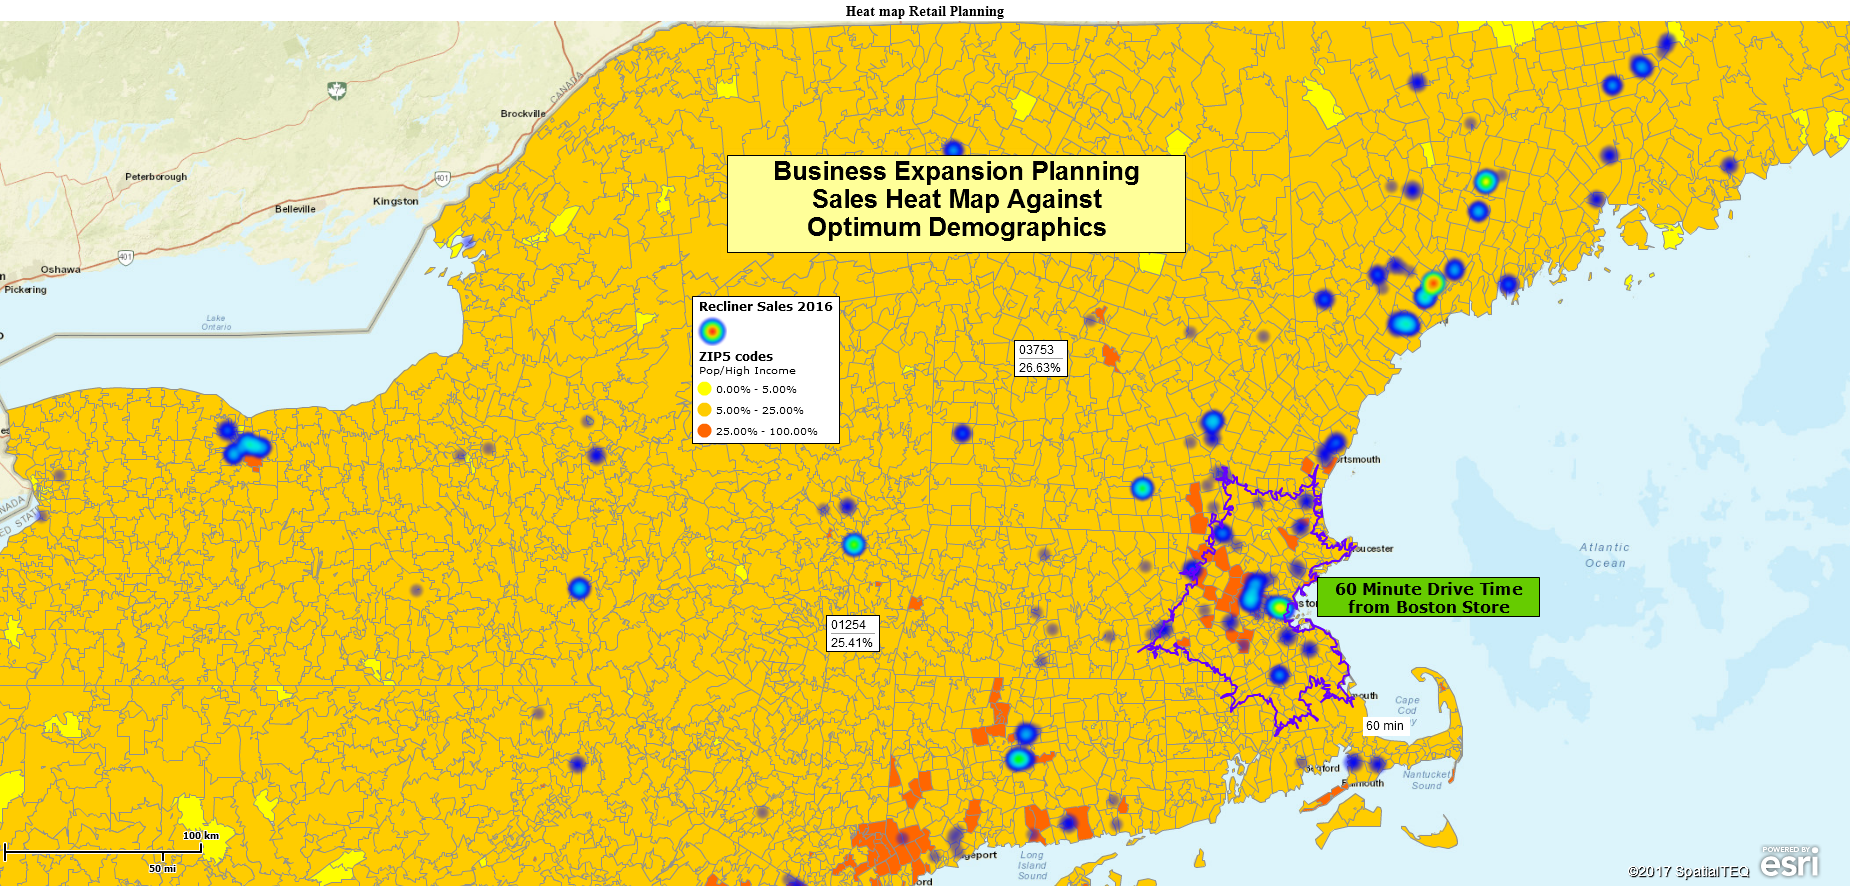
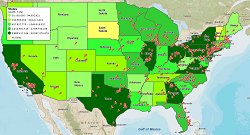
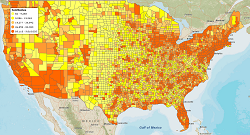
ABC uses MapBusinessOnline to graphically display where sales most often occur, and by omission, where they do not occur at all. The MBO ZIP code layer is turned on and color coded to reflect ZIP codes with the highest Median Income per Population, a ratio calculation. These rust red colored ZIP codes should be the best target areas for growth.
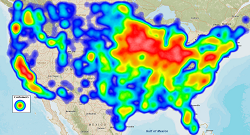
Next, a dataset of 2016 recliner sales by outlet address is imported into MBO and turned into a Heat Map layer. The brighter blue hot spots reflect areas of intense sales, the cooler darker spots show less sales, and again by omission, reflect areas with no sales that are under consideration for better representation.
How to Create a Retail Sales Heat Map
- Make sure your data records have at least two columns. One column for location and a second column with numeric data describing your subject – in this case, sales of recliners
- Import your location or address based dataset into MapBusinessOnline
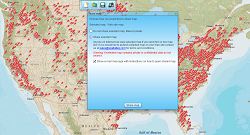
- Click the Heat Map Button on the Master Toolbar

- Select your target data set and make sure the numeric data column is selected
- Choose an appropriate color scheme and an intensity setting
- Process your heat map
To display the heat map against a demographic scheme:
- Turn on the ZIP code layer
- In Map & Data, hover over the ZIP code layer and click the Edit Gear. Choose Manage Calculated Data Columns. Add a Data Column, name it, and pick the operation parameters – Overall Population/High Med Income
- Use the Color Code Map button, accessing your Calculated Data option (from 2) and color code ZIP codes to best reflect your target market
Your best ZIP codes for new showrooms supporting new sales opportunities will be ZIP codes with optimum demographics and no sales activity, and nearby ZIP codes with optimum demographics close to areas with maximum sales activity, perhaps within a specific drive time distance of existing stores – for example an hour’s drive away.
Learn How Our Customers are Succeeding with MapBusinessOnline
"I just wanted to say thank you for this amazing mapping tool! I've tried a number of sales territory map solutions and this is by far the best. I just (finally!) switched over from MapPoint and this is so much better, I wish I had switched sooner. Your videos and blog are also really helpful, though most things I have figured out on my own. It looks like I also have a lot more to discover as I explore the data visualization tools. Thanks again!"
Andrea Harrison
Business Analyst
Brainlab, Inc.
"In a large company, with many layers of sales teams, sales management, territories, operations teams and distribution, it is vital to have a solution to quickly and easily display country and regional maps. I have tried multiple other mapping solutions in the past only to be frustrated by their limitations or by their complexity. MapBusinessOnline perfectly fits my need. MBO has the versatility to allow me to build somewhat complicated maps but also allows me to knock out the quick, one-off request. MBO continues to add features and I am excited to see what new features come out next."
Dave Perek
Sr Business Analyst
Schneider Electric

This leading North American reseller of hardware and software supports millions of businesses worldwide. We get regular calls from SHI representatives who need to offer a MapPoint replacement or to simply provide business mapping software for a corporate or government account. SHI customers include users of annual subscriptions for the USA and Canada as well as collaborative Team Editing subscriptions for corporate accounts.
Software House International (SHI)

Popular MapBusinessOnline features
Emphasize customers density with heat maps
Color code maps by ZIP code, county, or state
Display business data against demographic maps
Share business maps