Create Fast & Captivating Heat Maps

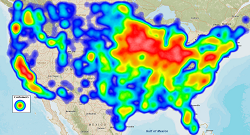
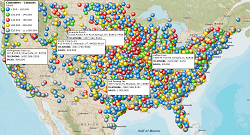
A heat map is a map-based visualization of numeric data that highlights the relative intensity of the selected data through color shadings. Heat maps are like weather maps, they provide an instant visualization of risk, opportunity, and stagnation for the map viewer. MapBusinessOnline makes it easy to create heat maps online from both imported point data or as colored data themes applied to ZIP codes, counties, states, Census Tracts and other geographies.
Point-based Business Heat Maps are applied to a variety of industries:
- Sales Organizations use heat maps to show increasing or decreasing intensities in location data. Sales activity can be reflected by heat mapping. Sales managers can easily share information about where sales are occurring; where business is growing or declining by displaying the data as a heat map.
- Law Enforcement agency heat maps access crime statistics for presentation as a heat map. Law enforcement maps often show statistical crime data in the form of a heat map intensities to define where illegal activity is concentrated. Heat maps transform relatively boring numeric data into colorful maps inspiring audiences into action.
- Healthcare Analysts portray disease epidemics as heat maps. These medical maps are used to track the progress of an outbreak and the effectiveness of mitigation efforts. Medical heat maps provide instant visualizations of areas at the highest risk of disease spread.
With MapBusinessOnline, Heat Maps are created from user data. Imported spreadsheets will contain separate columns for address information, and a specific column for heat mapping in Excel or other spreadsheet file formats. The MBO Heat Map button lets you choose your data and heat map column, as well as color intensity and shade.
| Address | City | State | Zip Code | Sales Activity Q1 |
| 101 School St | Morganton | IL | 47301 | $24,989 |
| 56 Bourbon St | Borlynn | OH | 34789 | $55,300 |
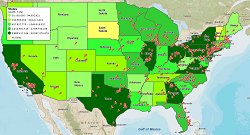
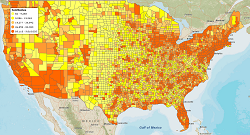
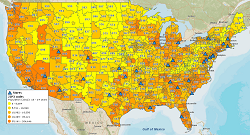
Another type of heat mapping is color shading (color coding) geographic districts like ZIP codes or counties. In MapBusinessOnline imported point data or demographic data can be used to color code administrative districts. Color gradations for geographic districts can be based on imported address-based data or demographic data within heat mapping software.
Heat Mapping by geographic area (color shading) has many business applications:
- New Retail Store Location Planning - Retail market analysts often color shade a list of ZIP codes by Census Bureau population statistics. More populated areas or areas with higher income levels can be color shaded with deeper shades. The most cost-effective construction locations can then be overlaid.
- Insurance Underwriters import claims data by address and compile ZIP code heat maps based on risk assessments. Higher risk ZIP codes can be color coded in progressively brighter colors.
- Real Estate Developers use heat color coded heat maps to delineate address-based housing assets by value against a background of Census tract or ZIP code neighborhoods color coded by income levels. For good or for bad, house flipping plans are generally designed around these heat map views of both point data and administrative district geographies.
See MapBusinessOnline in Action
Request a demo
- Create heat map
- Color code map by ZIP codes, counties, or states
- Color code dataset locations on map
- More...
Learn How Our Customers are Succeeding with MapBusinessOnline

This leading national footwear brand manufacturer uses MapBusinessOnline to conduct retail coverage assessments nationwide. They loved MBO’s ability to provide both street level detail and USA wide high level views of points-of-sale. Importing location enabled address databases for symbolization and color shading is easy. New and planned stores can be added to the map market analysis as products are launched and mature.
"Importing location enabled address databases for symbolization and color shading is easy."
Todd Eichelberger
Sales Director
Adidas

"Very satisfied and happy with the program! Our organization was a little nervous when we found out we had to replace MapPoint. Once we came across MapBusinessOnline, we knew we had found the program for us. Not only are there many features for the map creators, there are also a lot of usable features for the individuals that receive the view-only shared maps. This is a great program and with the way our organization is changing, I have no concern about recommending it to other internal departments."
Business Manager
I-Car

"MapBusinessOnline one of the most powerful tools I have as a Regional Channel Manager. It’s a difficult task to visually represent the vast amount of data that I have to present to my customers and team members. MBO makes it easy to represent, configure, and manipulate the data on to an effective map. A picture is worth a thousand words, and MBO allows me to create a perfect picture."
Ed Ku
Regional Channel Manager
ABB
Popular MapBusinessOnline features
Emphasize customers density with heat maps
Color code maps by ZIP code, county, or state
Display business data against demographic maps
Build fast map visualizations of your business data
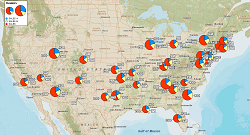
Illustrate business data on map with charts
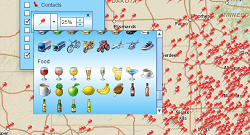
Visualize business data on map with various symbols
Add a variety of layers and data to map
Print large format map views
Share business maps