Visualizing Your Sales Pipeline

A sales pipeline is a simple, graphic overview of where your sales are, and where you can expect them to be at the end of a given period. Used properly, it is both an at-a-glance snapshot of current opportunities and a predictive tool that can help you move forward effectively.
Like all sales tools, a pipeline is only as good as the data that’s being fed into it. Useful analysis requires looking beyond the bottom line at a range of different factors, including geographic and demographic realities for each of your sales territories.
That’s where MapBusinessOnline comes in. MapBusinessOnline is a cloud-based data-mapping platform that can be used to develop more accurate sales pipeline visualizations based on your business data.
How It Works
Sales pipeline mapping with MapBusinessOnline is easy and affordable. Import business data from your normal management system and view it against accurate, up-to-date maps with demographic information, adding vital context that shows you where your team is most effective and where additional resources are necessary to meet and exceed your desired quotas.
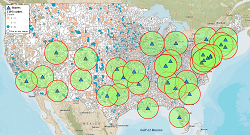
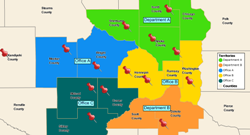
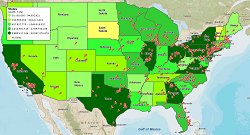
From there, MapBusinessOnline lets you create custom sales territories that ensure your staff is evenly distributed and positioned where they will have the most impact. Map Business Online even lets you share data among team members, leading to improved collaboration and ultimately more sales.
Other MapBusinessOnline features for your salesforce include:
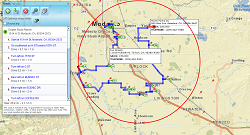
- Optimizing routes to make sales calls more economical and productive
- Performing in-depth market analyses that drill down on specific territories – remember: geographic sales territories drive accountability into your sales force
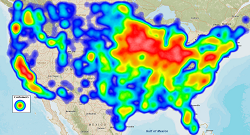
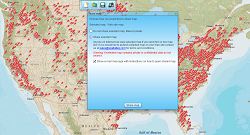
- Creating sales heat maps that show where you’ve had the most success and where you could improve
- Planning for the future by identifying underserved communities near you
Working with MapBusinessOnline is easy and intuitive – the cloud-based platform integrates easily with Salesforce, QuickBooks and other software, allowing you to seamlessly share your most recent data between applications.
Why MapBusinessOnline?
There are clear benefits to visualizing any sales pipeline with MapBusinessOnline. As a graphic tool, it brings to light demographic insights that are easy to miss when looking exclusively at raw data. MapBusinessOnline shows you where your team is and where it needs to be. It also shows you who your current customers are and where the best future prospects might be hiding. When you visualize this information, you can make informed decisions and allocate resources in a more strategic manner.
To learn more about the benefits of using MapBusinessOnline for visualizing your sales pipeline, keep browsing our website. You can also contact the MBO team directly to request a free 1-month trial. Get in touch and get started today!
Learn How Our Customers are Succeeding with MapBusinessOnline
"MapBusinessOnline Business Listings has been my go-to platform for the preliminary work necessary to develop growth strategies in the Restaurant Industry. I’ve found this platform to be intuitive, easy to navigate, and the data plentiful. Whether you are looking to expand using an adjacency strategy or make a large geographical leap, I’d suggest you start with MapBusinessOnline Business Listings."
Paul G. Tuennerman
Executive Vice-President
Sticky’s Holdings, LLC
"I had an excellent experience with MapBusinessOnline because my company works in the agriculture industry and makes maps showing where our fields are and these maps need to be viewed and shared in a database. Your product seemed to fit our needs. Overall good support, ease of use, and quality of maps created!"
Seneca Foods

"I just wanted to say thank you for this amazing mapping tool! I've tried a number of sales territory map solutions and this is by far the best. I just (finally!) switched over from MapPoint and this is so much better, I wish I had switched sooner. Your videos and blog are also really helpful, though most things I have figured out on my own. It looks like I also have a lot more to discover as I explore the data visualization tools. Thanks again!"
Andrea Harrison
Business Analyst
Brainlab, Inc.
Popular MapBusinessOnline features
Build fast map visualizations of your business data
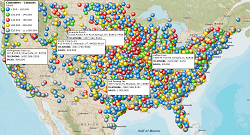
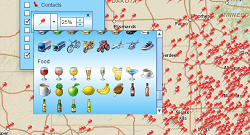
Visualize business data on map with various symbols
Design and visualize sales territories
Emphasize customers density with heat maps
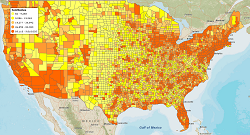
Color code maps by ZIP code, county, or state
Display business data against demographic maps
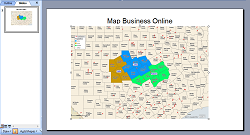
Create powerful reports and presentations with maps
Share business maps
Plan customers visits with optimized routing
Perform Market Analysis for multiple sites