Exciting Ways to Visualize Excel Data with MapBusinessOnline
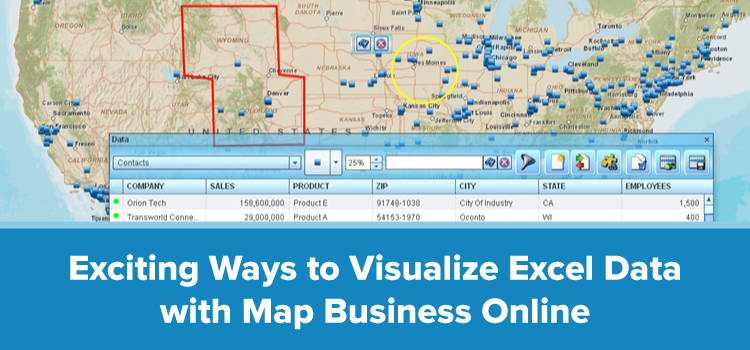
The primary purpose of business mapping software is to import layers of data onto maps with particular geographical sorting themes. The data that you import could consist of original research, conducted by your own company or information culled from the web. Either way, such information can illuminate key facts about your market when laid out in map form.
Of the different mapping programs currently available, MapBusinessOnline offers the best address–based, data–import software for the following reasons:
Fast, Easy Data Imports – To import data onto a map overlay, all you need to do is click the import button, select the data you wish to use, and voila. Any extra steps involved will depend on which spreadsheet column you wish to have the data sorted under. Regardless of the number of contacts contained in your spreadsheet, they'll appear on the map the moment you press enter. No competing software does the job this fast.
The ability to import data from an Excel list with just a few simple clicks can come in handy when you're dealing with long lists of contacts. If you have numerous contacts across the country, or within a particular state or region, you can generate a map for the area in question and import the data from a spreadsheet. The moment you press enter, the contacts will appear as dots on the map that you'll be able to click for further info.
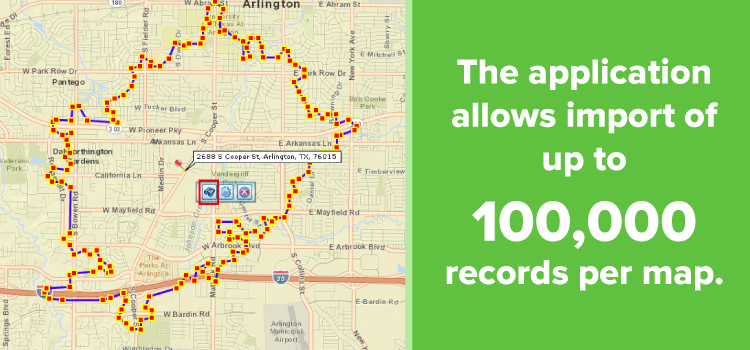
Record Limit – The application allows import of up to 250,000 records per map. The few who do reach that limit typically do so because they rarely dedupe their contact lists. Regardless, you can import as many records as you're likely to have in spreadsheet on a given day.
Excel data mapping can also be used to separate records by status and relevance. For example, if you've assembled all of your active contacts into one spreadsheet, and also made spreadsheets for prospective contacts, you can use the software to overlay both spreadsheets on the same map area. Over time, these maps can help you trace your progress at converting prospects and sustaining customers on a local, state, regional and national basis.
Spatial Options – With MBO software, you can easily research information within or around a shape on a map. A spatial map can help you determine the breadth of your marketing outreach. For example, if your list of sales contacts is dense within a certain radius of your operational base, but perhaps drop off considerably beyond that radius, the information culled from this can help you formalize plans to expand your reach. Mapped sales data, such as this, can be created when you input the data from your Excel spreadsheets into the MBO software.
Viewing Options – With MBO software, there are a variety of base map styles from which to choose. For example, if you want to view your customers and prospects by state, a map of the continental 48 can be applied that will segment each state by color shade. In this way, you can easily keep tabs on which states hold the largest amounts of hot prospects, which states are on the up and up, and which states have been quieter overall.
The same type of color–coding can be employed at the county or ZIP code level for a more localized data visualization. This information can be used to gain further insight into demographics and advertising realities in specific markets. When you create a map from Excel with this application, the contacts will appear on the map by administrative district as indicated in your spreadsheet column category, whether you want to organize contract records by city limit, county, state or ZIP.
Heat Maps – When you import spreadsheet data from a numeric column, another visualization option is to generate a heat map. With heat mapping of national, regional, state or local areas, you can gain a more nuanced perspective of your marketing success. Whereas color-coded maps will sometimes indicate a hot or cold success rate along geographic boundaries, heat maps will show the hot and cold, as well as all of the temperatures in between. Furthermore, heat maps will indicate exceptions to the rule, such as tiny hot spots in cold areas, and vice versa. Heat maps are a great way to display sales activity or progress projects.
Symbolization and Colors – One of the easiest visualization steps of all is the symbolization process, which allows you to personalize your maps in whichever way you choose. You can select circles or other shapes of varying size and color, or import unique symbols from elsewhere to serve as the data icons on your map overlays.
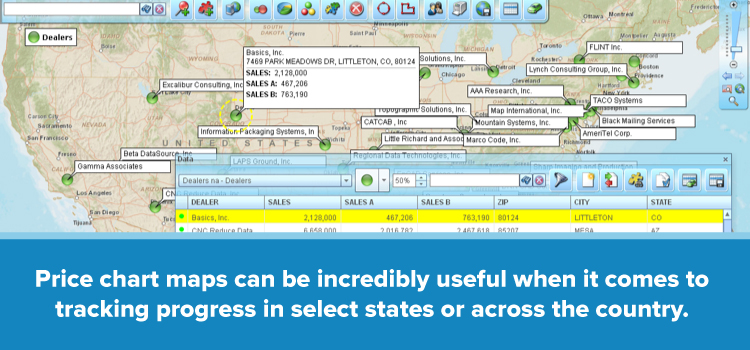
Price chart maps can be incredibly useful when it comes to tracking progress in select states or across the country. One color on the chart could indicate orders delivered, while other colors in the pie could indicate payments received and orders shipped. If inconsistencies are found in delivery rates between two nearby zip codes, the information can be used to identify possible routing problems in certain areas.
Map Sharing – With MapBusinessOnline, the process of map sharing is easy. You can choose static images if you so desire, or opt to share via interactive web maps or network collaborations, which can turn the process of map editing into a form of teamwork. Shared map editing is a great way to leverage cross department brain power towards fixing a nasty problem.
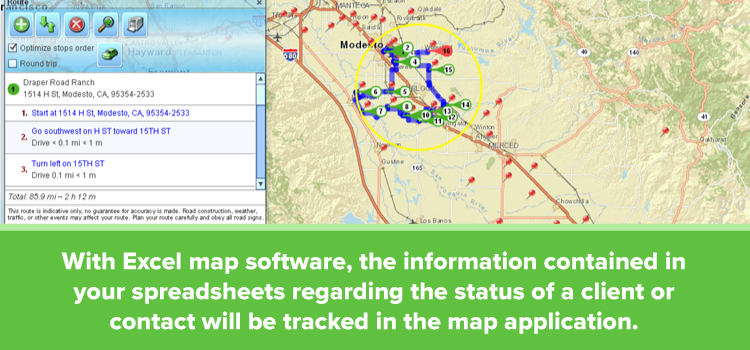
Edit and Update – The easiest and most efficient way to update your maps is to add a unique ID columns to your spreadsheets that controls the record updates. Data can be added, edited or removed as you go along, or you can allow the program to update your maps automatically as new data appears on your desktop or within your network. With Excel map software, the information contained in your spreadsheets regarding the status of a client or contact will be tracted in the map application. To view this information, you simply hover over a particular contact with your mouse. This info can be updated manually when you view it on the map, or each time you update the spreadsheet and re–upload the information.
SDK and API – Special tools are available in MapBusinessOnline that allow programmers with SDK and API skills to handle application to application data feeds, though MapBusinessOnline must be contacted about this first, as use of API requires a team subscription.
When you consider the array of location-based features that MapBusinessOnline offers your whole team is likely to become addicted to our software. Companies are using the data visualization options of MBO software to gain insights into how business trends play out on a local, regional and national scale.
Competitor Maps – Be aware of what your competitors are up to and where they are making inroads. Otherwise, your competitors are going to get a leg up on you, especially if they beat you to the punch in their adaption of Excel data mapping software.
You can stay ahead of your competition, however, if you develop maps that show the areas in which competitors have outperformed you. This information can then be correlated to maps that show demographic data on select locals, and from there you can formulate ways to more effectively advance your marketing efforts and ultimately surpass your competition.
Expansion Plans – The information that you plot in MBO on a given location or contact can be updated as required, whether your goal is to boost marketing in said area or promote new offers to the contacts in question. Maps views that display the distribution of your successful campaigns over a span of months, you help you identify your best strategies for boosting sales. In the same way, losing strategies can be identified and eliminated from your future game plan.
Customer Maps – When you're able to locate the geographical clusters and gaps within your customer base, it can help you identify the strengths and weaknesses of your marketing approach. For example, if a map shows a high density of customers on one side of a river, yet few on the other side, this would indicate a demographic gulf. With further research, you should be able to develop plans to rectify sales shortfalls.
In some areas of low performance, you might find that the demographics simply don't favor your product or service. However, demographic data might reveal other nearby areas that you hadn't considered; areas similar to your best performing market.
Operational Coverage – Have sales reached or exceeded expectations, or have weak spots been identified through map sales data? Is each member of your team performing to his or her best abilities, or are certain individuals just not the right personality type for certain accounts? All of this information and more can be entered onto overlays with Excel map software and compared and contrasted for further insights.
Staffing Maps – If you've experienced difficulties in the past with keeping track of progress across your team's field force, MBO software can help manage field activity. Business maps can be used to track the success of outbound service people.
When applied to an individual, the info can be used to identify sales staffers who have underperformed in what are otherwise lucrative communities. When the information is taken collectively, and sales people, by and large, are winning or floundering in select areas, you can then distinguish which areas should be prioritized and which should be de–prioritized.
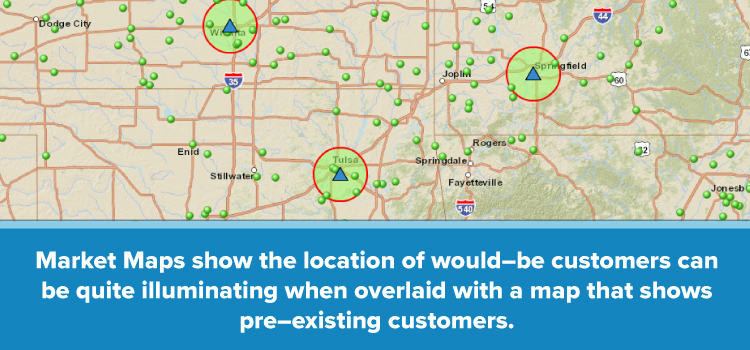
Market Maps – A map that shows the location of would–be customers can be quite illuminating when overlaid with a map that shows pre–existing customers. For instance, if there's little geographic overlap between the groups of people in the two overlays, it would indicate that certain lucrative areas have been overlooked by your company. Therefore, it would mean that it’s time to widen your areas of coverage so that you can get your products out to these underserved communities.
Team Responsibility - One of the most effective ways to see which team members are most responsible is to analyze performance levels with business territory mapping. If the performance metrics are much more positive among certain members of your staff, the methods they've employed can then be studied and taught to others on your team. From there, you can set a more accurate set of expectations for your company.
If a team member underperforms, further business mapping can be applied to determine whether the shortfall is due to a lack of prospects in the area in question — in which case the individual should probably be moved to a different account — or negligence on the part of the sales person.
Strategy – With business mapping, you can expose positive trends as well as roadblocks in your market. As such, you can gain better insight into your prospects. When you plot addresses on a map from an Excel spreadsheet and compare the current numbers with those from prior months, you can more easily identify trends over a period of anywhere from a few weeks to many years. This can help you determine what might be responsible for a lull in business — a faulty product, an unreceptive market, poor marketing, or seasonal downtime.
Excel Data Mapping From MapBusinessOnline
Business mapping is one of the most effective software solutions for increasing sales in companies that do business across areas of any size. From the placement of customers and prospects to the identification of fast and slow markets on a local, regional and national scale, the software can help you harness the strengths and minimize the weaknesses of your marketing strategy and ultimately find the best ways to serve the public.
The most commonly used feature in business mapping is the ability to enter large lists of information into a map from an Excel spreadsheet. To learn more about Excel map software, contact MapBusinessOnline today to request a live Web demo.