How to Create a Map with Multiple Pins
Creating a map with multiple pins (or map points) is easy. Usually, those pins represent addresses, addresses where people live, or businesses with a facility. A pin on an address can be placed manually by dropping a point on the business map, one point at a time. But that is a slow process for locating many pins. The best or fastest way to create a multiple-pin map using business mapping software is to start with a spreadsheet of all your address locations.
For MapBusinessOnline, datasets are usually customer lists. But they could also be patient lists, donor lists, or all the people you plan on inviting to a college reunion after the COVID-19 Pandemic has passed.
How To Create a Map with Multiple Pins?
- Create an Excel spreadsheet that lists your address locations broken out into separate columns by Name, Address, City, State, and Zip code.
- Ensure your column headings are labeled: Address, ZIP code, etc.
- Click the Import or Plot button in the mapping application. An import wizard will open up that will walk you through the process.
- Please pay attention to the mapping dialogue to confirm address columns are located where they should be (match your dataset’s ZIP code with the application’s ZIP code etc.)
- Adjust labeling options to your liking
- Click the Plot button in the lower left to place your points on the map
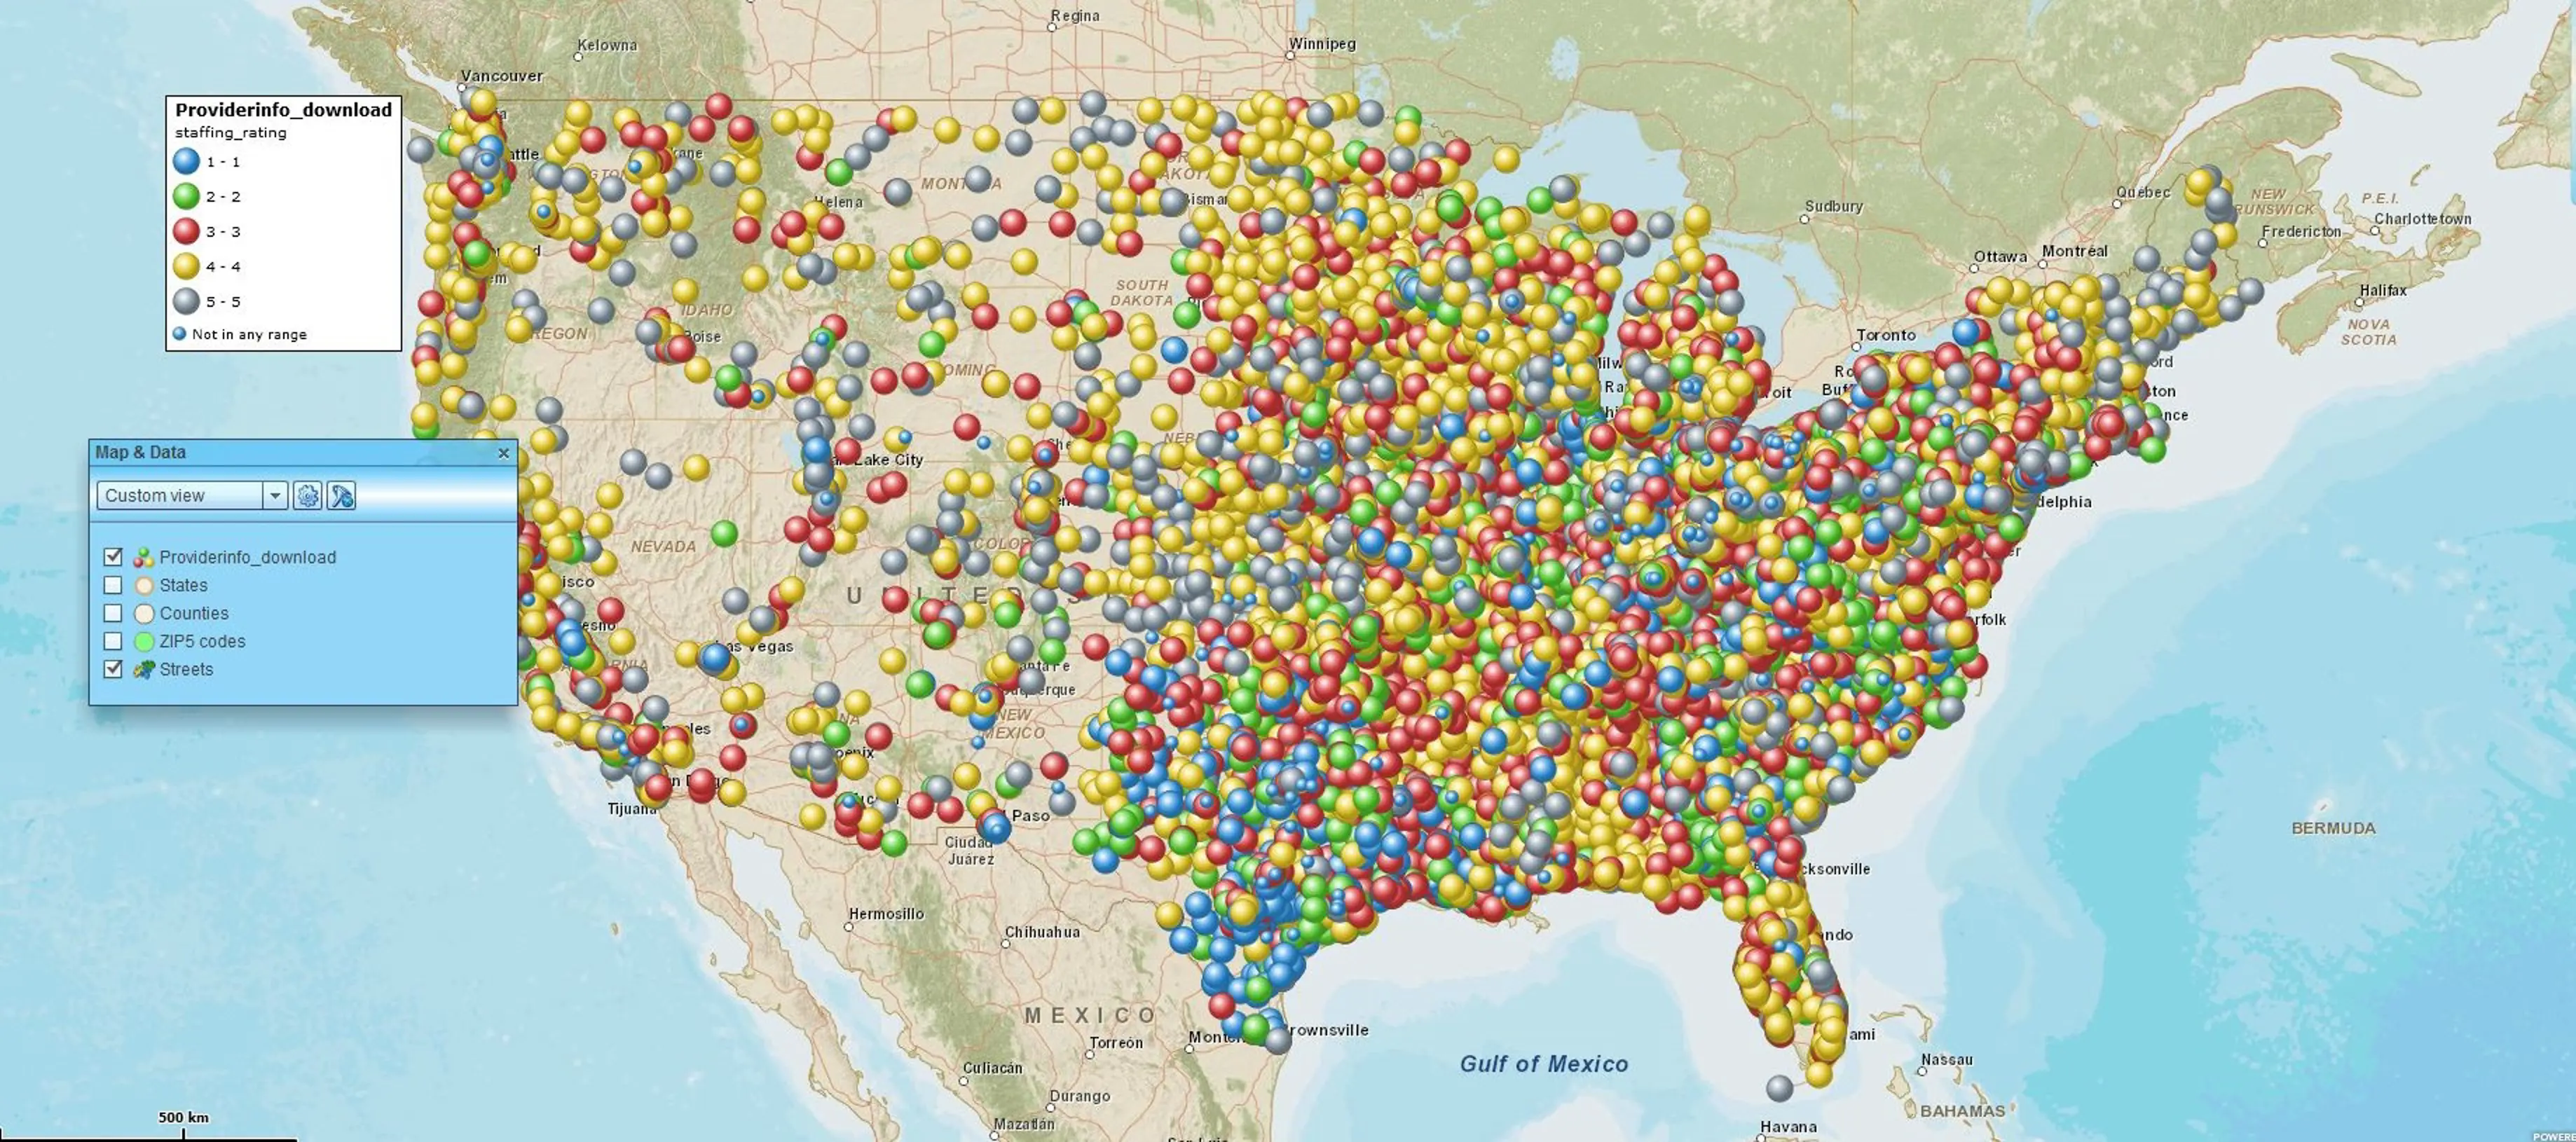
Once your data is imported into MapBusinessOnline, you should see pins or buttons on the map representing your addresses. You may now adjust the symbol selection to your liking. You can also change the symbol size, shape, and color to match your map objectives better.
Incremental Point Placement
MapBusinessOnline has two ways to place a point on the map manually:
- In the upper left-hand corner of the map (above the tool bar), use the blank white Address Box to key in the address of your proposed pin location. This way, format the address with commas: Address, City, State, ZIP Code. Click the Binoculars icon to the right of the address box.
- An alternative approach – On the master toolbar, click the dropdown on the draw tools – usually, the draw tools display an ABC icon. Select the bottom option of the dropdown list: “Location.” Move your cursor to your location on the map and Click the map to place the point.
Callouts or labels are also configurable. When placing individual points on the map, click the label to edit the location name. Be sure to consider naming your data point’s data layer because you are creating a data layer or adding to a data layer every time you add a new point.
In MapBusinessOnline, a user may adjust the pin symbol, color, and size in the Data Window view or by Editing the Data Layer in the Map & Data control box.
Import Your Own Symbols
MapBusinessOnline provides an entire library of MapPoint symbols, but you can also import your own symbols to the map. These imported symbols should be small Jpeg files. Sometimes, you may find a whole set of symbols specific to your industry so ask around.
Creating a basic multiple pin point map is a great place to start for your first business map. Many MapBusinessOnline users begin their mapping work similarly – importing a spreadsheet of location points and viewing their business on a map. Save that first map using the Save Map button on the left of the Master Toolbar. It’s a good idea to save it as a template for future map work.
Add to your work by importing business listings or creating sales territory maps. To access Business listings click the Yellow Pages icon in the middle of the master toolbar.
Why Bother Creating a Multiple Pin Map?
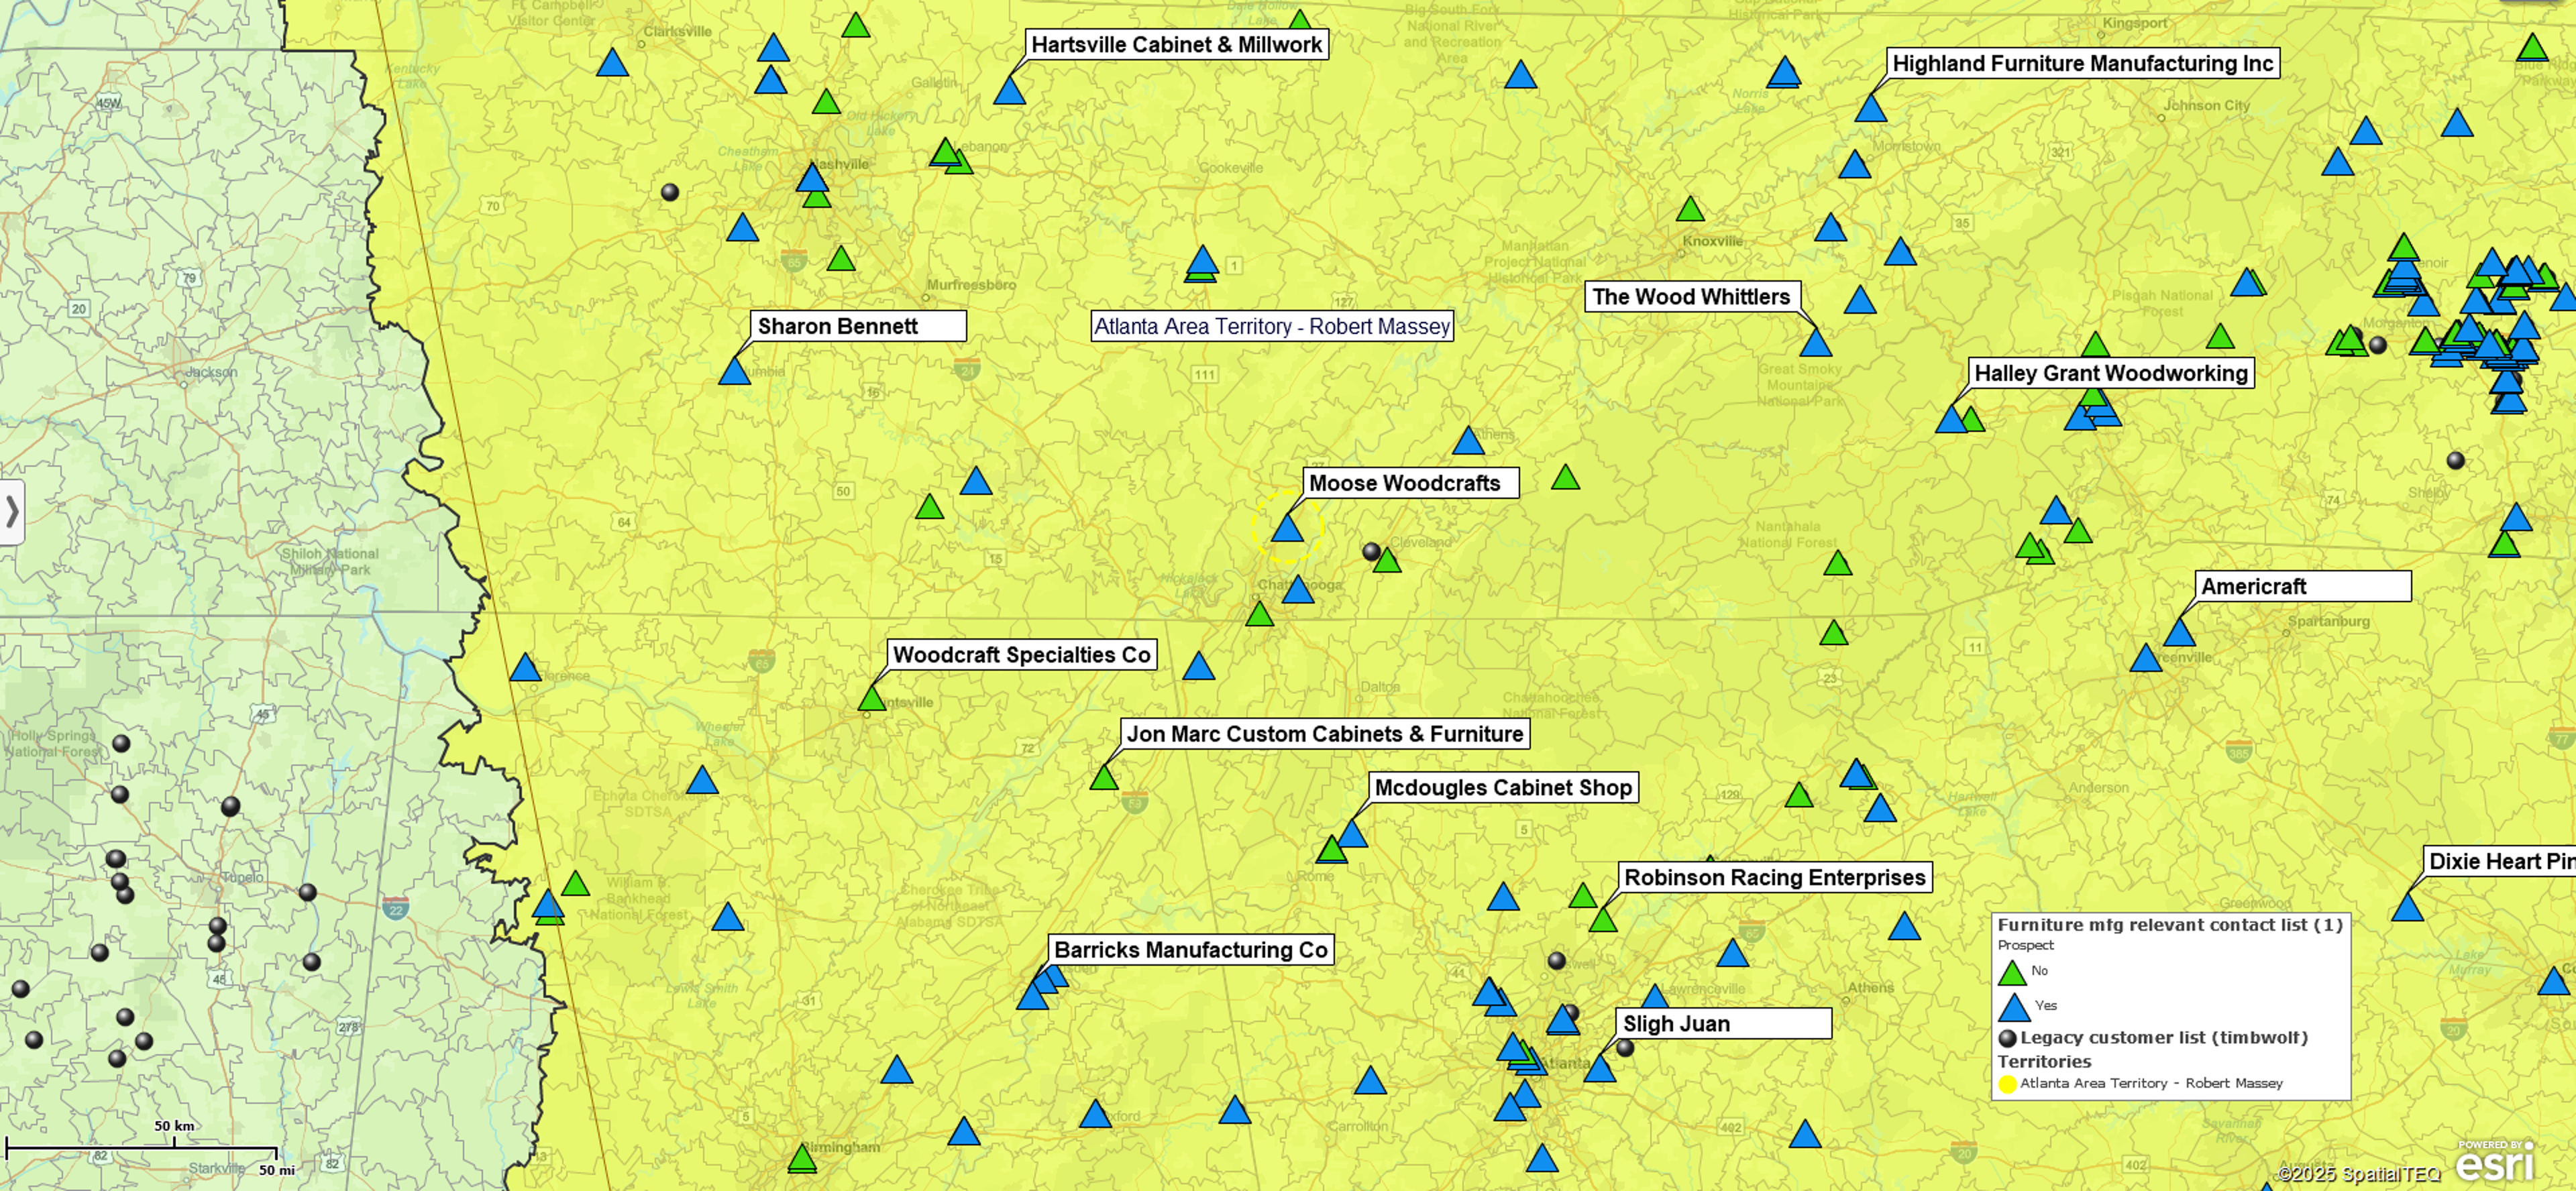
Business mapping users usually place address points on a map to visualize their customer, competitor, patient, or vendor lists. Seeing their constituents spread out across an accurate map of the USA or Canada is an illuminating experience.
Longtime business map users view their business address lists for the same reasons. Visualizing clients or patients on a map never gets old. These visualizations reveal patterns in our work that often reveal business intelligence.


