How to Create a ZIP Code Heat Map
A ZIP code heat map shows intensity by color‑shading ZIP areas using a numeric field (sales, customers, deliveries, population, etc.). It’s a quick way to spot hot/cold zones, compare regions, and communicate a clear picture to your team.
Steps to Build a ZIP Code Heat Map
With just a few steps you can move from raw spreadsheet numbers to a map that highlights patterns — whether that’s spotting sales hot spots, tracking delivery volumes, comparing customer density across regions, or using demographics to size new markets. The process is straightforward:
1. Get Your Data Ready
Prepare a spreadsheet (CSV or XLSX) with a ZIP code (ZIP5) column and at least one numeric field (e.g., sales, orders, households) that you want to visualize.
2. Import Into MapBusinessOnline
Load your spreadsheet so each ZIP is matched to its boundary on the map.
3. Apply Color-Coding by Variable
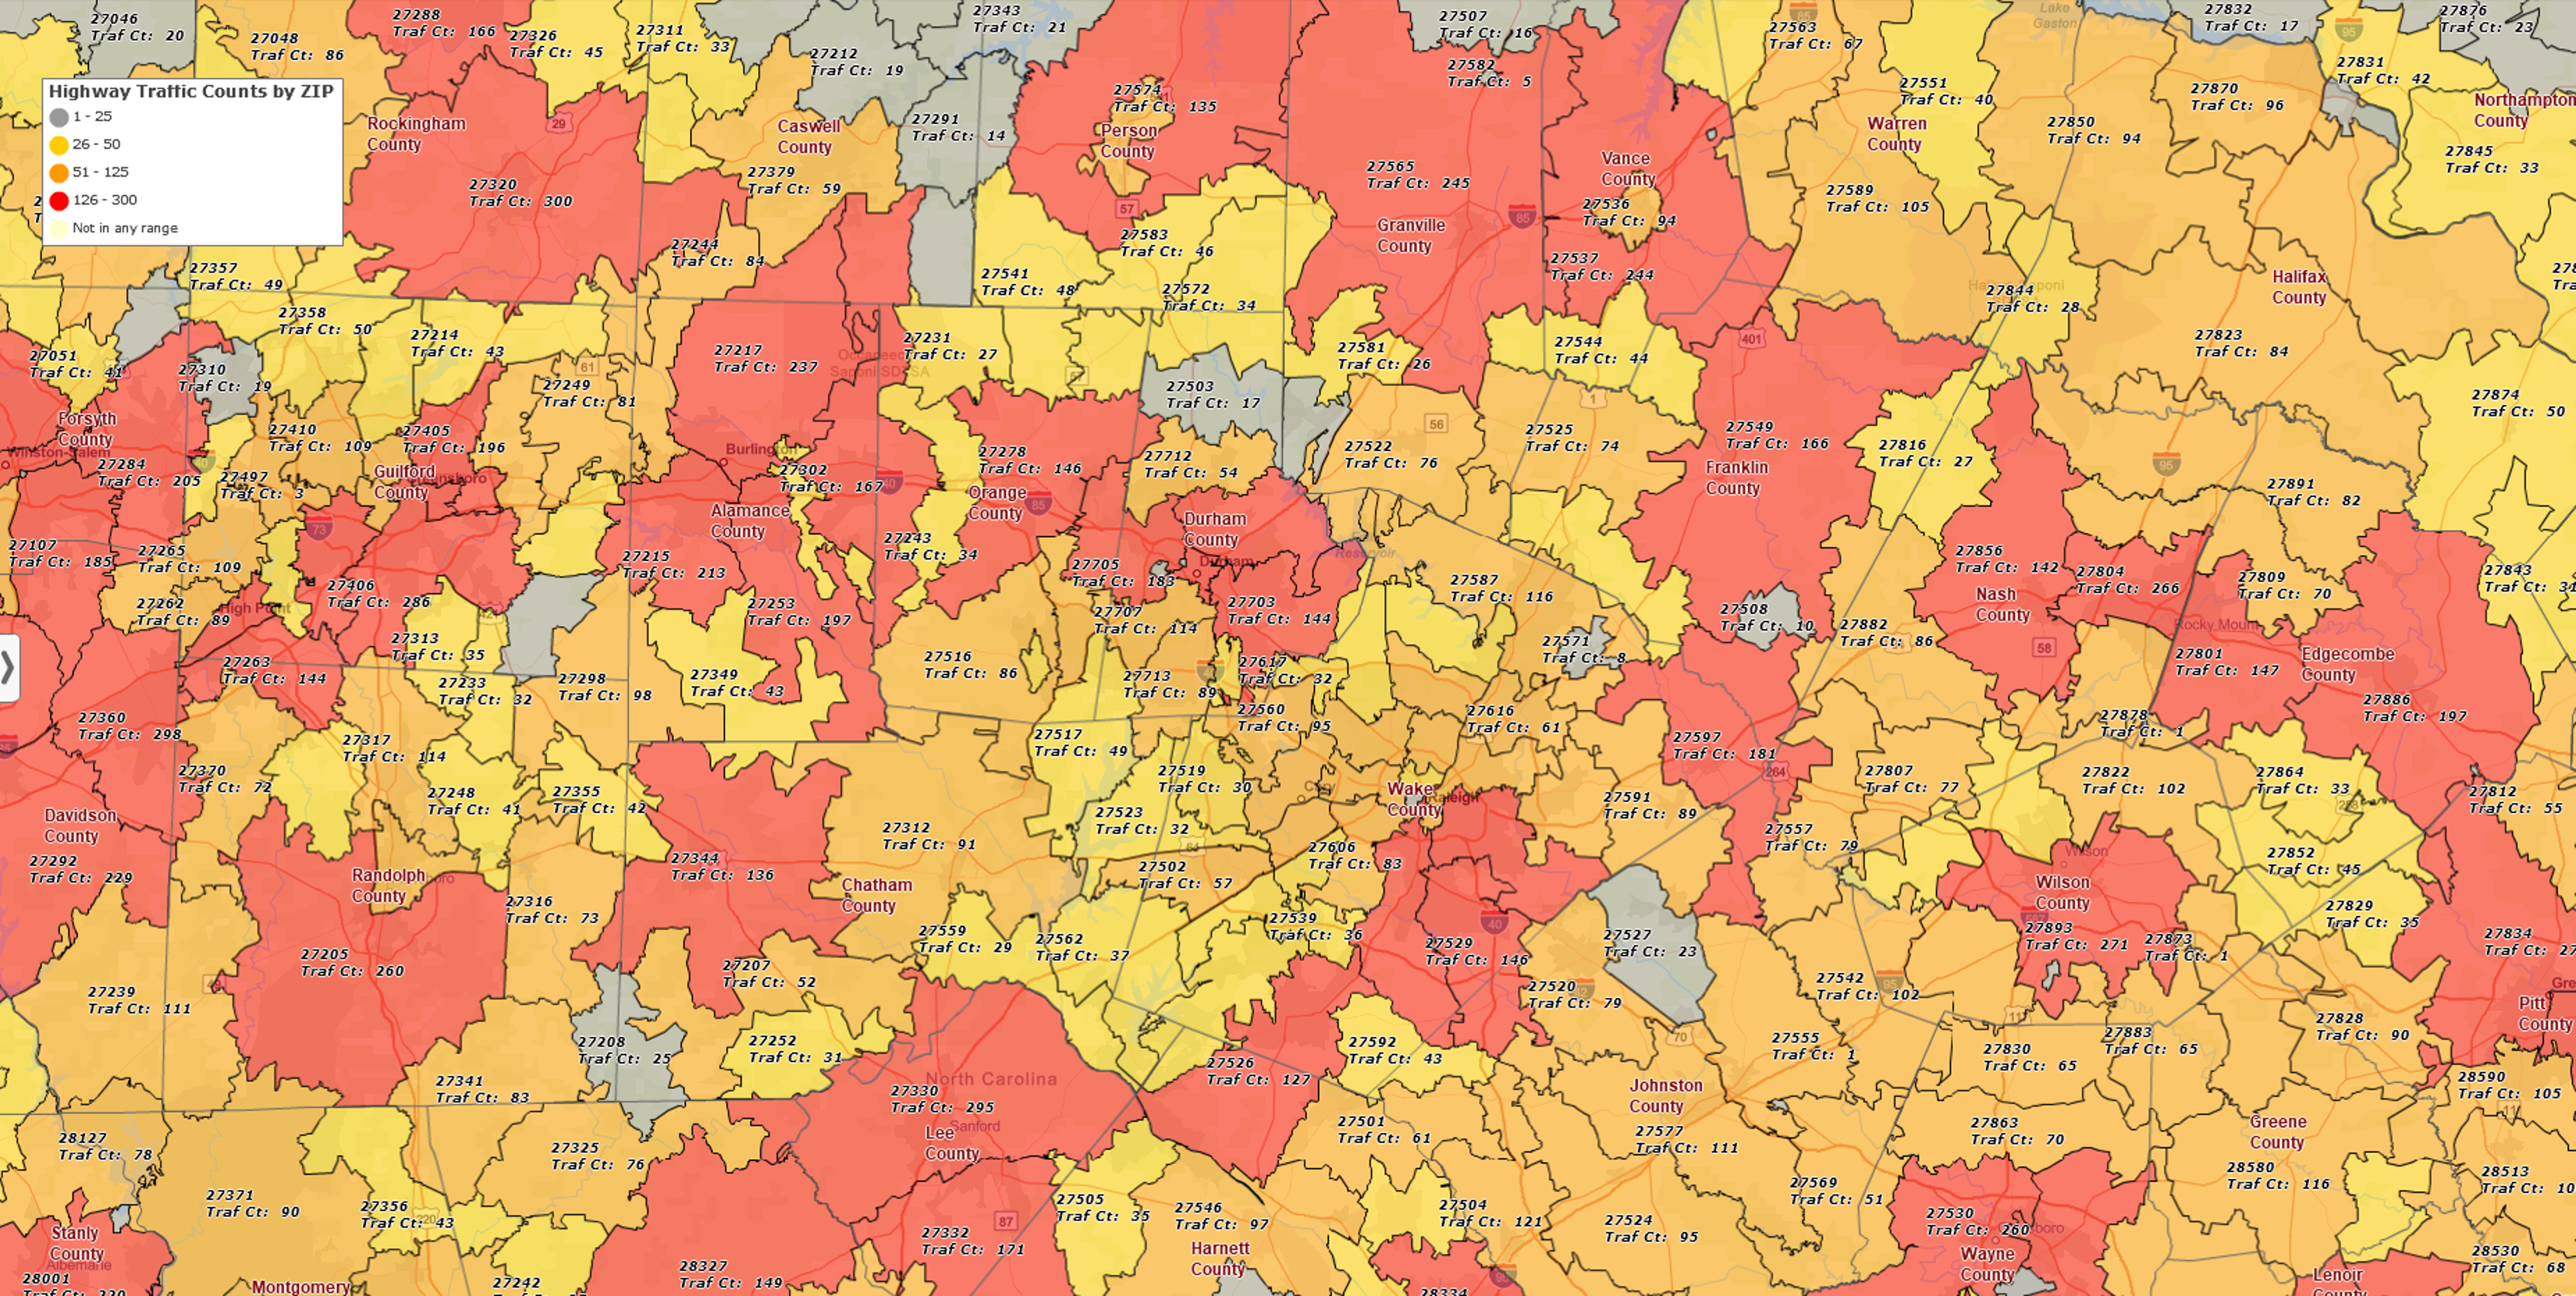
Choose the numeric field to shade ZIP areas. Use 3–5 groups with a clear legend and adjust breakpoints if outliers skew the view.
4. Print, Export, or Share the Map
Output a clean PDF or image, or share an interactive map so your team can view the results.
Excel Heat Maps vs Purpose‑built Tools
While Excel can display basic heatmaps, purpose‑built tools like MapBusinessOnline help you go further:
-
Flexible ZIP shading controls: precise class breaks, readable legends, and map‑first defaults that make differences obvious beyond Excel’s map charts.
-
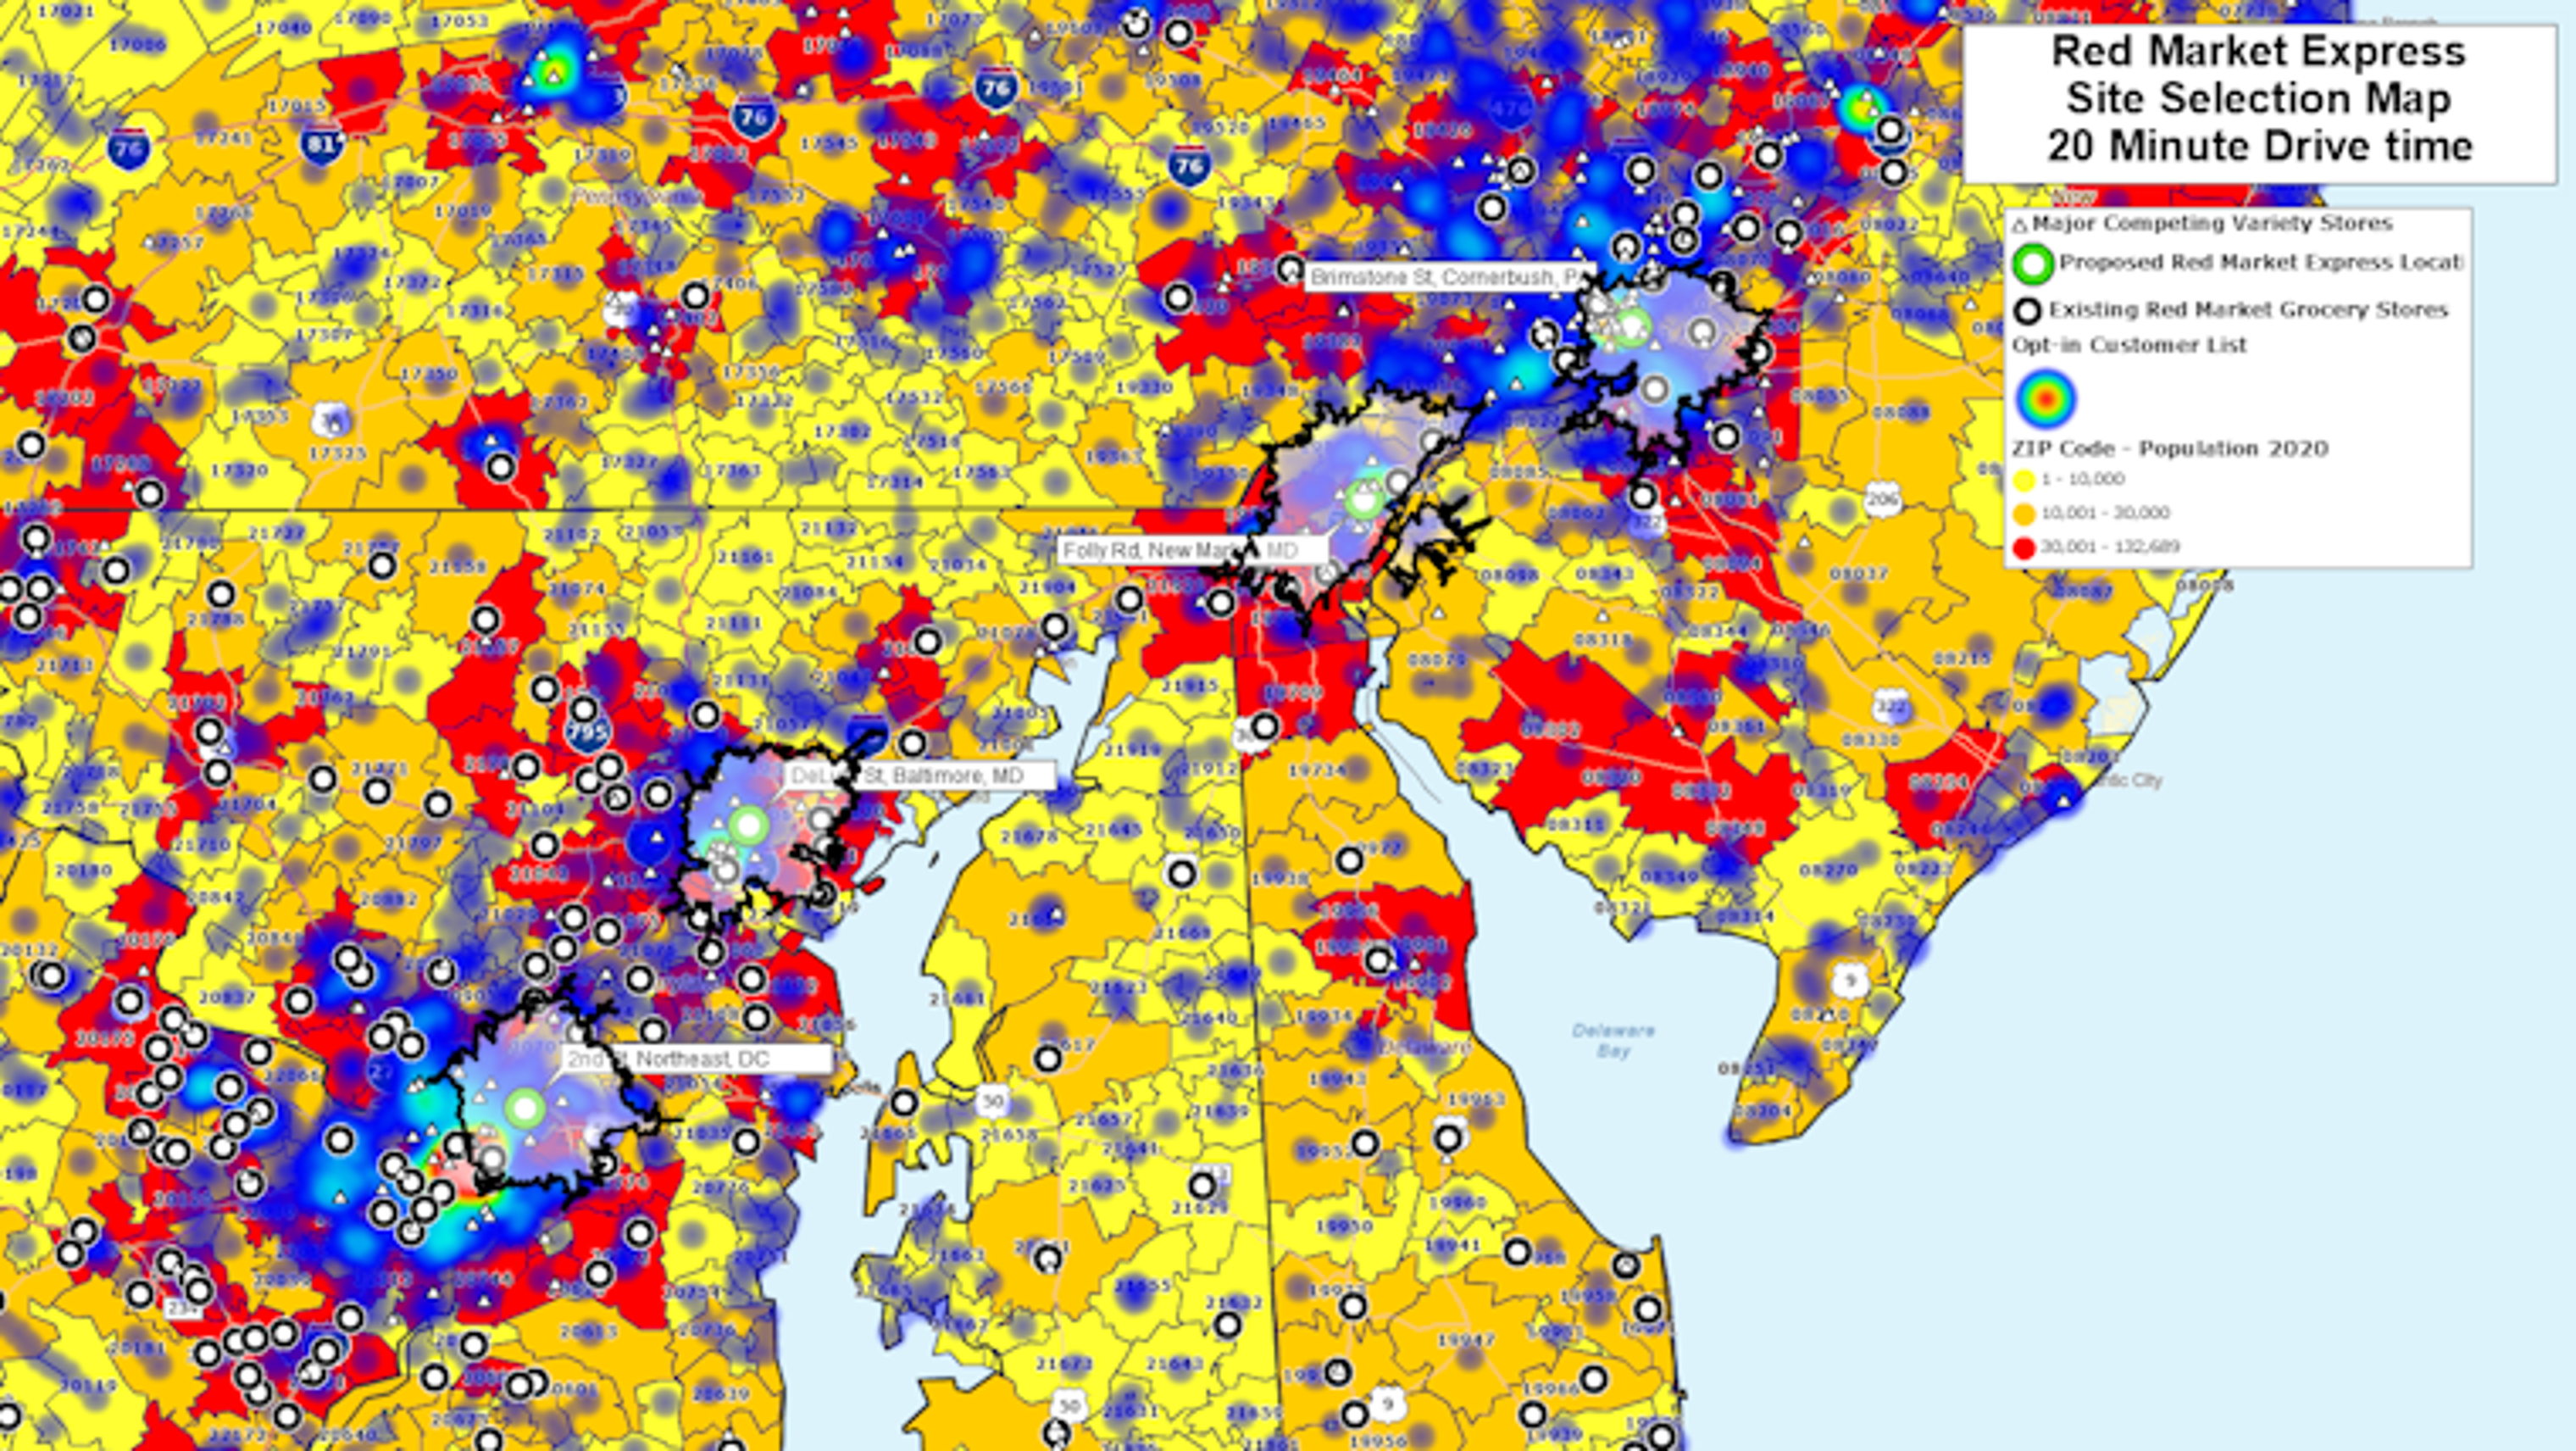
Overlay your business layers: customers, stores, deliveries on top of ZIP shading to add context for decisions.
-
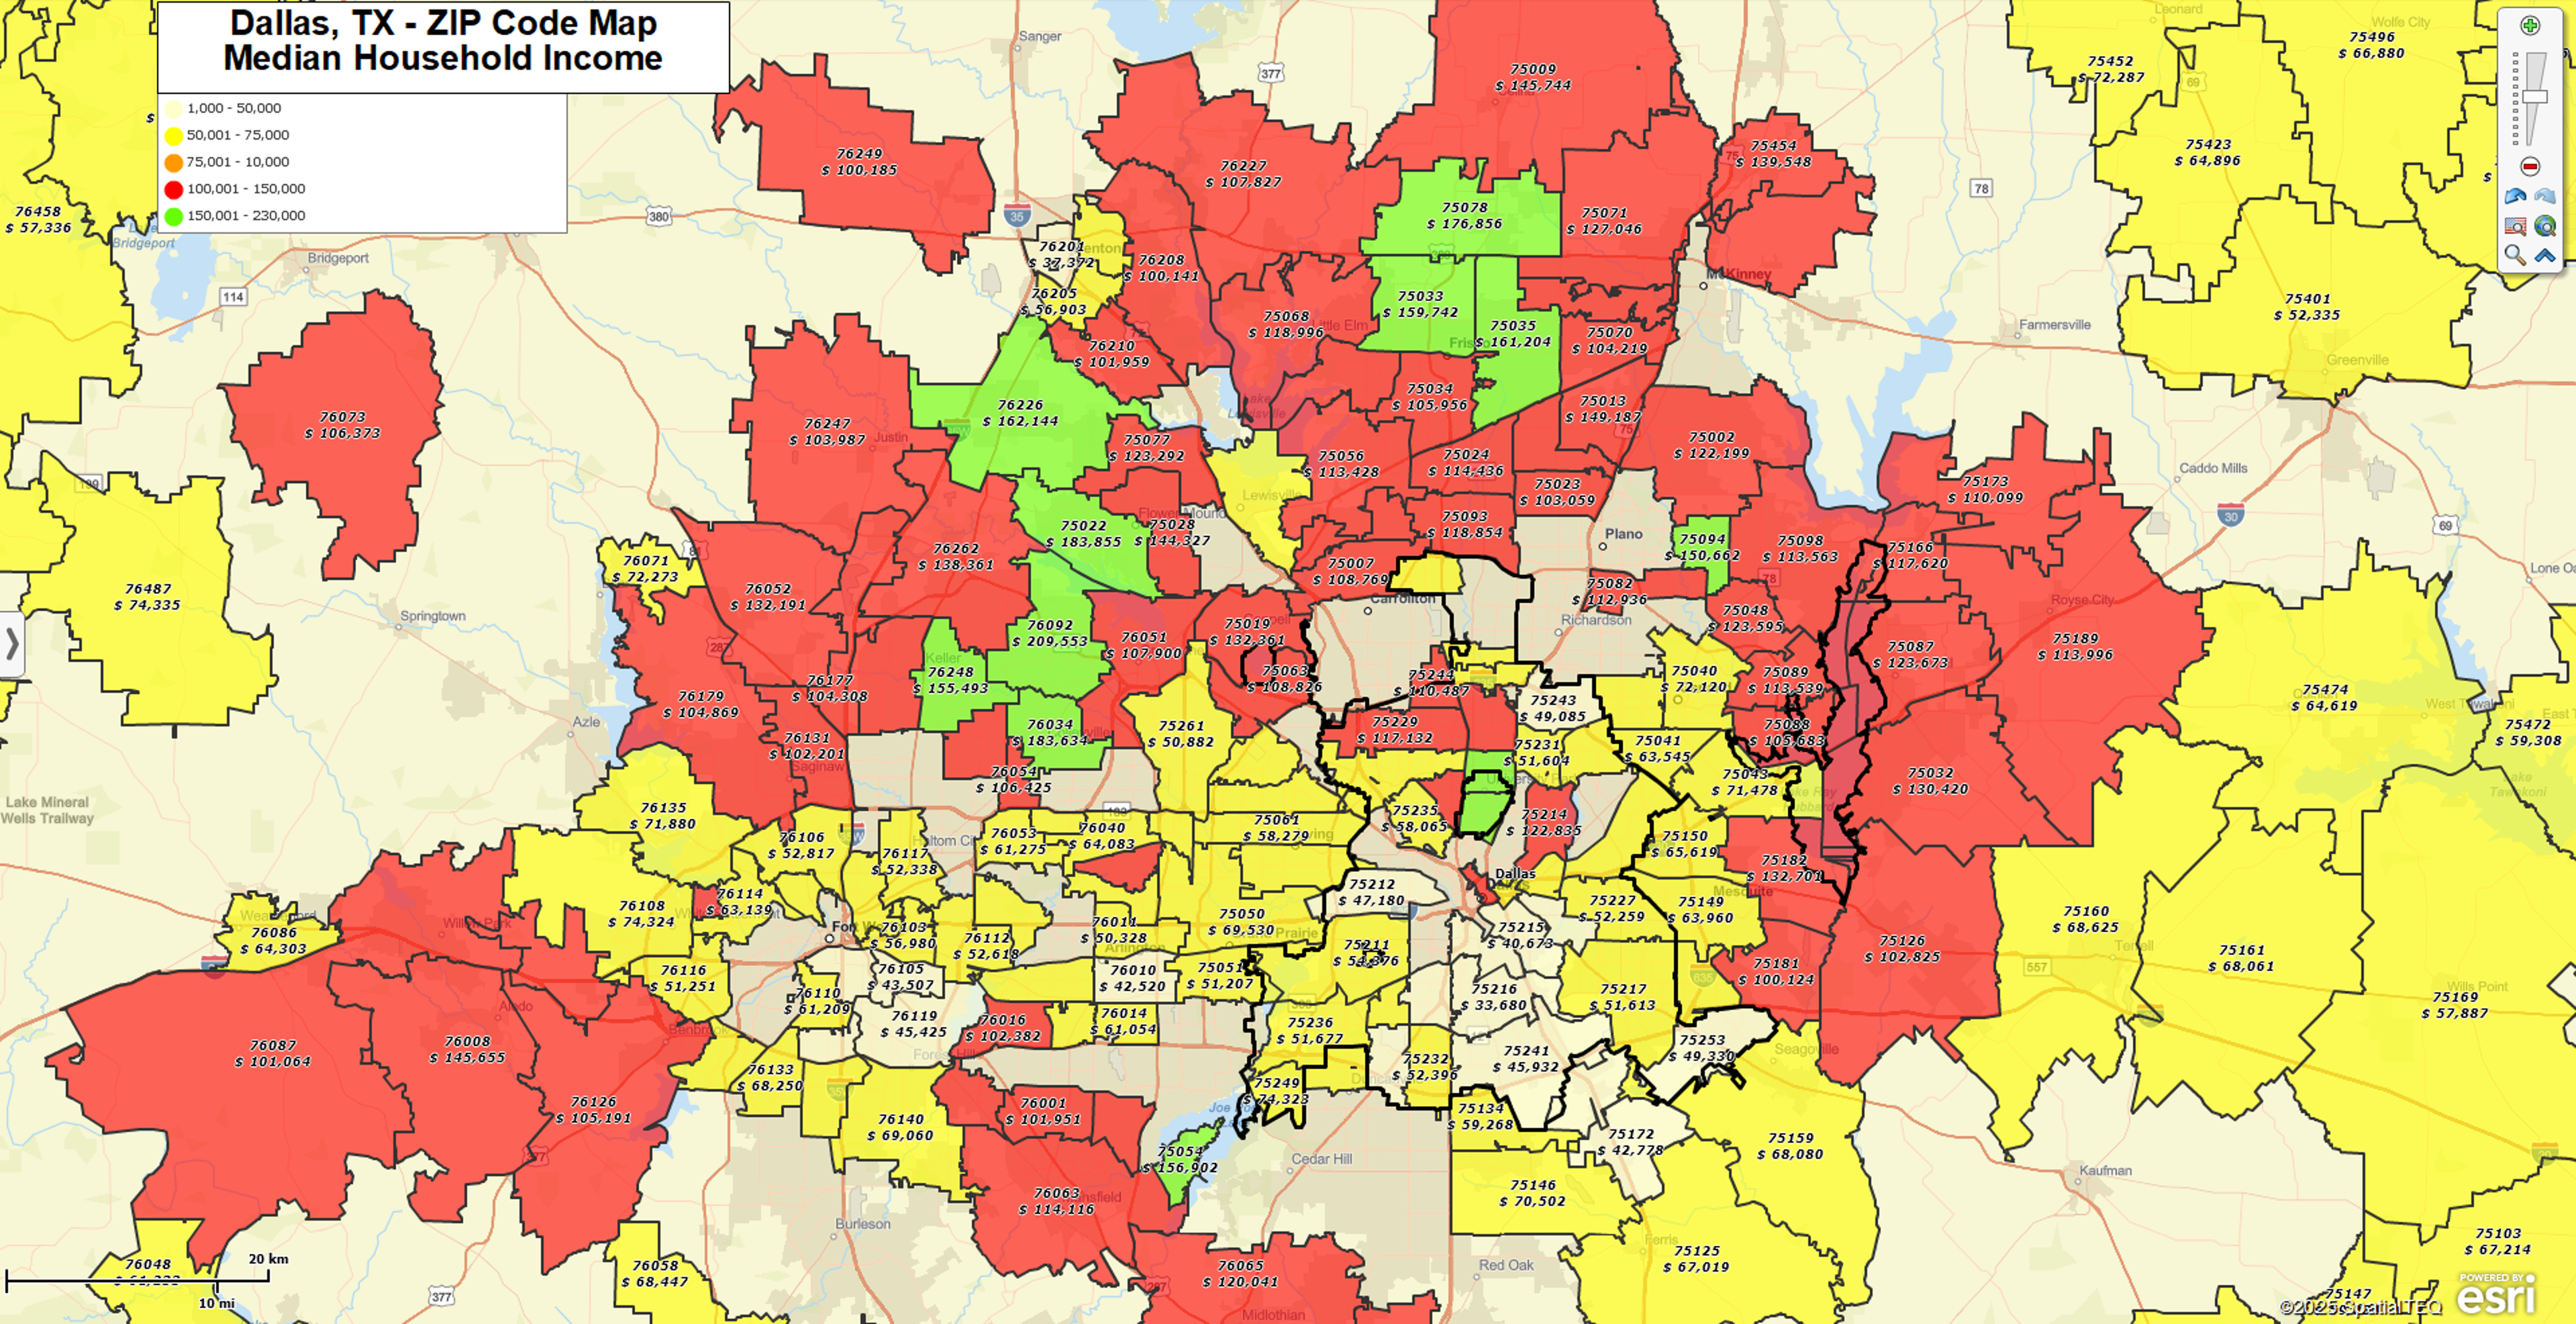
Included demographics: use built‑in U.S. Census variables (e.g., population, income, households) to color‑shade ZIPs for market sizing and planning — no external files.
-
Territories and boundaries: build and visualize territories or rollups (ZIP5 → states) alongside your heat maps.
-
Share‑ready output: export clean images/PDFs or share interactive maps so everyone sees the same story.
Note on Point Heat Maps
MapBusinessOnline also supports point-based heat maps, which highlight density around individual locations. These are especially useful for visualizing concentrations of potential customers, service calls, or deliveries. A common example is using point heat maps for target market research to see where demand may be strongest. For more, see our article on Using Heat Maps for Target Market Research.
Tips for Great‑looking ZIP Heat Maps
-
Pick the right metric: choose the number that tells your story (orders per ZIP, not just customer count if activity is the focus).
-
Mind outliers: use custom breaks so one extreme ZIP doesn’t wash out the rest.
-
3–5 color groups + clear legend: reduce noise; add units so the scale is understood.
-
Zoom with intent: validate readability at the scale your audience will use.
-
Selective labeling: call out only a few key ZIPs (e.g., top 5 by value) and keep font styles consistent to avoid clutter.
Make a ZIP Code Heat Map Now
If you came here looking for a ZIP code heat map generator, MapBusinessOnline lets you build a ZIP heat map from your spreadsheet quickly. During the free trial you can save, export, and share your results — just click below to get started.


