Imo's Pizza
Background
Expanding your restaurant business may seem like the obvious next step, but a successful expansion can be a real challenge. Imo's Pizza, headquartered in St. Louis, MO, has not only expanded successfully, but they've sustained that expansion through the era of COVID-19.
Still, the company wants to grow responsibly and contacted MapBusinessOnline to determine if map visualizations and map-based market analysis could help them optimize their ongoing expansion plans.
The first Imo's Pizza store opened in St. Louis, Missouri in 1964. Imo's combined the concept of "St. Louis Style" pizza with home delivery and rapidly grew into one of the most successful pizza chains in the USA. Today they are interested in strategic expansion of their chain of stores beyond their current sphere of operation. Read more about Imo's story.
Challenge
With over one hundred Imo's directly owned and franchised store locations spread across the states of Missouri, Kansas, and southern Illinois, Imo's has a pretty good sense of the optimum demographic and geographic elements responsible for successful restaurants. But, with further growth as the goal, Imo's needed to identify which cities outside of their current area of operation, but inside of a 250-mile radius, offered the optimal conditions for new pizza restaurants.
Downtown St. Louis has been a fertile hotbed of restaurant growth for Imo's over the decades, but any city has a limit to the number of pizza restaurants it can support. Imo's needed to understand why stores worked well or, in a few cases, failed to perform as expected.
Imo's Director of Franchise Intelligence, Tim Hendrix, had a great sense of which demographic categories most influences Imo's restaurant sales. "Our pizza appeals to all income levels and ethnicities. If anything, our primary market is the American family." Tim was able to expound upon several important demographics:
- Imo's customers tended to fall into middle-class median income levels - $35,000 to $150,000 per year
- Overall dense downtown city populations supported sales, but the real driver for pizza sales was households, a demographic category tracked by the US Census Bureau
- Gender, race, and ethnic identity did not seem to impact Imo's sales results. It turns out, 'everybody loves pizza'
- Twenty-minute driving time from customer to an Imo's location was determined to be the optimum maximum pick-up/delivery time
Solution
Both MapBusinessOnline Standard and MapBusinessOnline Pro versions are applicable towards market analysis challenges like Imo's Pizza's expansion plan.
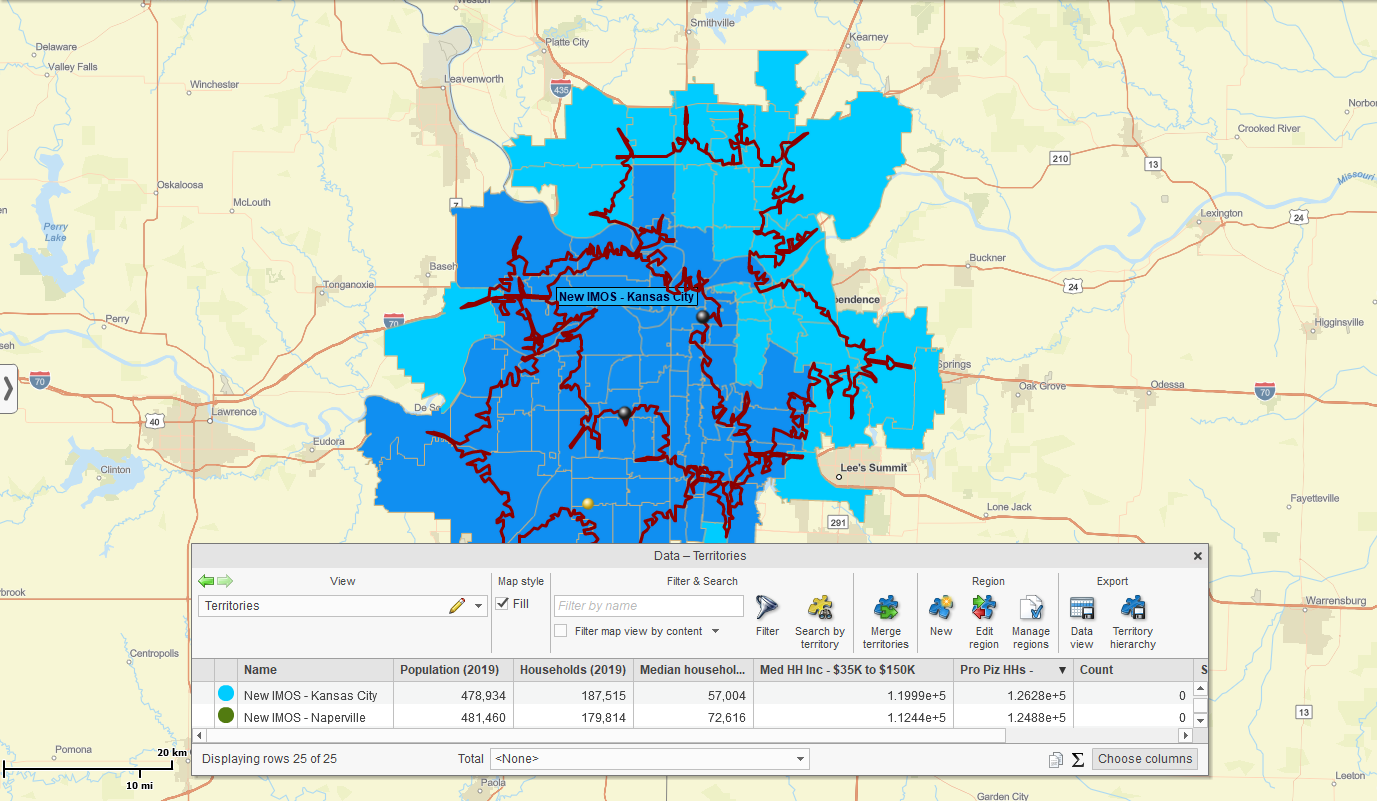
An address location dataset of all Imo's Pizza locations was imported into a MapBusinessOnline map project. The optimum pick-up and delivery driving time for the average Imo's customer is known to be a 20-minute time range. Additional driving and delivery times would discourage customer orders. For this reason, a 20-minute driving time was used in MapBusinessOnline Pro to create multiple drive time-based territories for each of the existing store locations, simultaneously.
Imo's territories reflect 20-minute driving times in all directions from each store location. Any ZIP code intersected by the drive time query polygon is included within the drive-time-based territory. Thus, all territory-based demographic assessment encapsulates ZIP code populations that intersect a 20-minute drive time polygon from the center point address of each restaurant.
MapBusinessOnline provides a comprehensive library of demographic data categories. These demographic segments include topics such as medium income levels, ethnicities, household statistics, and consumer expenditures, as well as many other Census categories. The tool lets the user combine similar layers using the Calculated Data Columns function. For example, multiple Census Bureau demographic age segments can be grouped to support analysis of all Americans over the age of 65.
Store location points were plotted by address and arranged based on Imo's store ranking assessment, identifying the best performing restaurants on the map. At first, a wide variety of demographic layers were imported into MapBusinessOnline to compare store sales rankings with demographic realities. As mentioned, high-income levels were not a primary factor in most high-ranking stores. Ethnic populations were reviewed but were not determined to be impactful.
Household Segments
The Calculated Data Columns feature was used to sum demographic data layers across income and population segments. In this way, all household segments could be totaled to provide a total household category by territory. This calculated demographic category included married households, single female head-of-household, and single male family head-of-households - the idea being, more households generate more pizza sales.
Views of Imo's territory analysis in the MapBusinessOnline Data Window confirmed that high-density population in general, large numbers of major household segments, along with a middle-class medium household income levels, are all strong indicators of fertile ground for new restaurant placements. Each demographic category can be easily sorted by top value to the least value to indicate that topic's impact on high ranking stores. Choosing higher-income neighborhoods or neighborhoods predominated by specific ethnicities is confirmed to be unrelated to Imo's store success.
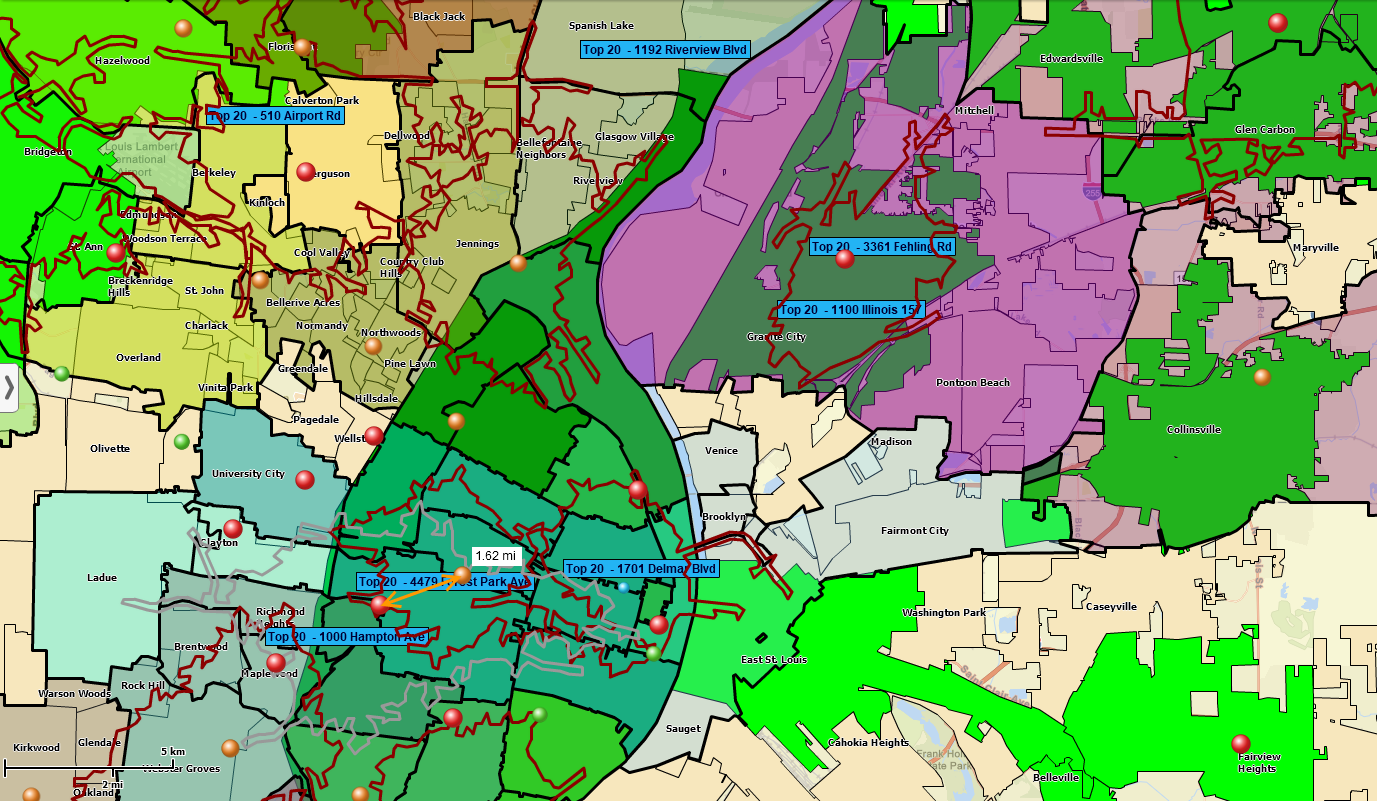
The best-ranking stores in downtown St. Louis reflected this demographic assessment - as did other successful Imo's locations.
With the demographic base-map model for a successful Imo's Pizza location agreed upon, new maps are possible from the base-map template, which suggest further expansion possibilities as the need arises. Additional analysis, using the same map templates as a starting point, could also include:
- Restaurant competitor maps based on MapBusinessOnline business listings data
- Operational and delivery analysis to minimize travel expenses
- Franchise territory maps indicating available and sold franchise locations
Results
Expansion planning can be both nerve-wracking and risky for any business. By developing organized business intelligence maps based on relevant demographic elements that help to define the success of particular restaurants, Imo's Pizza has added a new, location-based level of understanding to their decision-making process.
According to Tim Hendrix, "We had a gut feel of what was the right city and general locations in mind for the next few stores, but we wanted a more analytical assessment of each potential market. MapBusinessOnline helped us achieve our goal."
Business maps can help define any business's theater of operation. With well thought out map visualizations and rich demographic analysis, any restaurant can make decisions based on business realities as opposed to relying on gut feel. Just going through the process of developing a market analysis map will bring a thriving organization to a better understanding of their market, their customers, and their future.
MapBusinessOnline was able to provide:
- Multiple store drive-time-based territories with demographic analysis that helped define optimum markets for Imo's Pizza
- A set of map templates for use in further map analysis as the need arises
- A deeper understanding of the typical Imo's Pizza customer, helpful in defining marketing messages
Imo's Pizza map-based market analysis results confirmed their understanding of their business. These maps turned 'group think' on the part of Imo's management into compelling map visualizations that suggested a path for future growth while providing a blueprint for potential franchisee investors to believe in. As another industry franchise business manager said recently, "business maps sell franchises." Well, we know Imo's sells great tasting pizza, and hopefully, business maps will help them sell more.


