Expansion Planning Using Heat Maps
Problem: Need to Transform New Product Success into New Market Opportunities.
ABC Furniture manufacturing manufactures and distributes furniture through show rooms across the Eastern USA. The ABC reclining chair profits have proved to be significant and the company is interested in developing the market further. The best way to accomplish this is to either build showrooms or partner with showrooms in underserved areas.
Solution: Visualize Sales with a Heat Map - Find ZIP Codes for Growth.
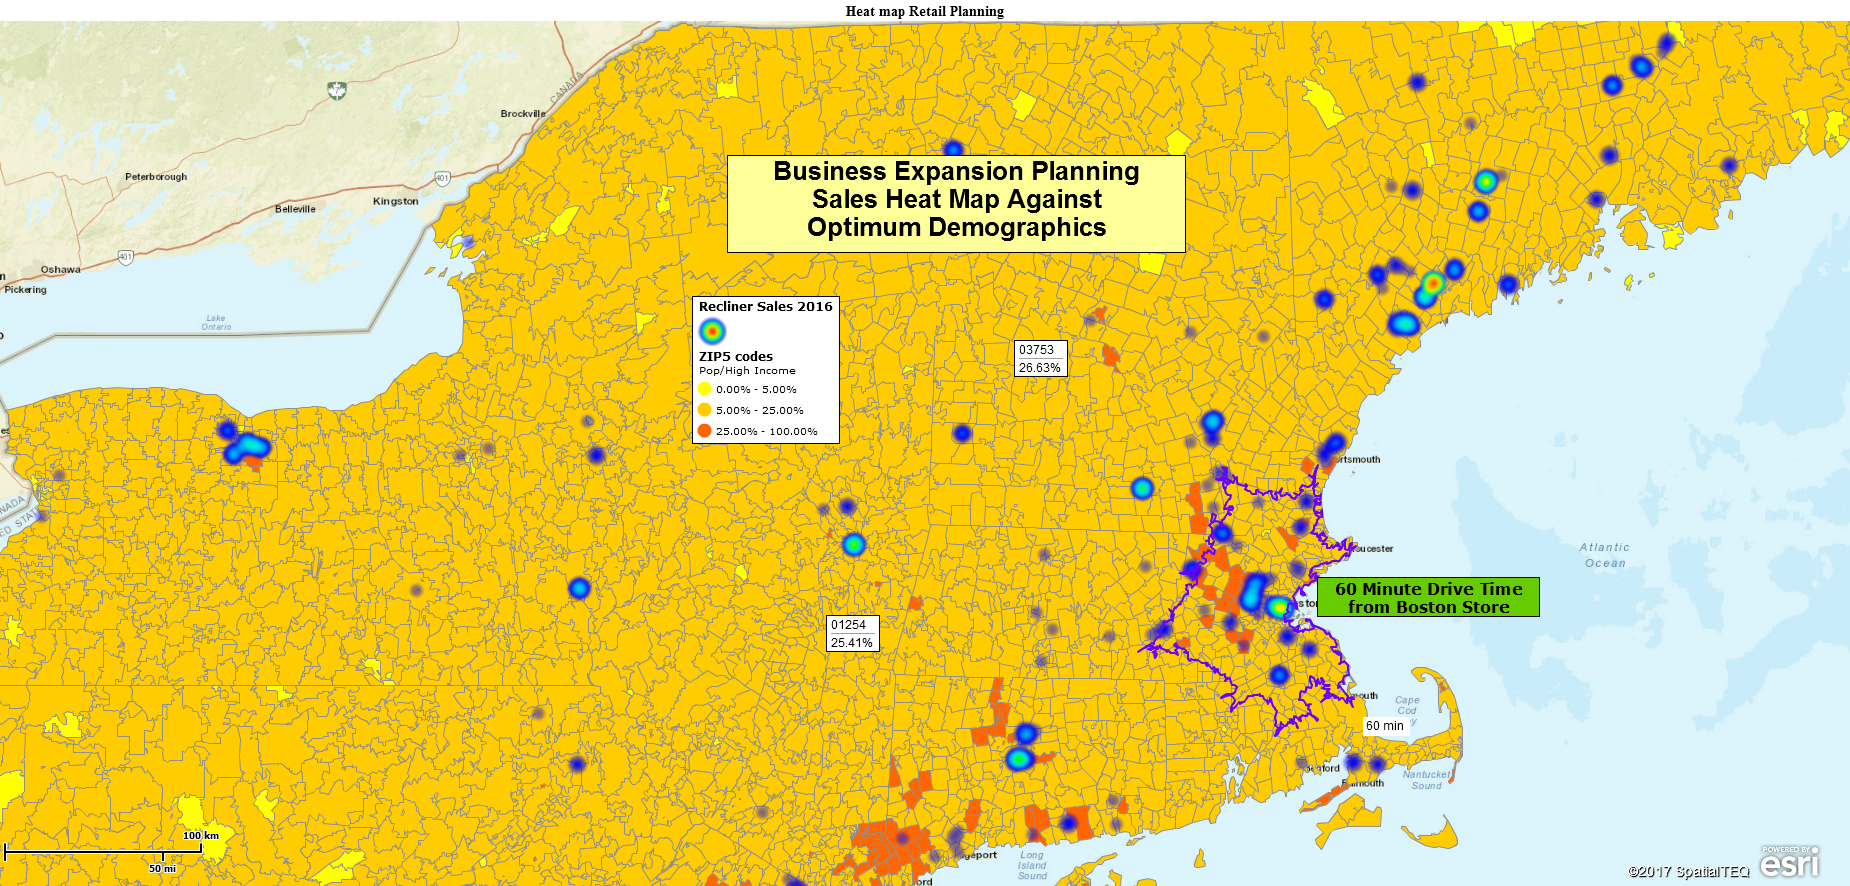
ABC uses MapBusinessOnline to graphically display where sales most often occur, and by omission, where they do not occur at all. ZIP code layer is turned on and color coded to reflect ZIP codes with the highest Median Income per Population, a ratio calculation. These rust red colored ZIP codes should be the best target areas for growth.
Next, a dataset of recliner sales by outlet address is imported into MapBusinessOnline and turned into a Heat Map layer. The brighter blue hot spots reflect areas of intense sales, the cooler darker spots show less sales, and again by omission, reflect areas with no sales that are under consideration for better representation.
How to Create a Retail Sales Heat Map
- Make sure your data records have at least two columns. One column for location and a second column with numeric data describing your subject – in this case, sales of recliners
- Import your location or address based dataset into MapBusinessOnline
- Click the Heat Map Button on the Master Toolbar
- Select your target data set and make sure the numeric data column is selected
- Choose an appropriate color scheme and an intensity setting
- Process your heat map
How to View the Heat Map Over Demographics
- Turn on the ZIP code layer
- In Map & Data, hover over the ZIP code layer and click the Edit Gear. Choose Manage Calculated Data Columns. Add a Data Column, name it, and pick the operation parameters – Overall Population/High Med Income
- Use the Color Code Map button, accessing your Calculated Data option (from 2) and color code ZIP codes to best reflect your target market
Your best ZIP codes for new showrooms supporting new sales opportunities will be ZIP codes with optimum demographics and no sales activity, and nearby ZIP codes with optimum demographics close to areas with maximum sales activity, perhaps within a specific drive time distance of existing stores – for example an hour’s drive away.
Learn How Our Customers are Succeeding with MapBusinessOnline
"I had an excellent experience with MapBusinessOnline because my company works in the agriculture industry and makes maps showing where our fields are and these maps need to be viewed and shared in a database. Your product seemed to fit our needs. Overall good support, ease of use, and quality of maps created!"
Seneca Foods

"Truly the easiest business mapping application I have ever used."
Chad Seaverns
National Sales Manager
www.nfdnetwork.com
"I just might possibly be in love with this service! This is the perfect program for my business."
Deborah Sterns


