Plot data from ACT!
This article demonstrates how to plot ACT! data records in MapBusinessOnline (MBO). Since there is no direct integration between ACT! and MBO, we will need to export data from ACT! first and then plot it in MBO.
Export data from ACT!
- Click Contacts or Groups in ACT! and open corresponding list view.

- Ensure that the list view has all the columns you wish to plot in MapBusinessOnline visible. Refer to the following article for more information on list view columns customization: How to customize List View columns in Act!
- Lookup the records you want to plot. Check for more information here: How to perform a lookup in Act!
- Choose Tools > Export to Excel in the menu or click Export Current List to Excel
 icon on the toolbar.
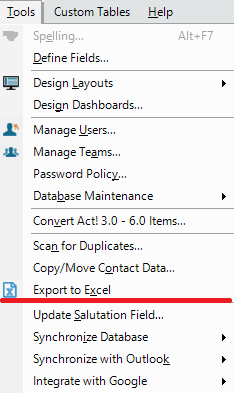
- Excel spreadsheet will popup with the data records exported.
Import data in MBO
Once ACT! data records are in Excel, you can either save them in a file and plot from there, or copy-paste the data records directly into MBO. Follow the instructions in Copy & paste data from spreadsheet article to plot your data.
Things you can do with ACT! data in MapBusinessOnline
- You can plot more than one dataset or records lookup on a map.
- Search data records on map inside a radius, polygon, or drivetime. For example, use this feature to create email marketing list of customers living within 5 miles of a new store.
- Visualize product sales by customer location: Color code dataset locations with circles.
- 4. Show product sales by ZIP code: Color code map or territories.


