Business Mapping Software
Why MapBusinessOnline?
- Easy to use - Just import a spreadsheet and go!
- Affordable – get the power of advanced business mapping without purchasing expensive GIS software.
- Comes with rich data collection – access geographic, demographic, and business listings data exportable in CSV format for use in business analysis and lead generation.
- Offers multiple business solutions - Map Visualizations, Territory Management, Market Analysis, Lead Generation, Drive Time Analysis, and more.
How do You Benefit from Business Mapping Software?
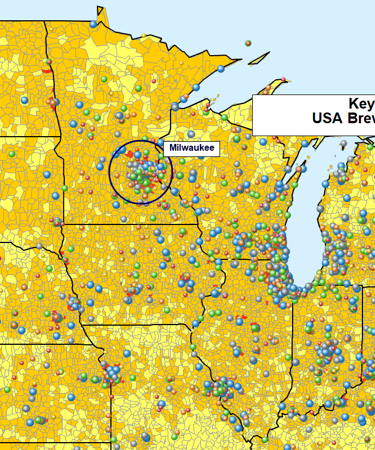
Visualize Your Business Geographically
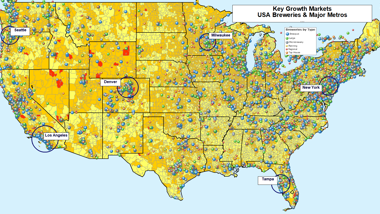
- Easily import business location-data such as customers, prospects, resources, and competitors.
- Create color-coded thematic maps that describe your business operations exposing trends and opportunities.
- Share compelling and informative map views with employees, clients, and vendors.
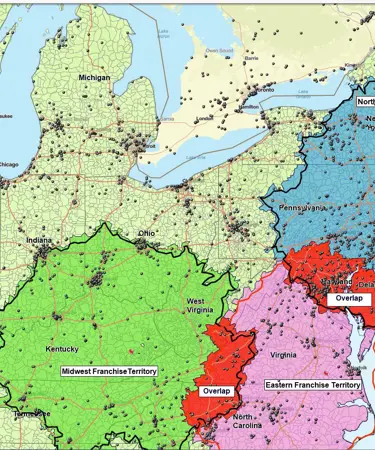
Create & Manage Territories
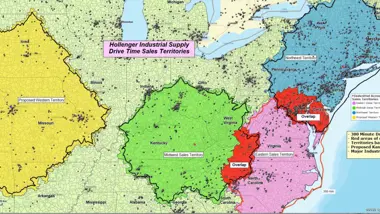
- Easily create sales and service territories that balance workloads and assign accountability while providing easy territory map sharing.
- Includes hierarchical territory support – Design territories, regions, and divisions with the flexibility to adjust layer naming conventions, boundaries & fill transparency.
- Generate franchise territories with demographically justified sales potential. Display available and sold franchise areas.
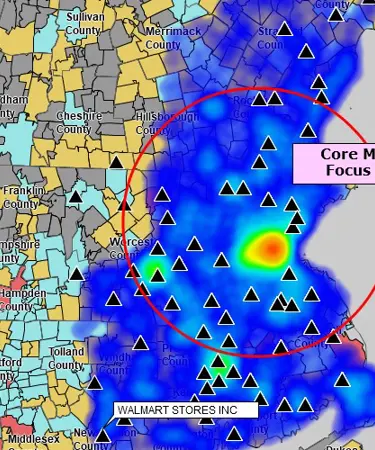
Market Analysis
- Identify New Markets - Identify and explore potential markets for your organization. Justify franchise investments.
- Conduct Site Selection - Overlay your business data, demographic variables, and business listings to select the best location for expanding your business.
- Create Map Visualizations from Marketing Data - Share illuminating business maps with the team for decision-making and planning.
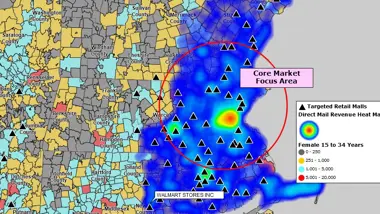
Lead Generation and Campaign Planning
- Find and visualize sales leads for call-out and direct mail campaigns by business name, industry, or area of interest. You can search the entire USA, or narrow your search by city, state, or ZIP code.
- Import competitor locations with firmographics for analysis of competing businesses segmented by area and industry.
- Segment leads by geography or demographic category. Prioritize marketing and sales activity by ZIP code, ethnicity, median income and more.
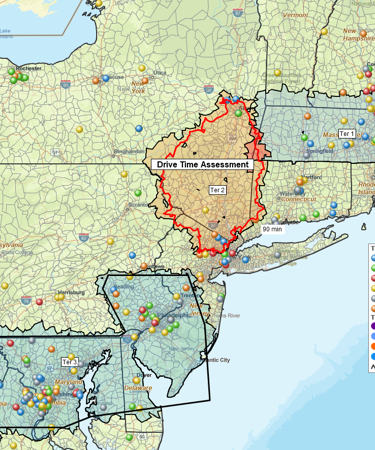
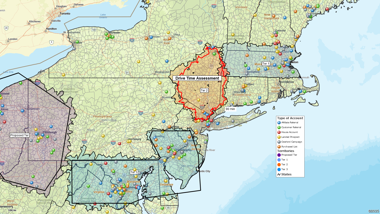
- Run proximity analysis around critical location points. Uncover industry prospects within a specified distance of a salesperson’s location. Find all competitors within a specified driving time.
Optimized Route Planning
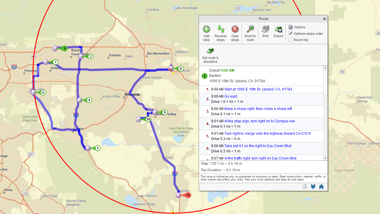
- Create optimized vehicle travel routes for traveling sales and technical staff.
- Share route files and business maps with the team – including view-only maps with optimized routing for non-editing users.
- Estimate travel expenses across your transportation system using driving time and distance calculations across thousands of addresses.
Learn How Our Customers are Succeeding with MapBusinessOnline
"Truly the easiest business mapping application I have ever used."
Chad Seaverns
National Sales Manager
www.nfdnetwork.com
"MapBusinessOnline.com has been an amazing tool for our company. It helps us to be more effective and efficient in our processes. It also provides a necessary tool for clear, concise communications with our team through visualization and supporting data."
Kim Scroggins
Map Coordinator
Leisure Pools

"I just wanted to say thank you for this amazing mapping tool! I've tried a number of sales territory map solutions and this is by far the best. I just (finally!) switched over from MapPoint and this is so much better, I wish I had switched sooner. Your videos and blog are also really helpful, though most things I have figured out on my own. It looks like I also have a lot more to discover as I explore the data visualization tools. Thanks again!"
Andrea Harrison
Business Analyst
Brainlab, Inc.


