How to Highlight ZIP Codes on a Map
Many first-time users of MapBusinessOnline business mapping software are looking for a mapping tool to plot ZIP codes on a map. Businesses of all types regularly map a list of ZIP codes to:
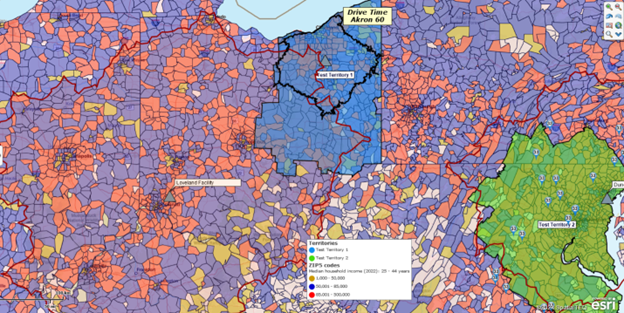
- Visualize or color-shade ZIP codes to reflect sales or business activity against an accurate map.
- Define sales territories or areas of interest on a ZIP code map.
- Visualize ZIP codes on a map with business data appended to a ZIP code label.
MapBusinessOnline enables all the above capabilities and so much more. But let us focus on the core need to visualize and map a list of ZIP codes.
Creating ZIP Code Maps
While MapBusinessOnline users may easily select one or more ZIP codes and create color-shaded areas manually with a few mouse clicks, importing a spreadsheet of ZIP codes is the fastest way to make a color-shaded ZIP code map. Clicking and holding the shift key will enable incremental ZIP code selection but using a polygon search tool for more than ten ZIP codes per area of interest is quicker.
As mentioned, the fast approach is to build a simple spreadsheet that lists your ZIP codes. Label a column in your spreadsheet as a ZIP code. Add all target ZIP codes to the ZIP column and import that data into Map Business Online.
Additional columns are not necessary but may be helpful for your project. You could, for instance, have columns for Territory Name, Sales History, Equipment, or Sales Rep. That all depends on you and your business requirements. The data will import precisely the same regardless of the number of columns you include.
By the way, MapBusinessOnline includes a complete and updated free ZIP code database for export and use on the map as a data layer. This ZIP code data consists of both Boundary and Point ZIP Codes.
Here are some suggestions on color-shading:
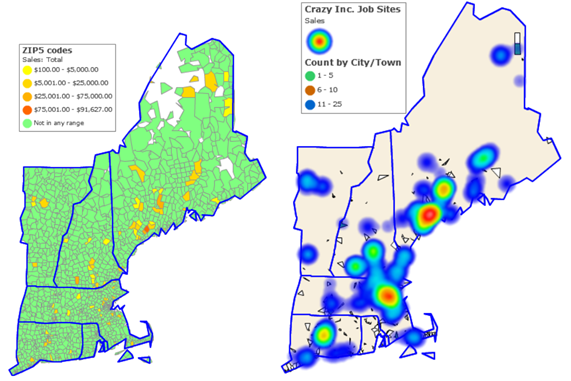
- To highlight specific ZIP code areas with business activity – Use one prominent color shade or consider creating a Heat Map.
- To display worst to best performance by ZIP code – Use color gradations.
- To designate X or Y options – Use two colors.
Below are more aspects of color shading ZIP codes that you may want to keep in mind:
- The maximum number of color shades is one hundred.
- You can hide or change the default color of non-impacted ZIP codes.
- Unique value and Exclude values options can come in handy occasionally—this helps to make larger, more varied datasets easier to classify.
- It's easy and fast to reconfigure a ZIP code color scheme again.
Or Just Create Territories from a ZIP Code List
Another way to create those color-shaded ZIP areas is to add a Name column to your simple ZIP code list and import the list using the Create Territories button. You’d have one column for ZIP codes and another for a territory name or list of names.
This import process is nearly identical to the Plot Data process until it moves to the Create Territory function. Instead of using the Plot Data Button, move one more button to the right and click Create Territories. Once in the Create Territory dialogue, you will match your ZIP code map layer and the Name columns to the appropriate MapBusinessOnline input fields. Read more on importing territories from file.
Don’t be intimidated by the concept of territories. You will not be required to use territories complexly; territories can just be shaded ZIP codes if you want to keep it simple.
Leverage Your Imported Data
You may have business lists by address that include ZIP codes. There is no need to delete the columns that are not ZIP codes to import, just the ZIPs. Import the data as described above and set the extra columns to None as you process the address dialogue into MapBusinessOnline. Your data will behave just like an imported ZIP code list.
With your data imported into MapBusinessOnline, the application allows the map user access to all imported data for various visualization and analysis operations. In addition to color-shading by ZIP code area or ZIP code point, that data is available for territory management, market analysis, data window filtering, and market analysis.