3 Maps to Review Your Territories and Find New Markets

When you are making your sales and growth plans, three questions matter a lot:
- Are your territories aligned with what’s really happening on the ground?
- Are those territories balanced across sales reps and regions?
- Are you focusing on the right markets to support growth?
Here are three practical maps you can build in MapBusinessOnline to answer those questions quickly.
Map 1 – Territory Reality Check (Customers vs. Current Territories)
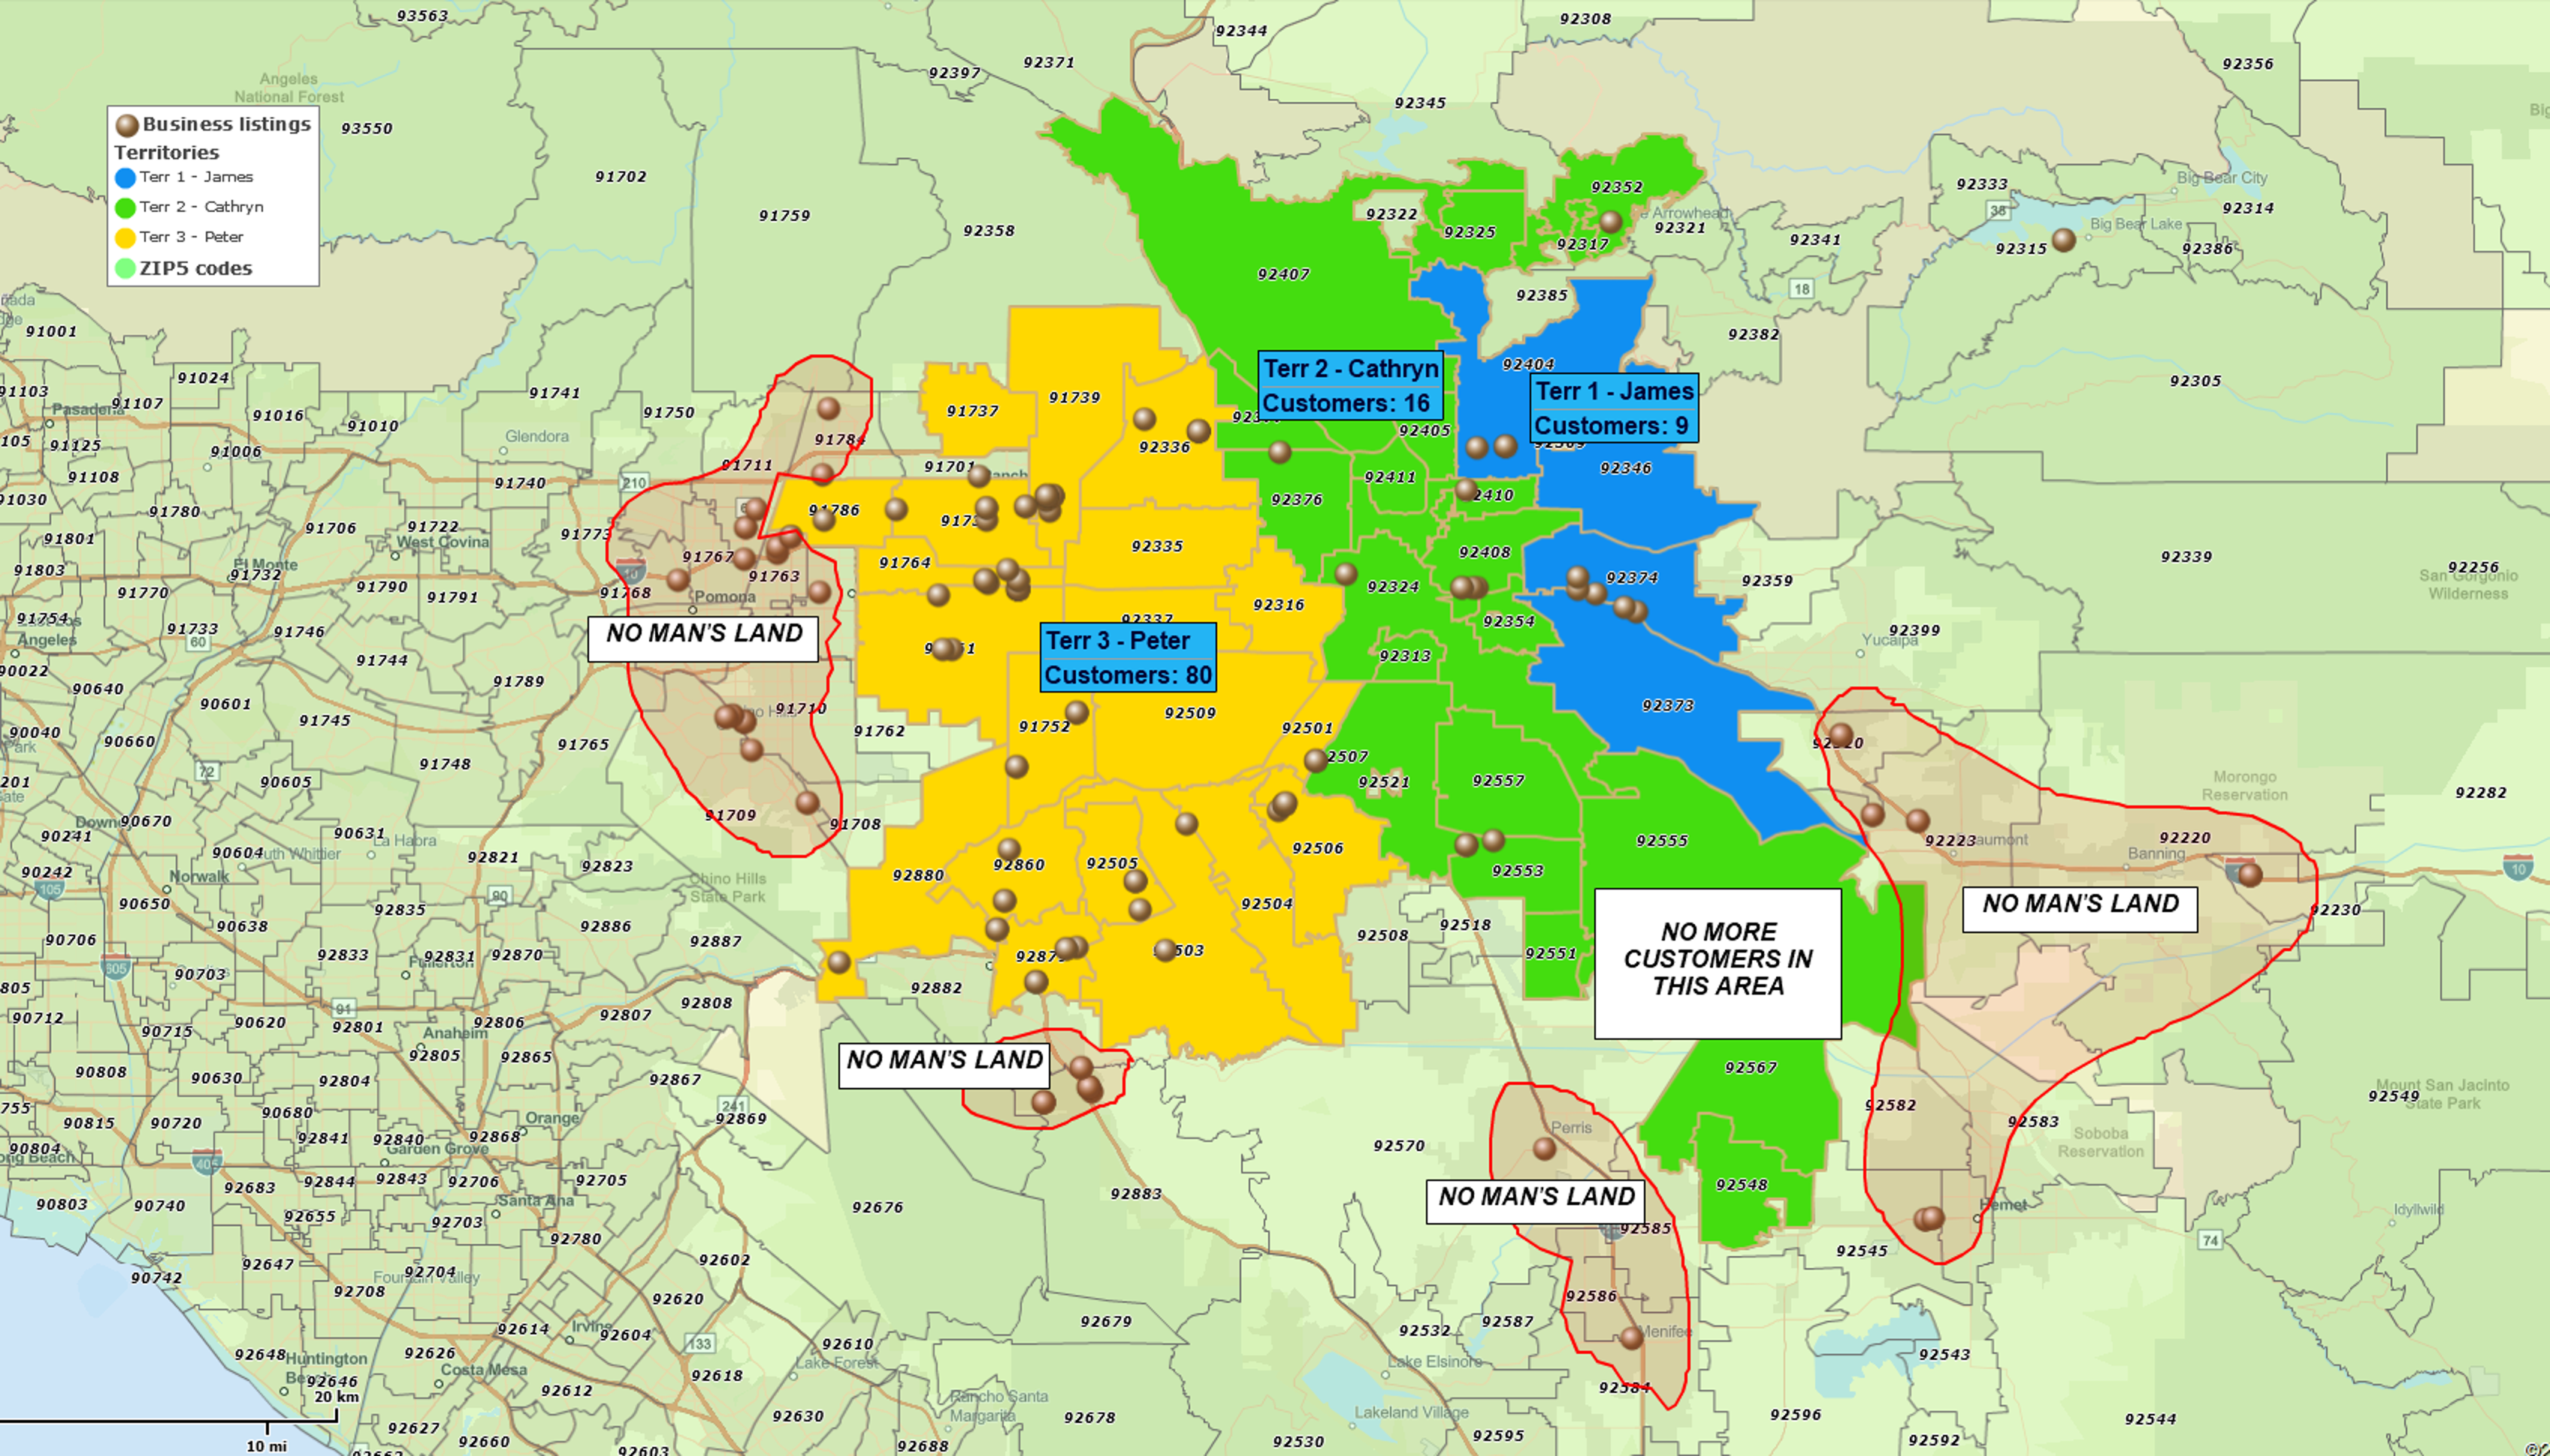
What this map tells you
- Where your customers actually cluster
- Whether your current territories still make sense
- Which areas are effectively “no man’s land”
What to do in MapBusinessOnline
- Import your latest customer list (with addresses or ZIP codes)
- Import your current territory assignments (e.g. ZIP code with assigned rep name spreadsheet)
- Use a simple symbol or density/heat map view for customers dataset so clusters stand out
- Label territories with customer count or revenue values so imbalances are obvious
What to look for
- Territories that have lots of customers far from the assigned rep’s base
- ZIPs or counties that have customers but no clear territory ownership
- Territories that look “fine” in a list but are clearly oversized or oddly shaped on the map
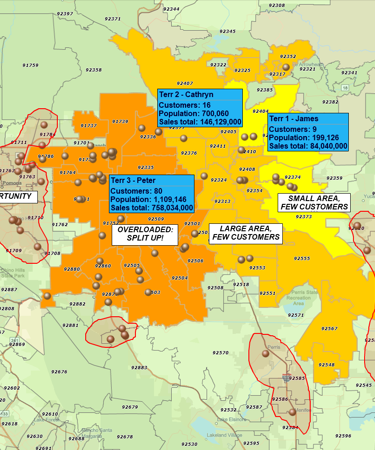
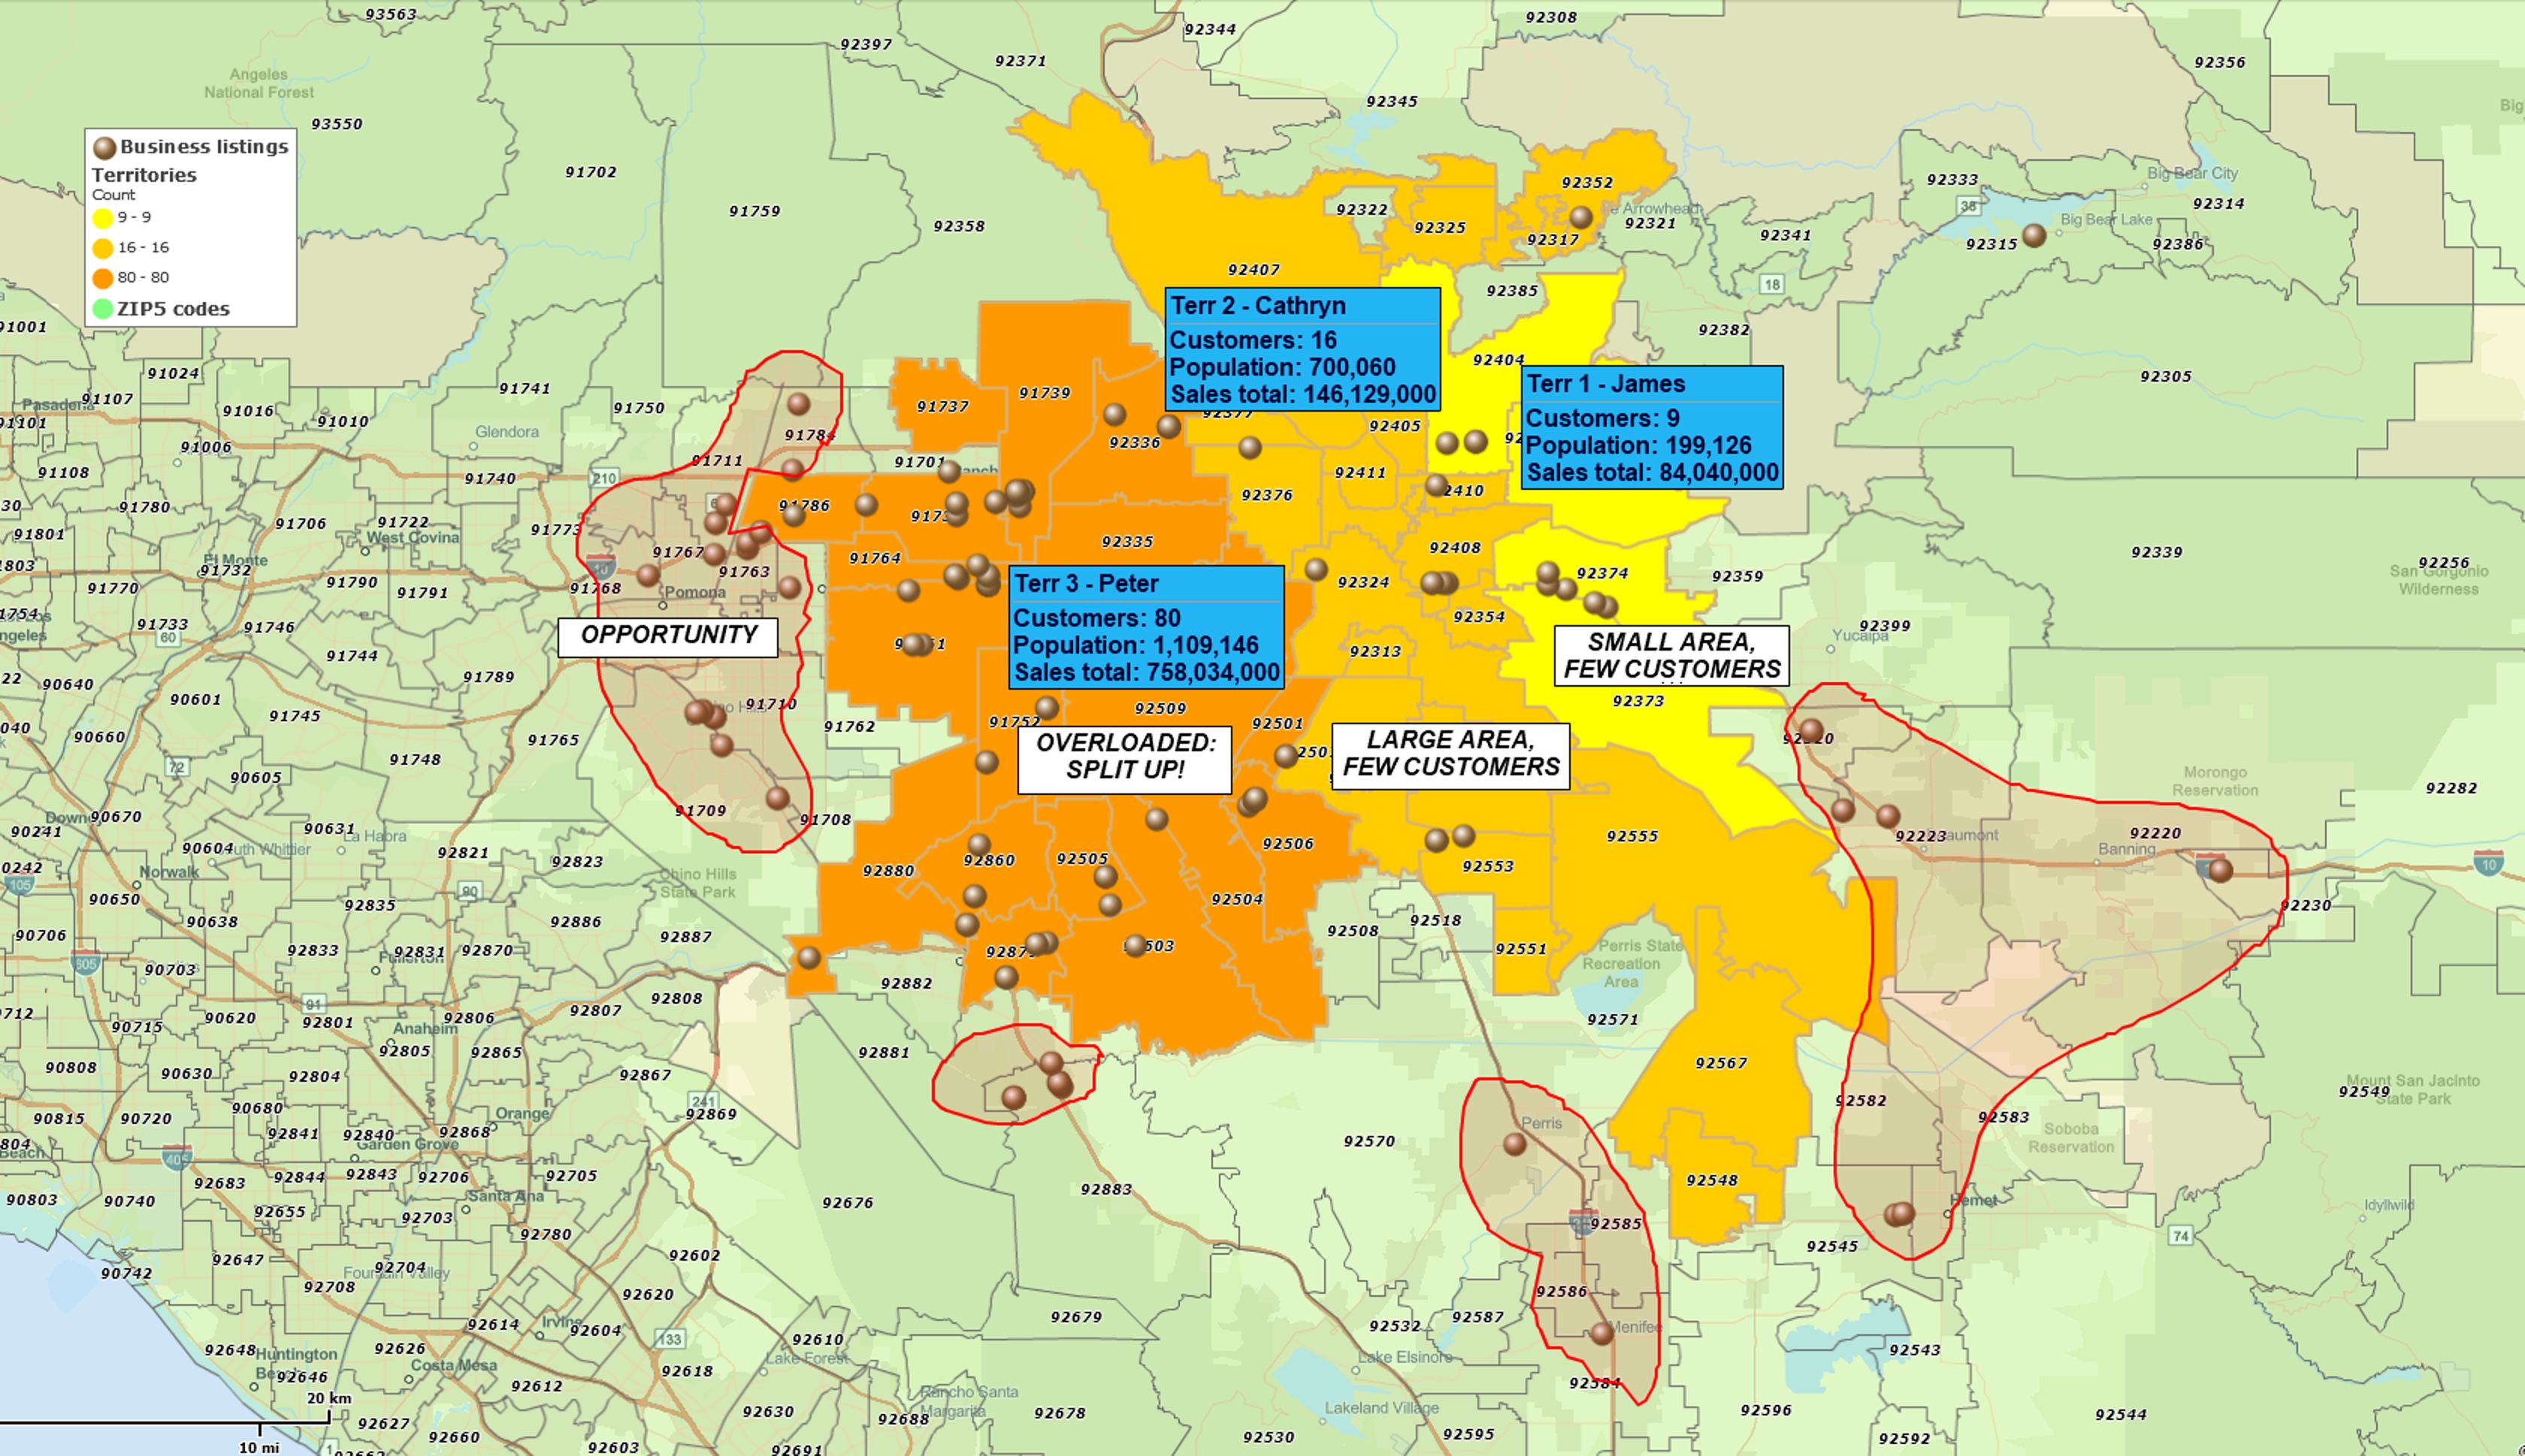
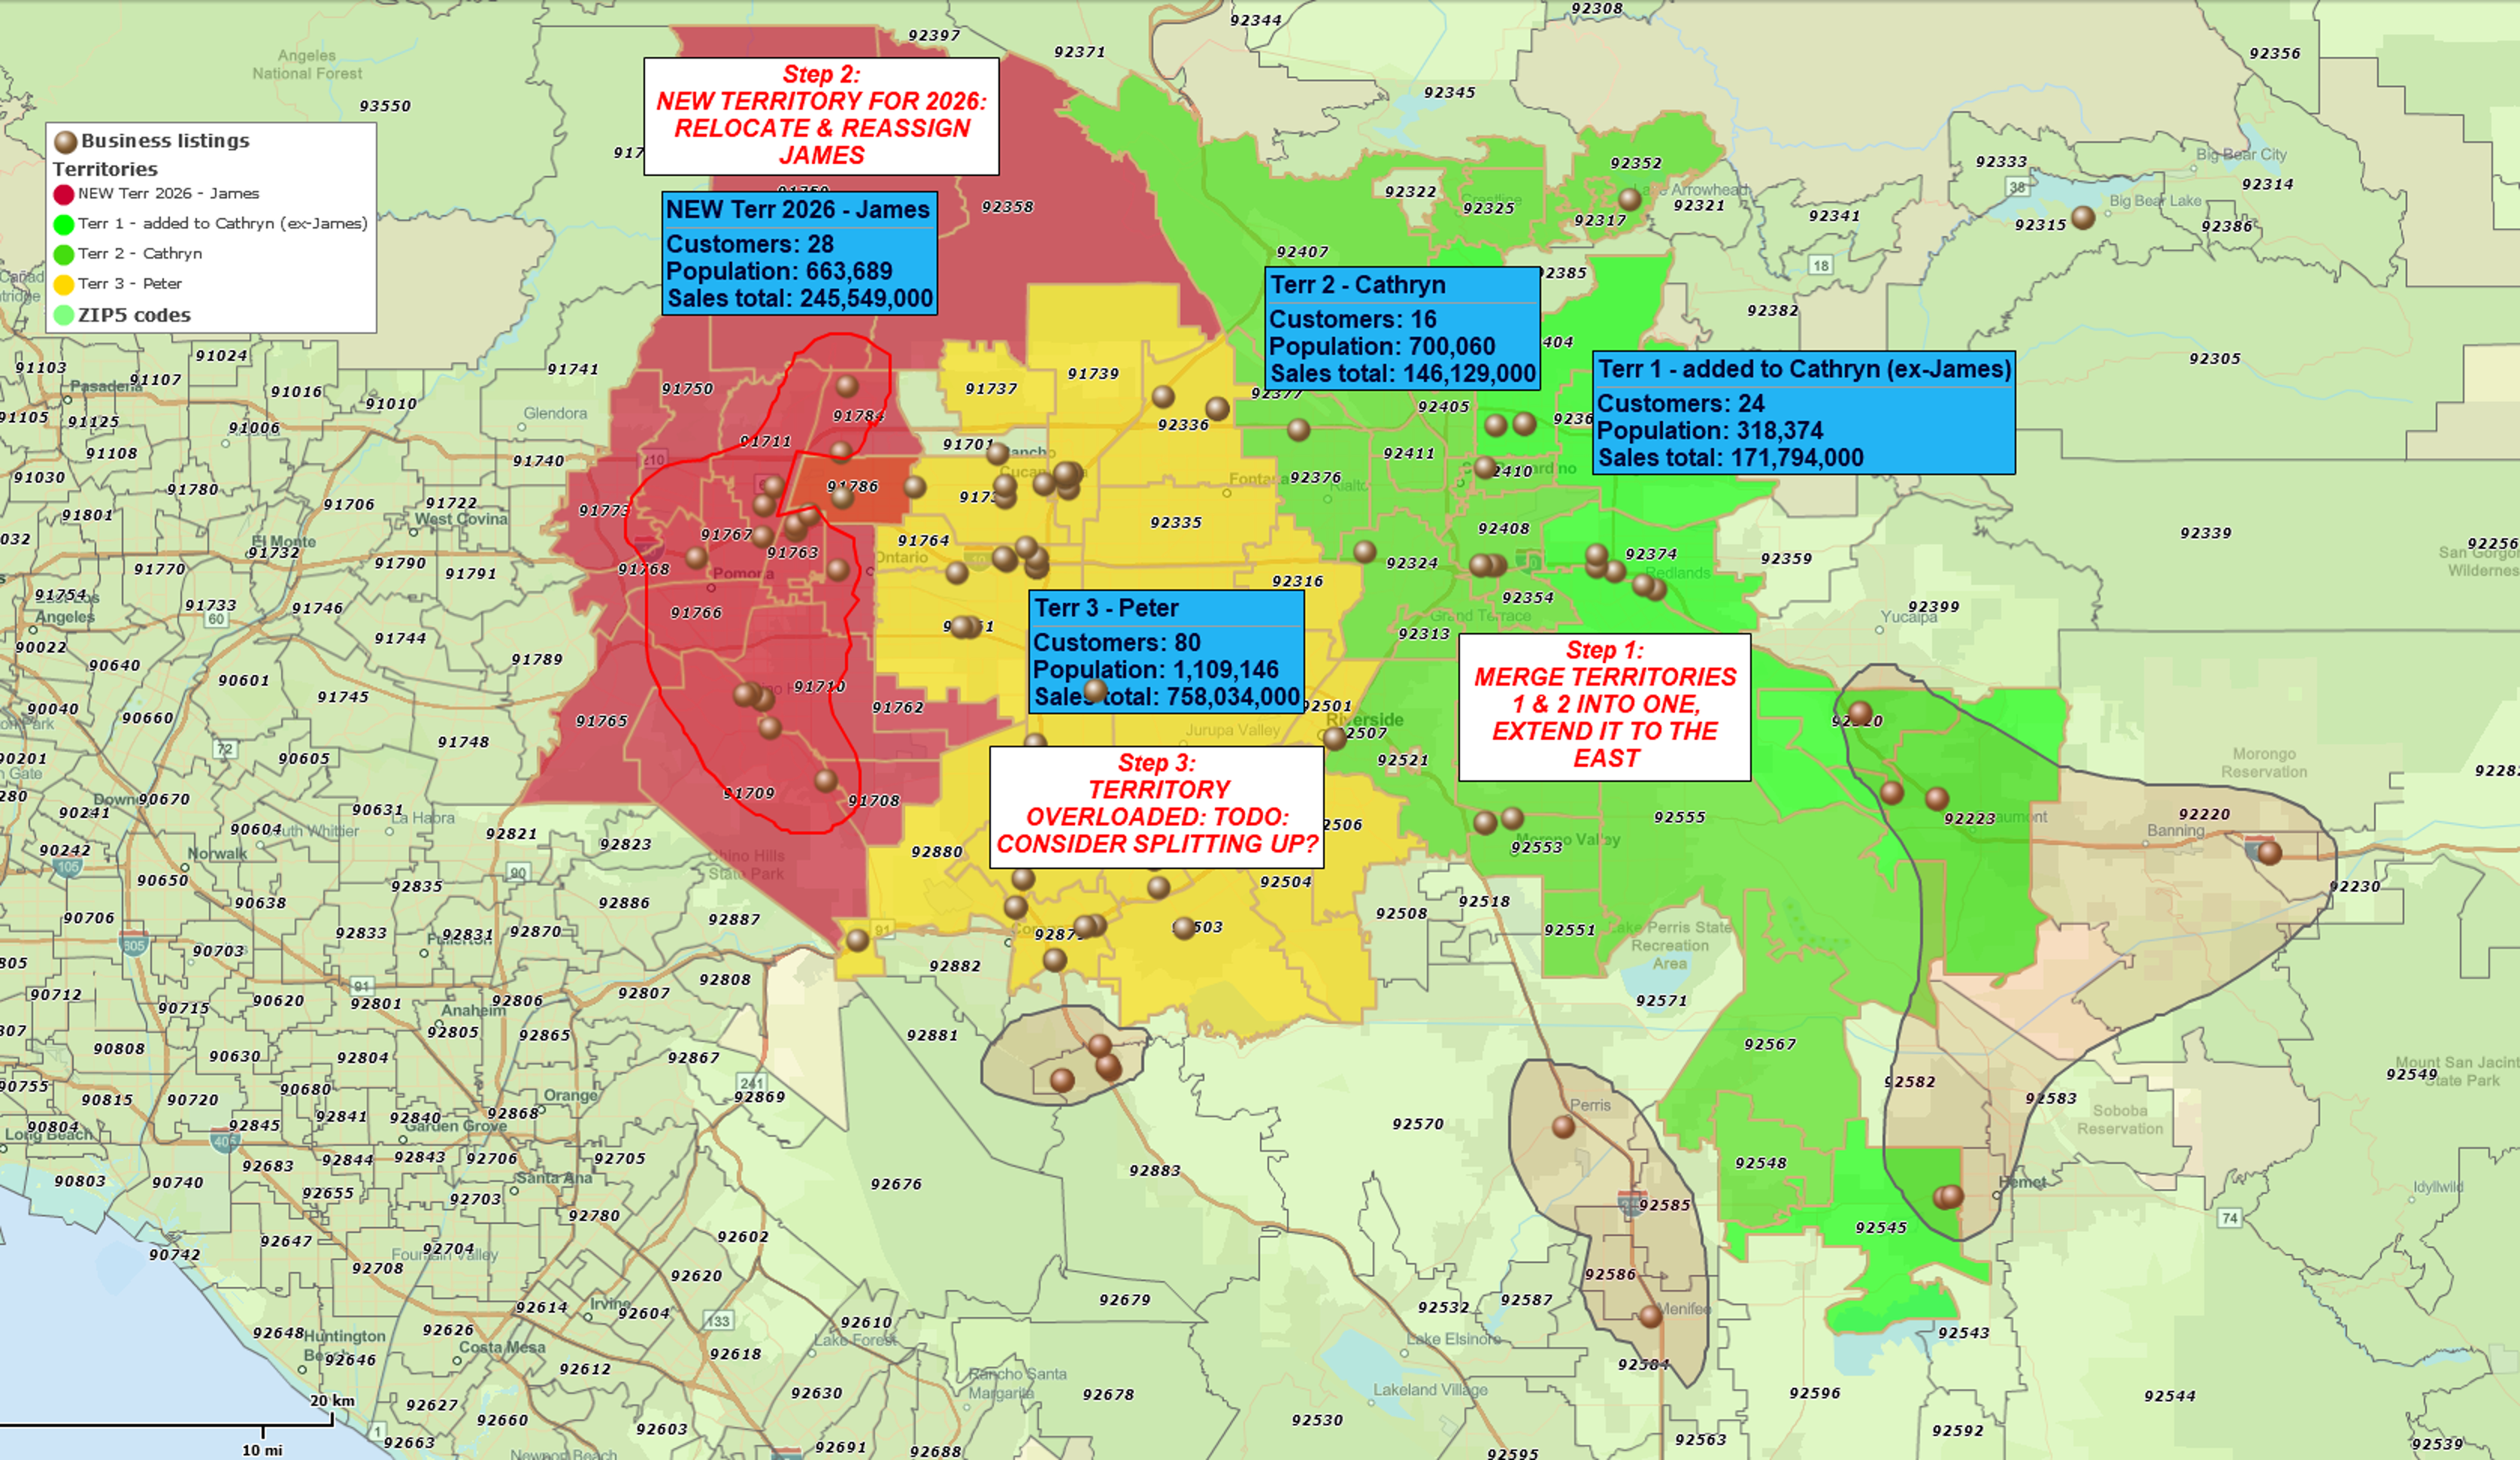
Map 2 – Territory Balance Map (Workload vs. Opportunity)
What this map tells you
- Which territories are overloaded with accounts or revenue
- Which territories have too little opportunity for the current coverage
- Whether your sales quotas and expectations are realistic
What to do in MapBusinessOnline
- Start with your territory map in Map 1
- Color-code territories by:
- Number of customers, or
- Total revenue/sales potential
- Add key demographic or business data in the background (for example, population, households, or businesses filtered by NAICS industry code in your target segment)
- Compare territory workload (customers/revenue) to market potential (demographics/business counts)
What to look for
- Territories that carry far more customers or revenue than neighboring territories
- Very large territories with relatively few accounts
- Territories where potential is high but performance is lagging (prime candidates for extra focus)
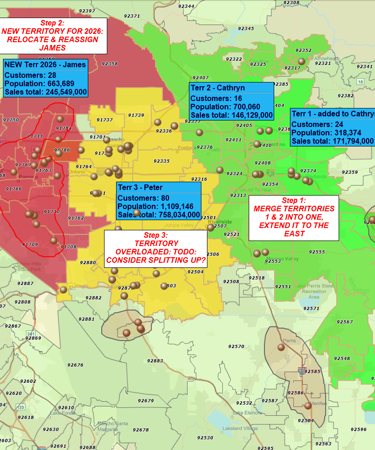
Map 3 – Growth Map (New Potential Markets and Whitespace)
What this map tells you
- Which areas look like your best-performing territories but have low penetration
- Where you have clear whitespace for campaigns, new reps, or new locations
- Which markets to grow, defend, or monitor going forward
What to do in MapBusinessOnline
- Pick one or two of your best territories from Map 2 (strong performance and strong potential)
- Note their common traits: customer density, revenue, key demographics, business mix
- Highlight ZIPs or counties outside of your current coverage that:
- Match your “best territory” characteristics, and
- Have few or no customers in your data
What to look for
- High-potential ZIPs or regions sitting just outside or between your current territories
- Natural candidates for:
- Territory splits or new territories
- Targeted campaigns
- New locations or partner focus
Sharing the Results with Your Team
Once you’ve built any of these maps, you can:
- Export maps as images or PDFs for planning decks and leadership reviews
- Share live interactive maps with colleagues so they can zoom in, filter, and explore the data themselves
That changes territory and market discussions from spreadsheet debates into map-based conversations everyone can see and understand.
Related Reading
How to Prepare for Sales Territory Mapping — a short overview of key territory planning concepts.
Territory Mapping Overview — a practical guide to working with territory tools inside MapBusinessOnline.


