Estimate Market Penetration Based on % of Population Covered
What Percent of the Population Is Within Reach of Our Locations?
Businesses often ask a similar market coverage question: "What percentage of the population is within a certain mileage range of our locations – and what percentage is outside that range?"
For example, an organization with many partner, store, facility, or service locations may want to estimate how much of the U.S. population lives within 100 miles of at least one location. At first, the answer looks like this: plot all locations, draw 100-mile circles around those locations, summarize the population inside each circle, and compare that total with the U.S. population.
Doing this with multiple locations requires business mapping software like MapBusinessOnline Pro – which makes it easy enough even for a business user without GIS experience.
But there is an extra problem: many radius areas can overlap. If each circle is summarized separately, the same population may be counted more than once. That can overstate market coverage and understate the population not covered. For coverage analysis, the goal is not “population inside each radius.” The goal is “unique population covered by at least one location.”
Avoid Double-Counting Population with One Coverage Territory
Instead of adding up separate radius summaries, create a territory from the geographic units that fall within the radius areas – and calculate the population of this territory.
In this case, Census tracts are the best option available in MapBusinessOnline because they are more granular than states, counties, or ZIP codes. More granular areas give a closer approximation of the population covered by the radius areas. Note that they are still an approximation because the method selects whole Census tracts, not partial tract fragments. But for many business planning questions, that is a much more reliable approach than summing overlapping radius totals.
When calculating the population of the resultant territory, each selected Census tract is counted once, even if it falls within overlapping radius areas. This helps avoid the double-counting problem.
Who Can Use This Workflow?
This workflow can help organizations answer questions such as:
- What population is within reach of our service network?
- Which regions are outside our current coverage?
- Where do we need more partners, stores, reps, or facilities?
- Are we strong in the right markets or just present in them?
- Where should we prioritize expansion or outreach?
Relevant audiences:
- Healthcare networks
- Franchise systems
- Retail location planners
- Field service organizations
- Sales operations teams
- Distribution and service networks
- And more.
Step-by-Step Workflow in MapBusinessOnline Pro
Step 1: Plot Your Location Dataset
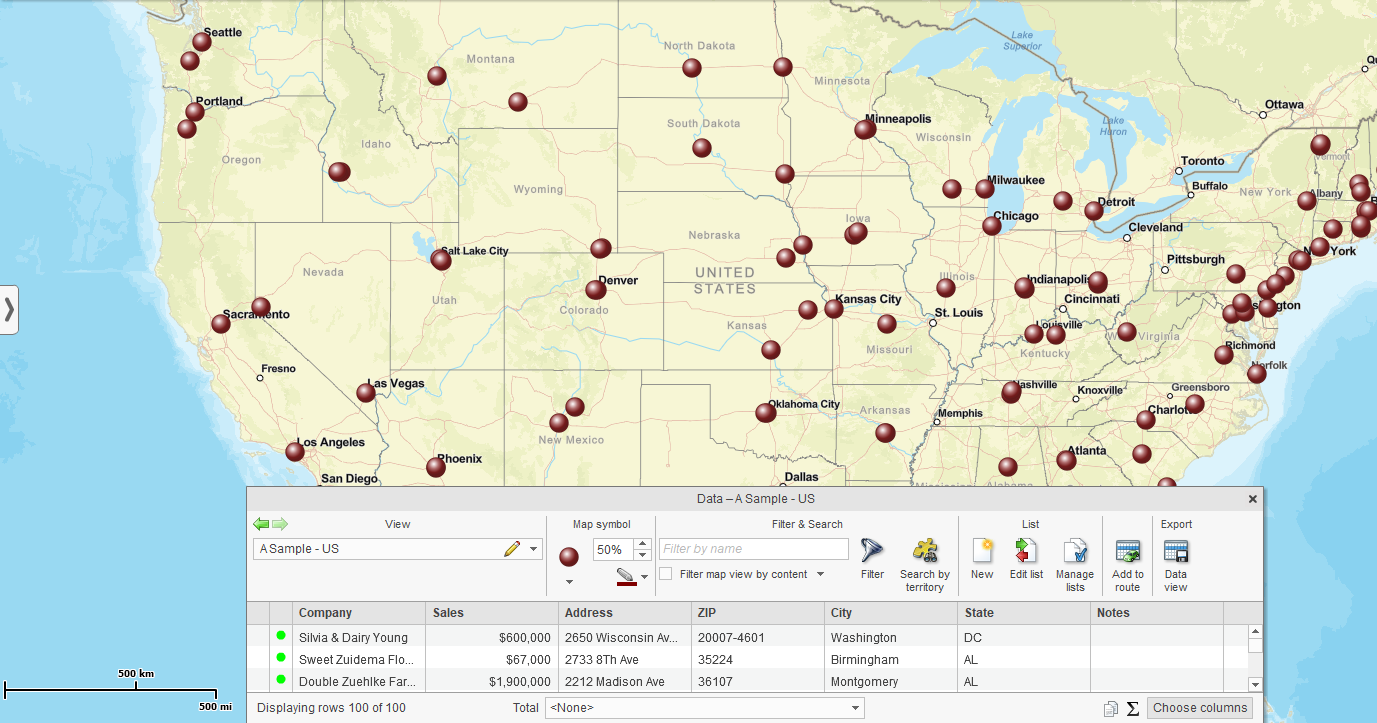
Plot the partner locations, stores, facilities, branches, service centers, or other center points:
Step 2: Add Census Tracts to the Map
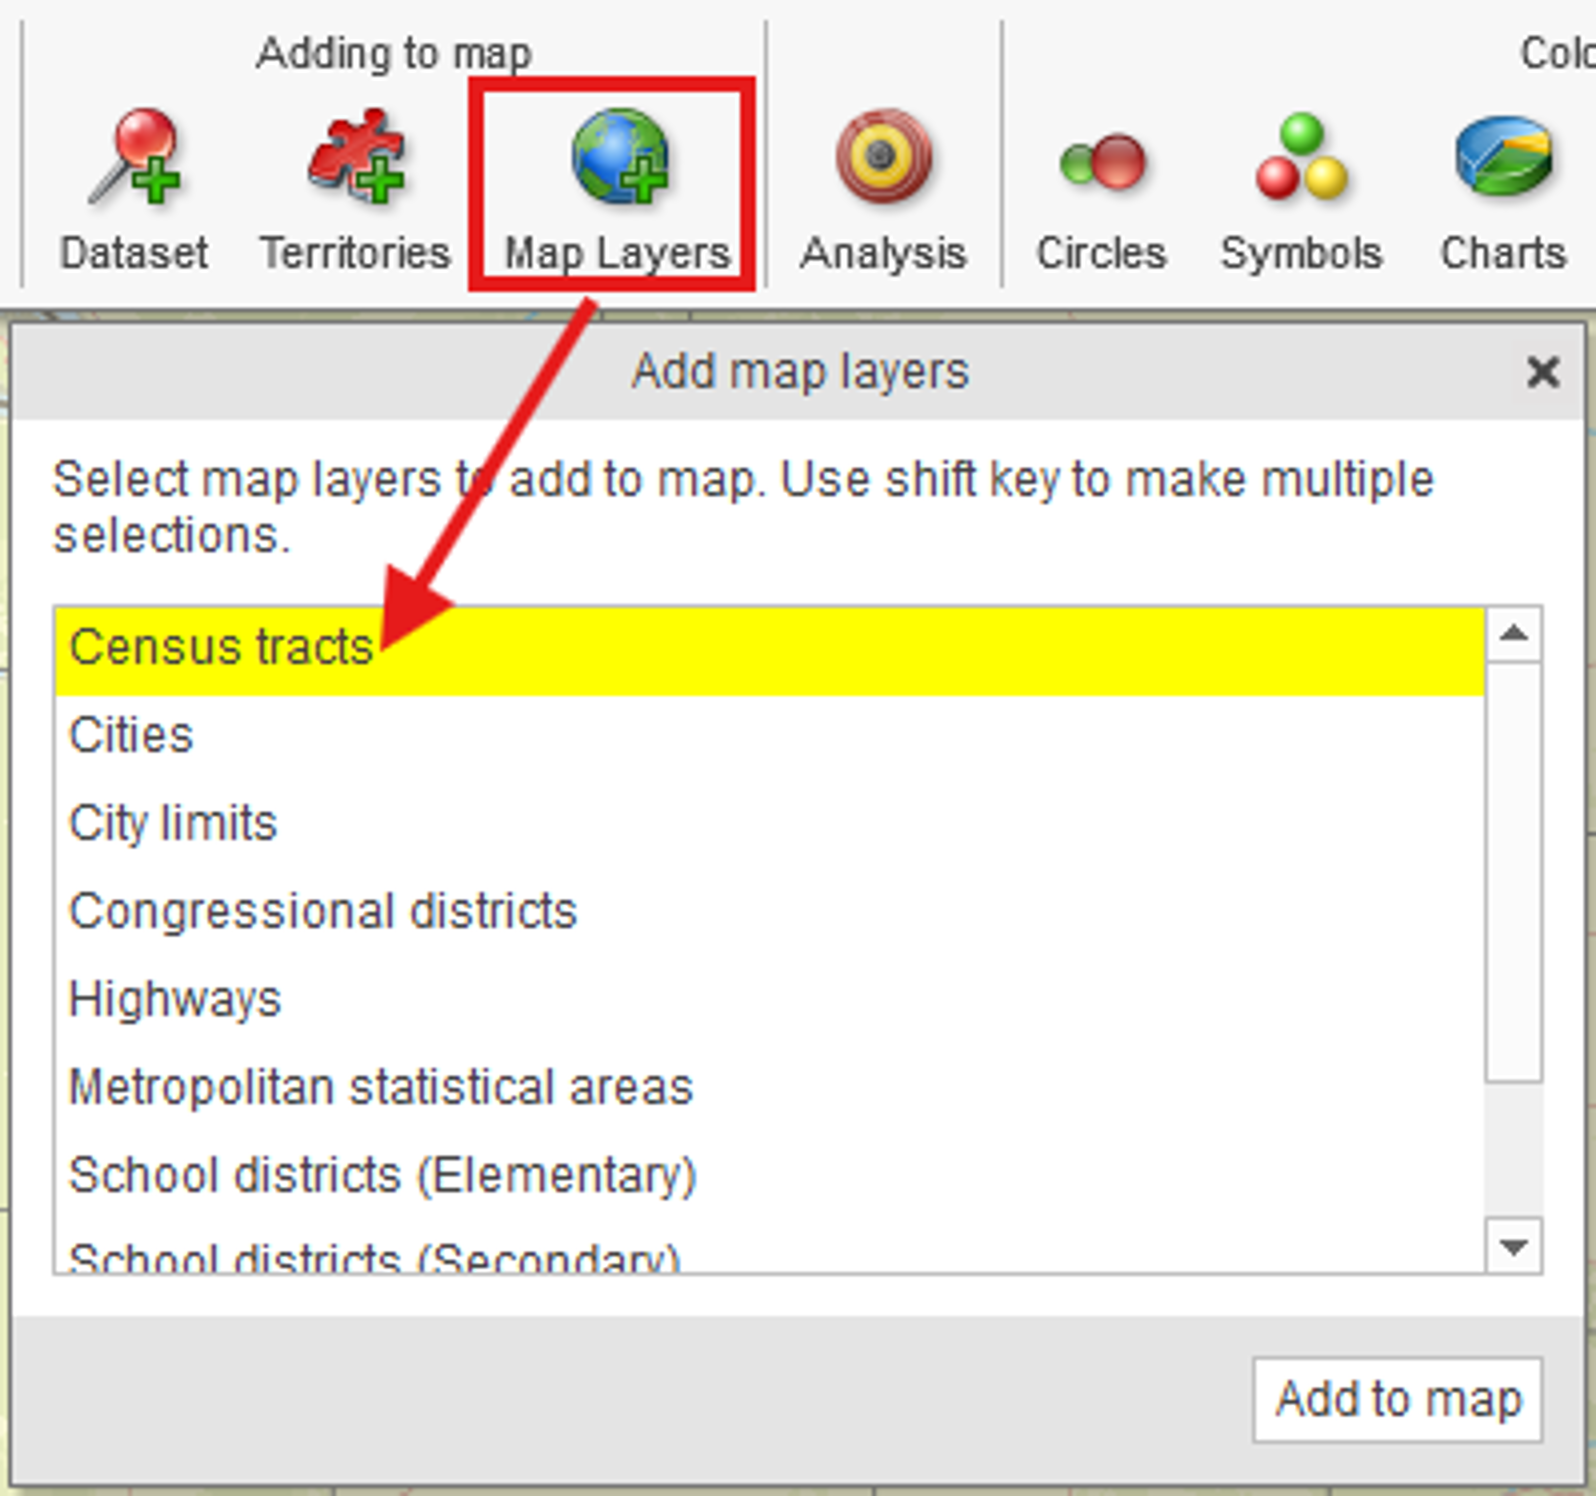
Turn on Census tracts as the geographic layer for the analysis:
Step 3: Run the “Search and Segment Data from Multiple Centers” Tool
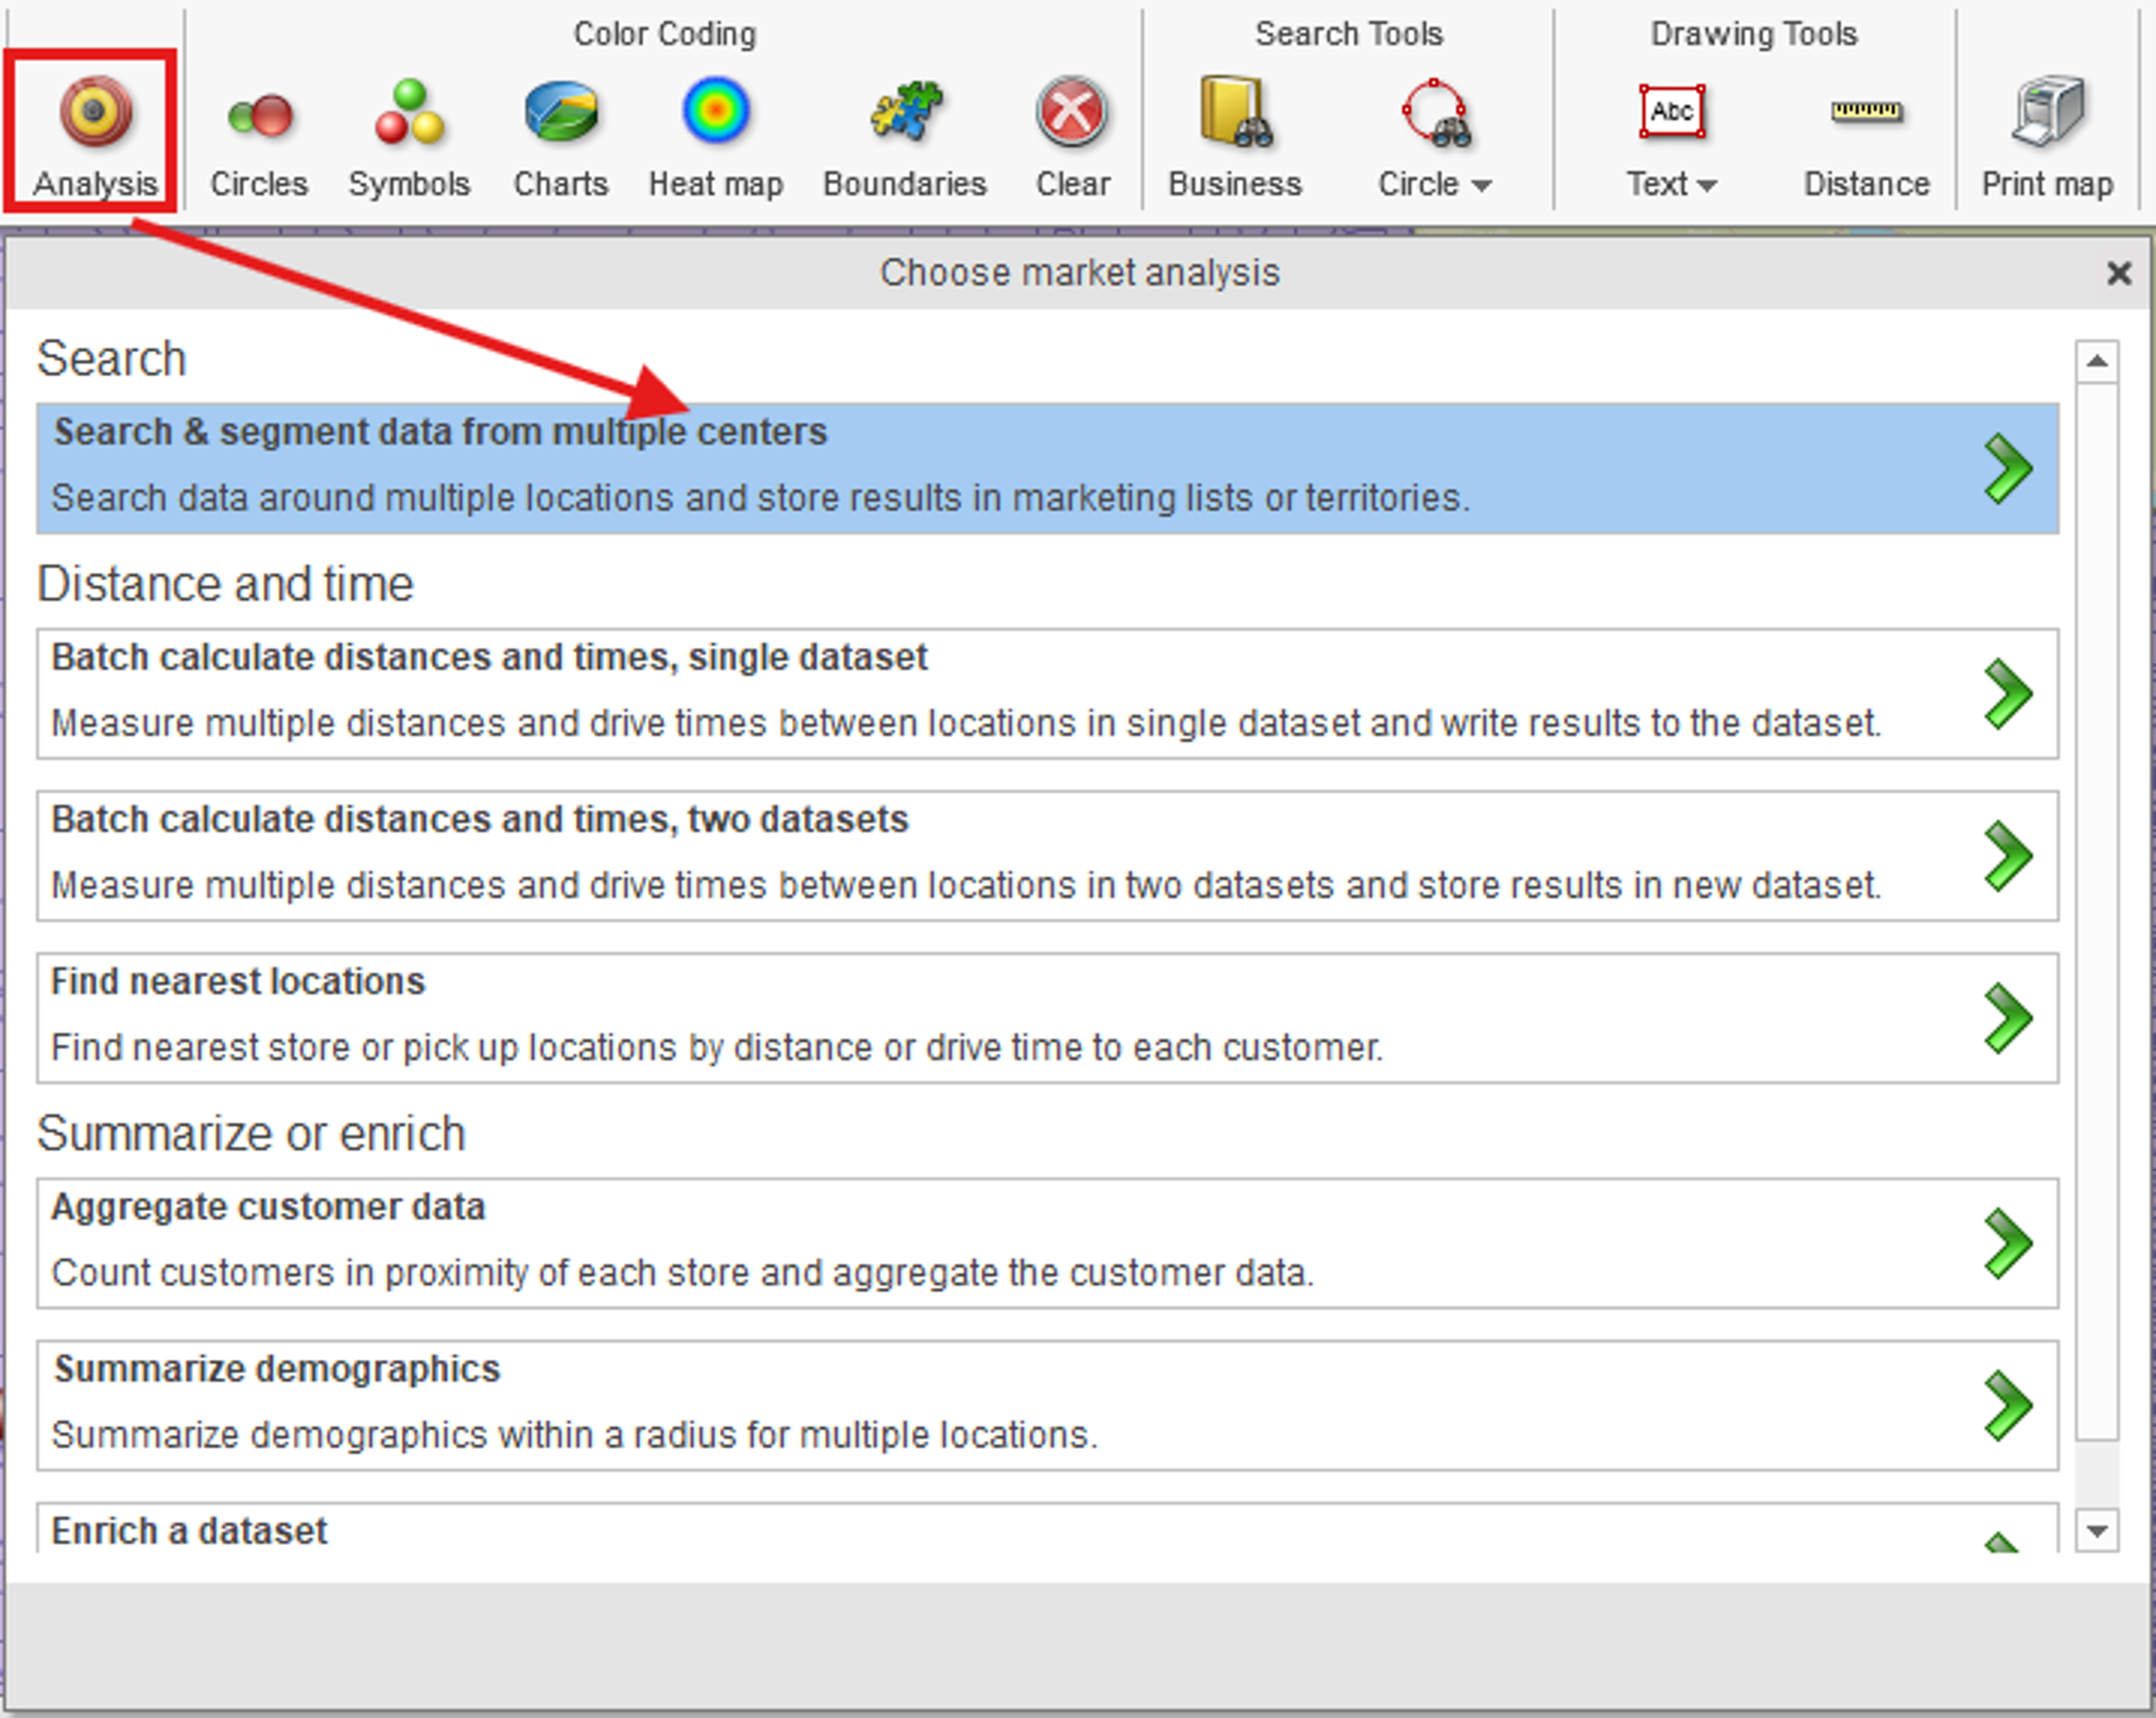
Run the Market Analysis tool “Search & segment data from multiple centers”:
Set the desired mileage range, such as 100 miles:
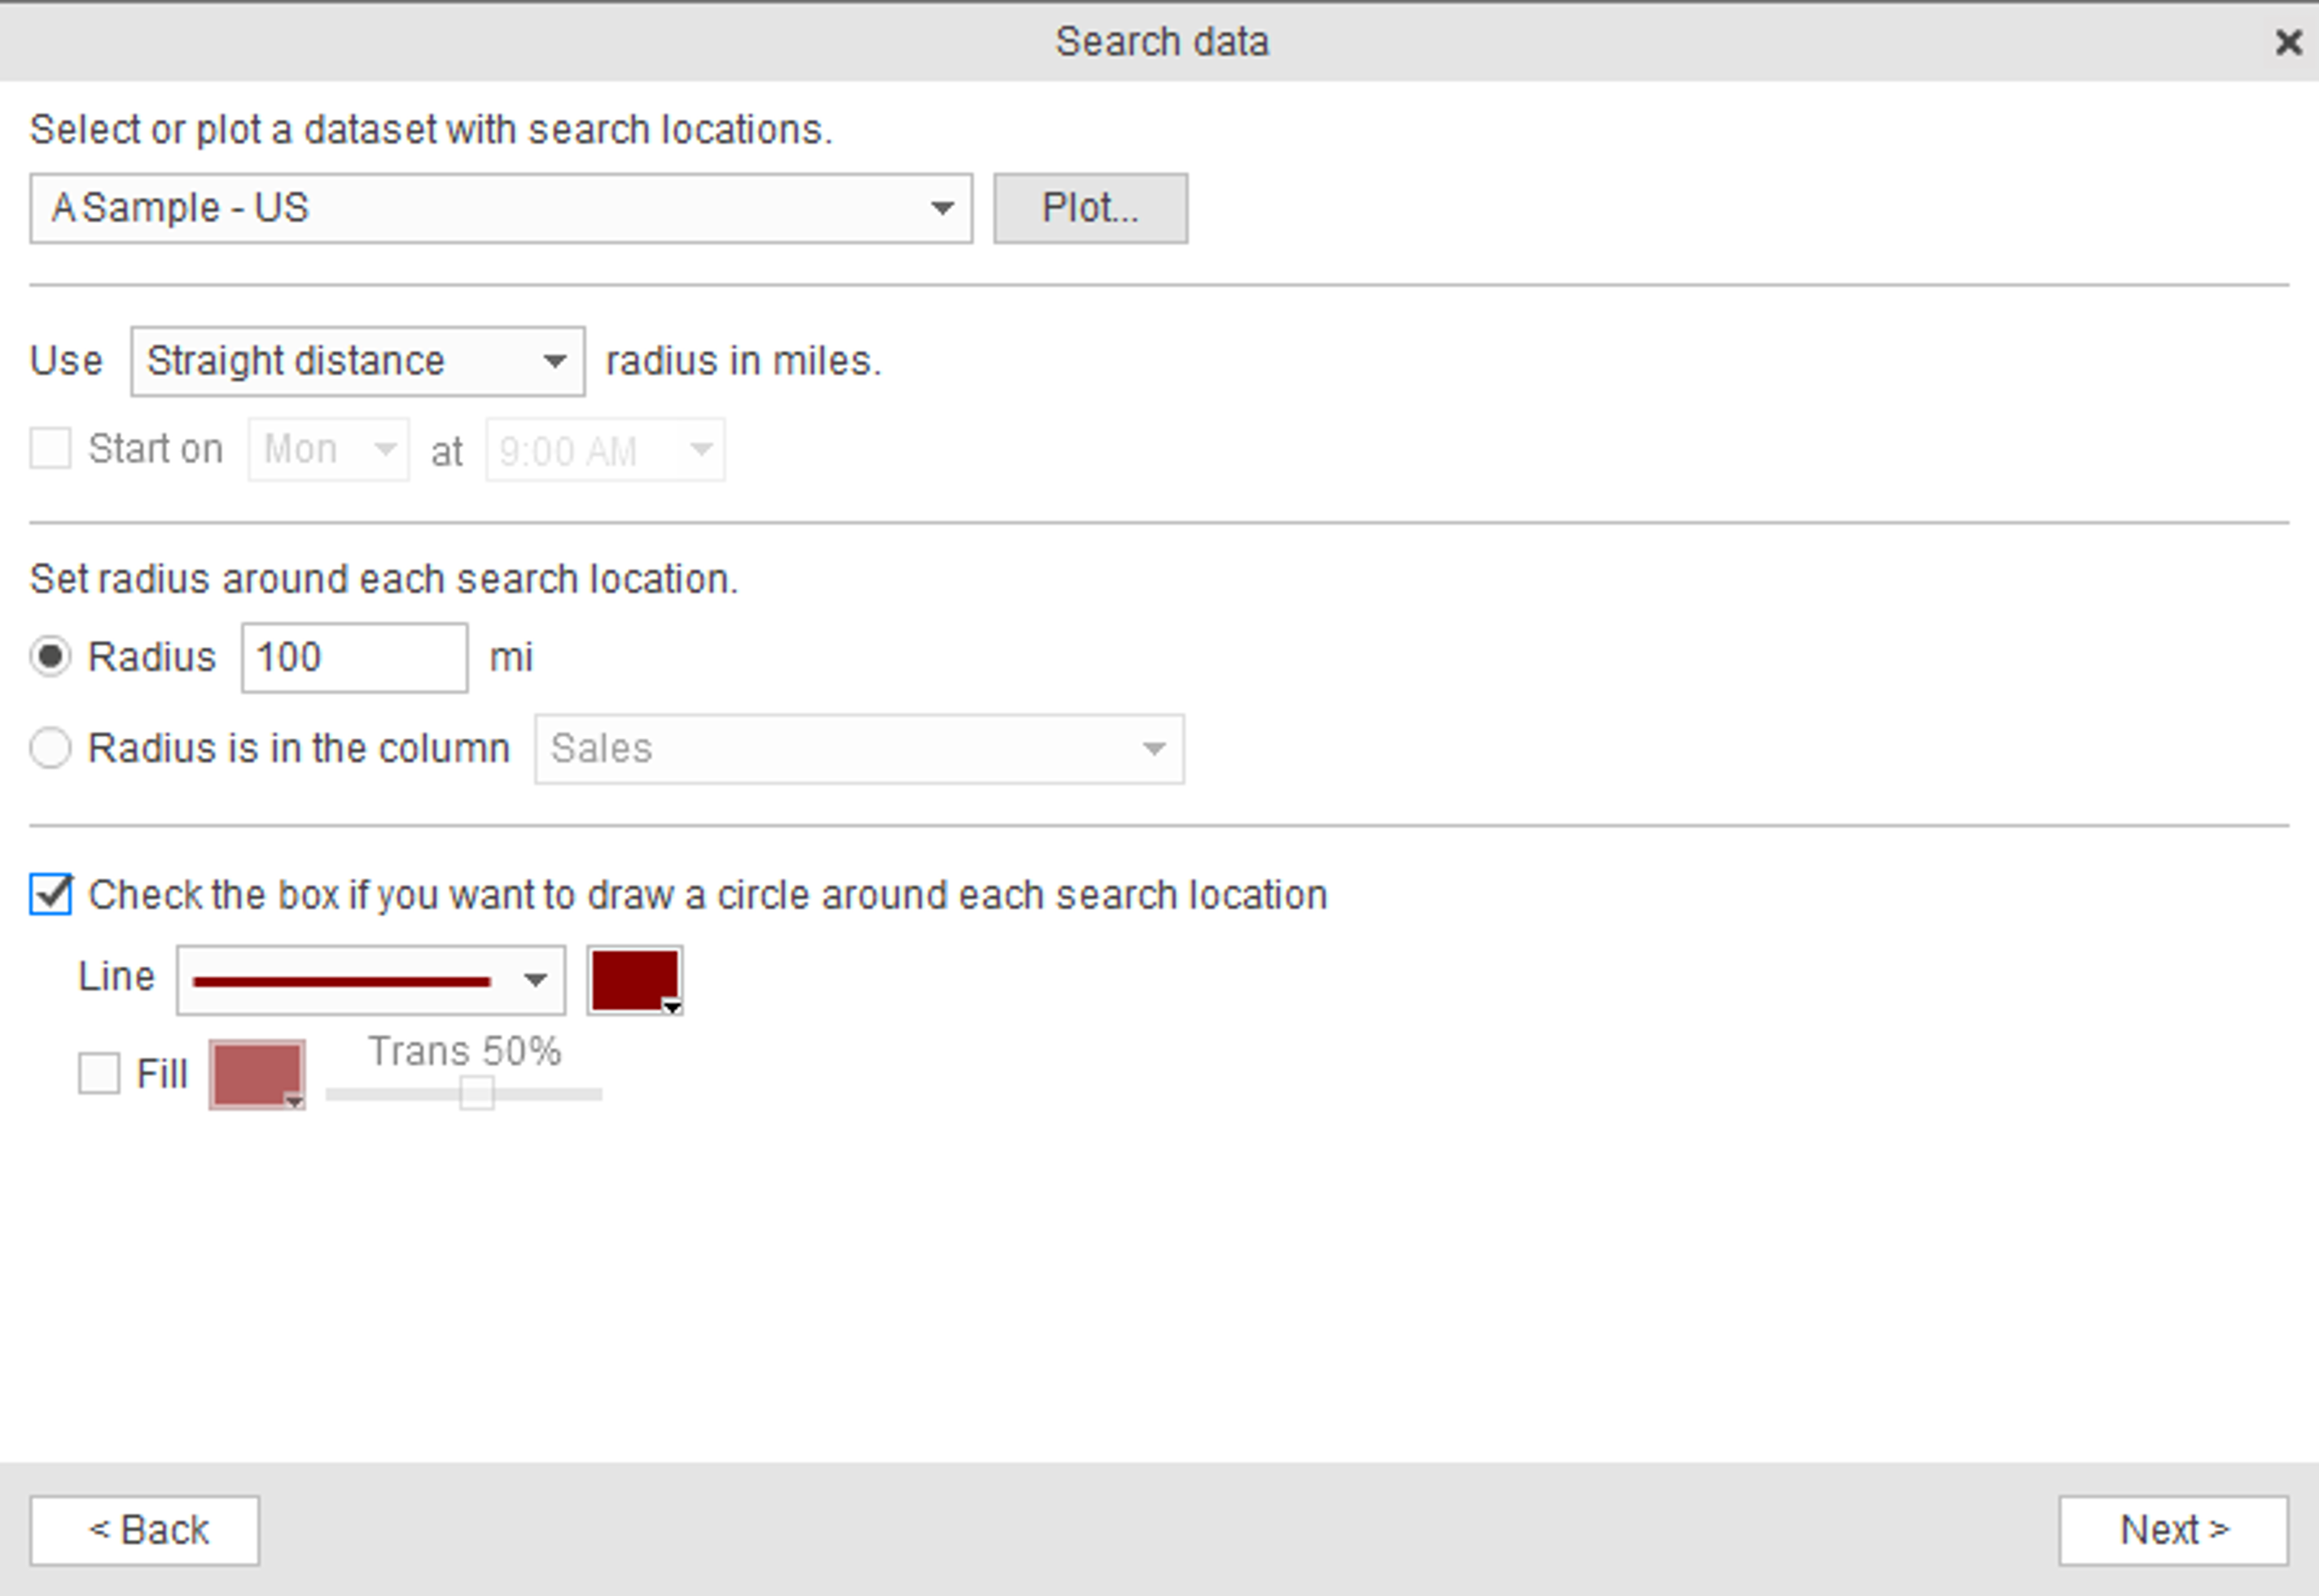
Step 4: Select Census Tracts as the Map Layer for Radius Search
Select Census tracts as the map layer for radius search – because Census tracts are the most granular areas, they will allow you to get the closest approximation of the population covered by the radius areas:
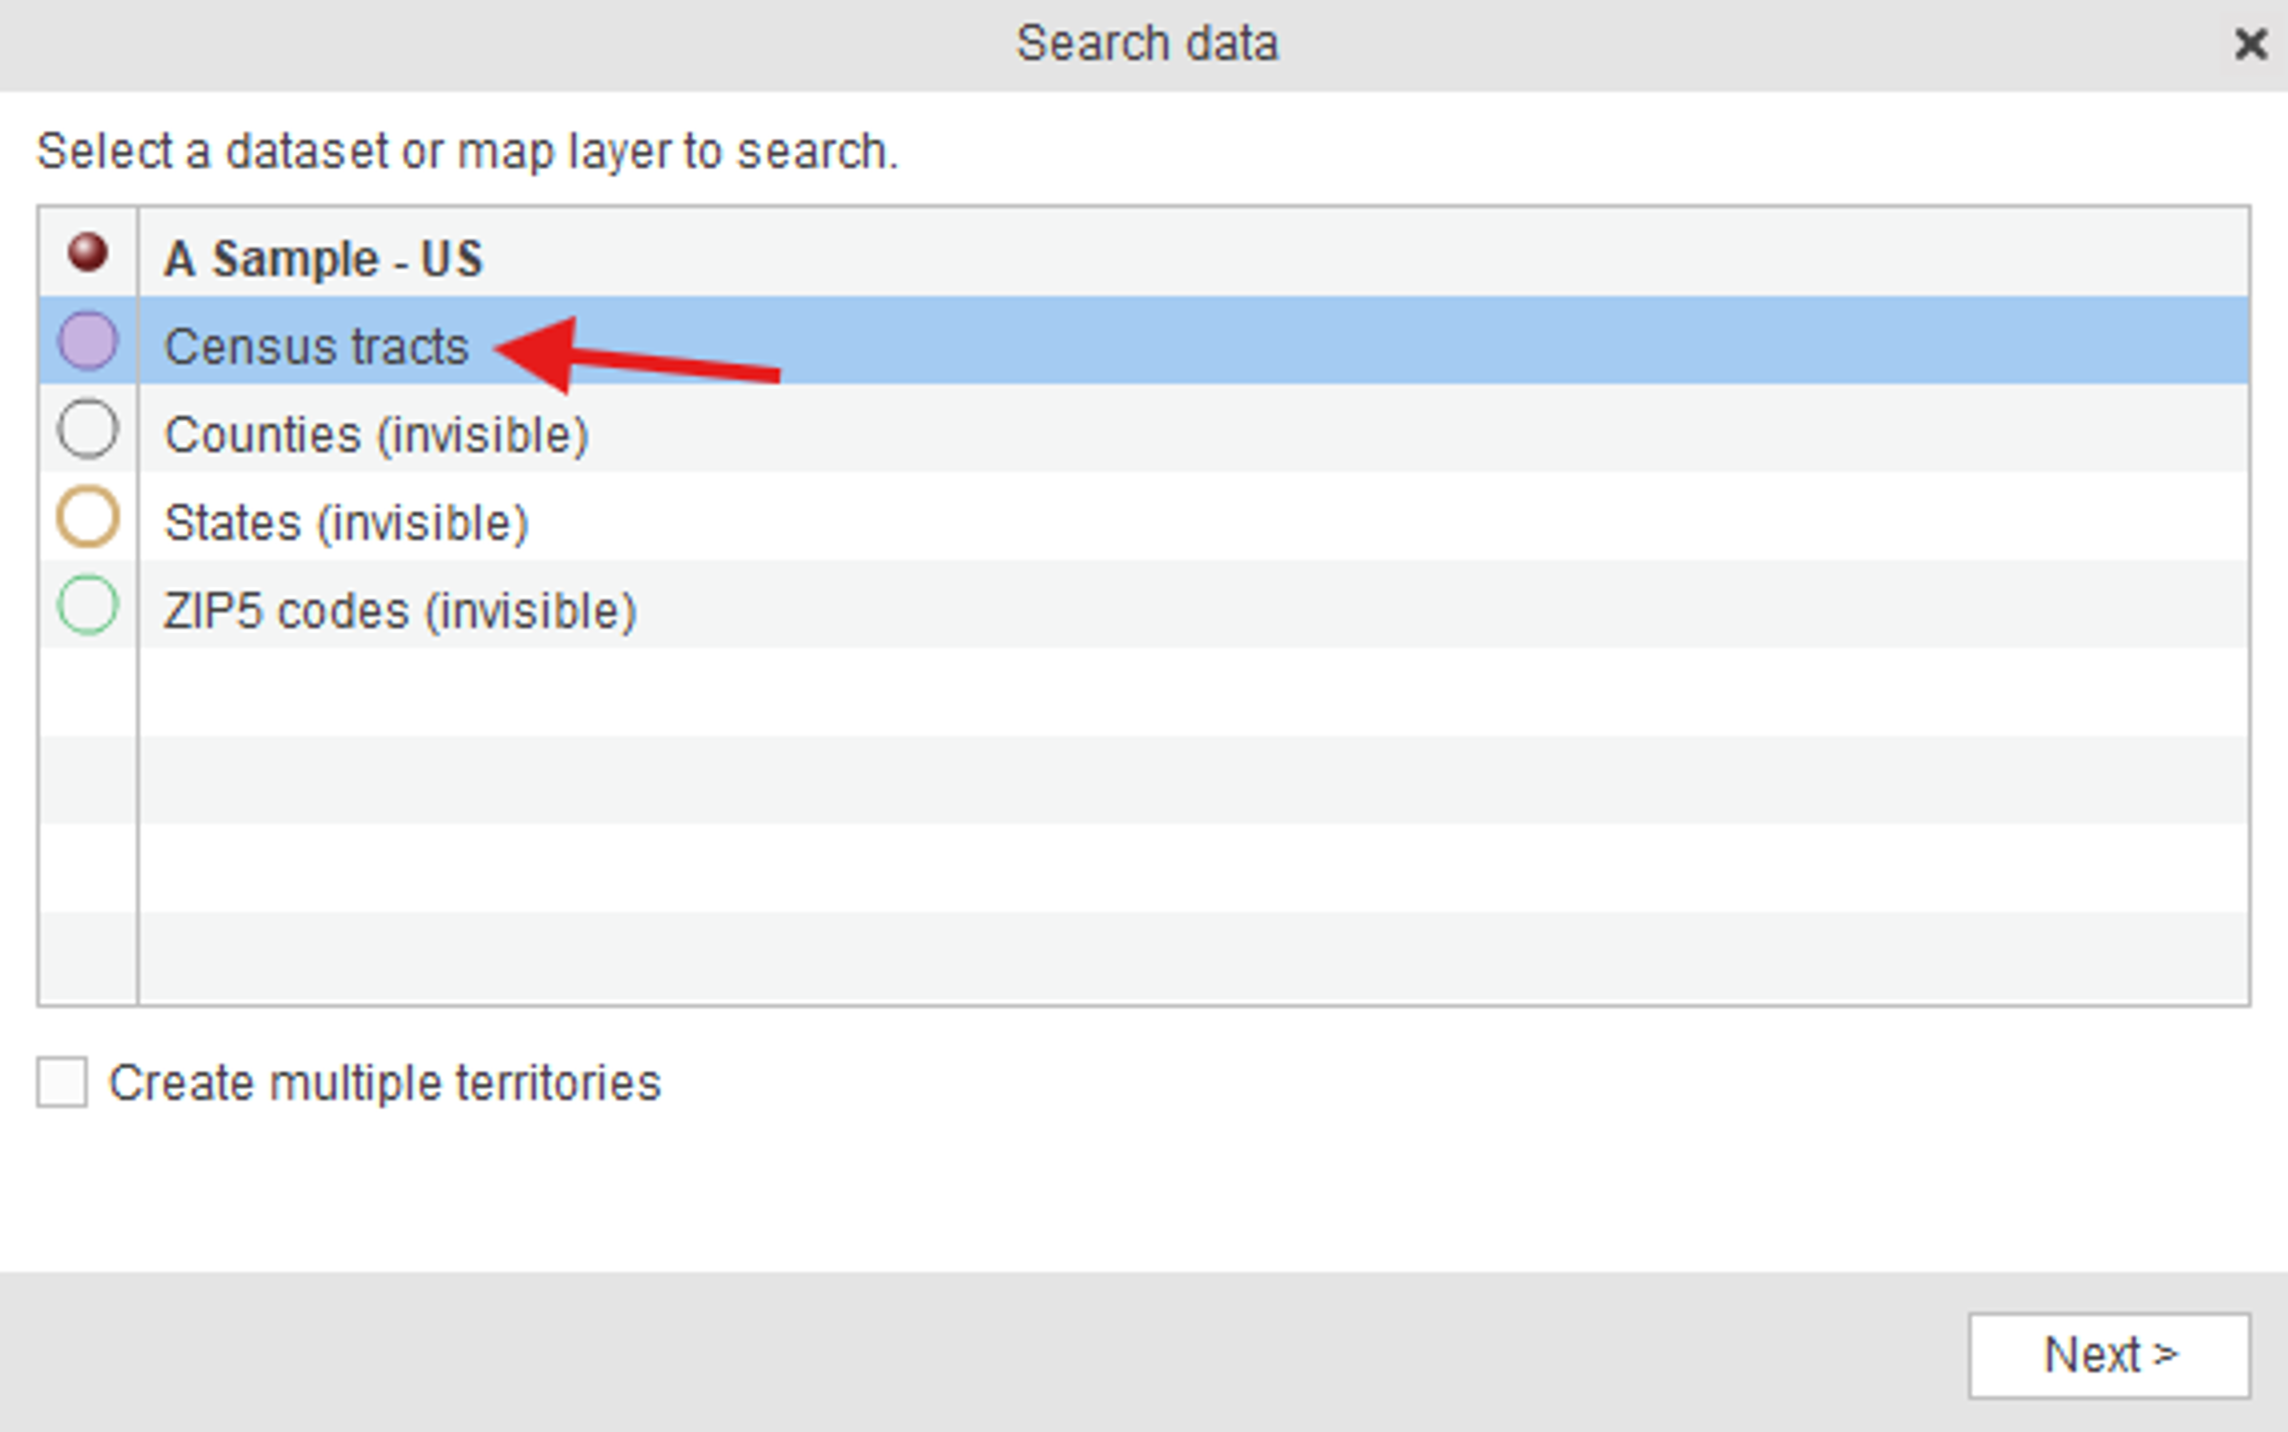
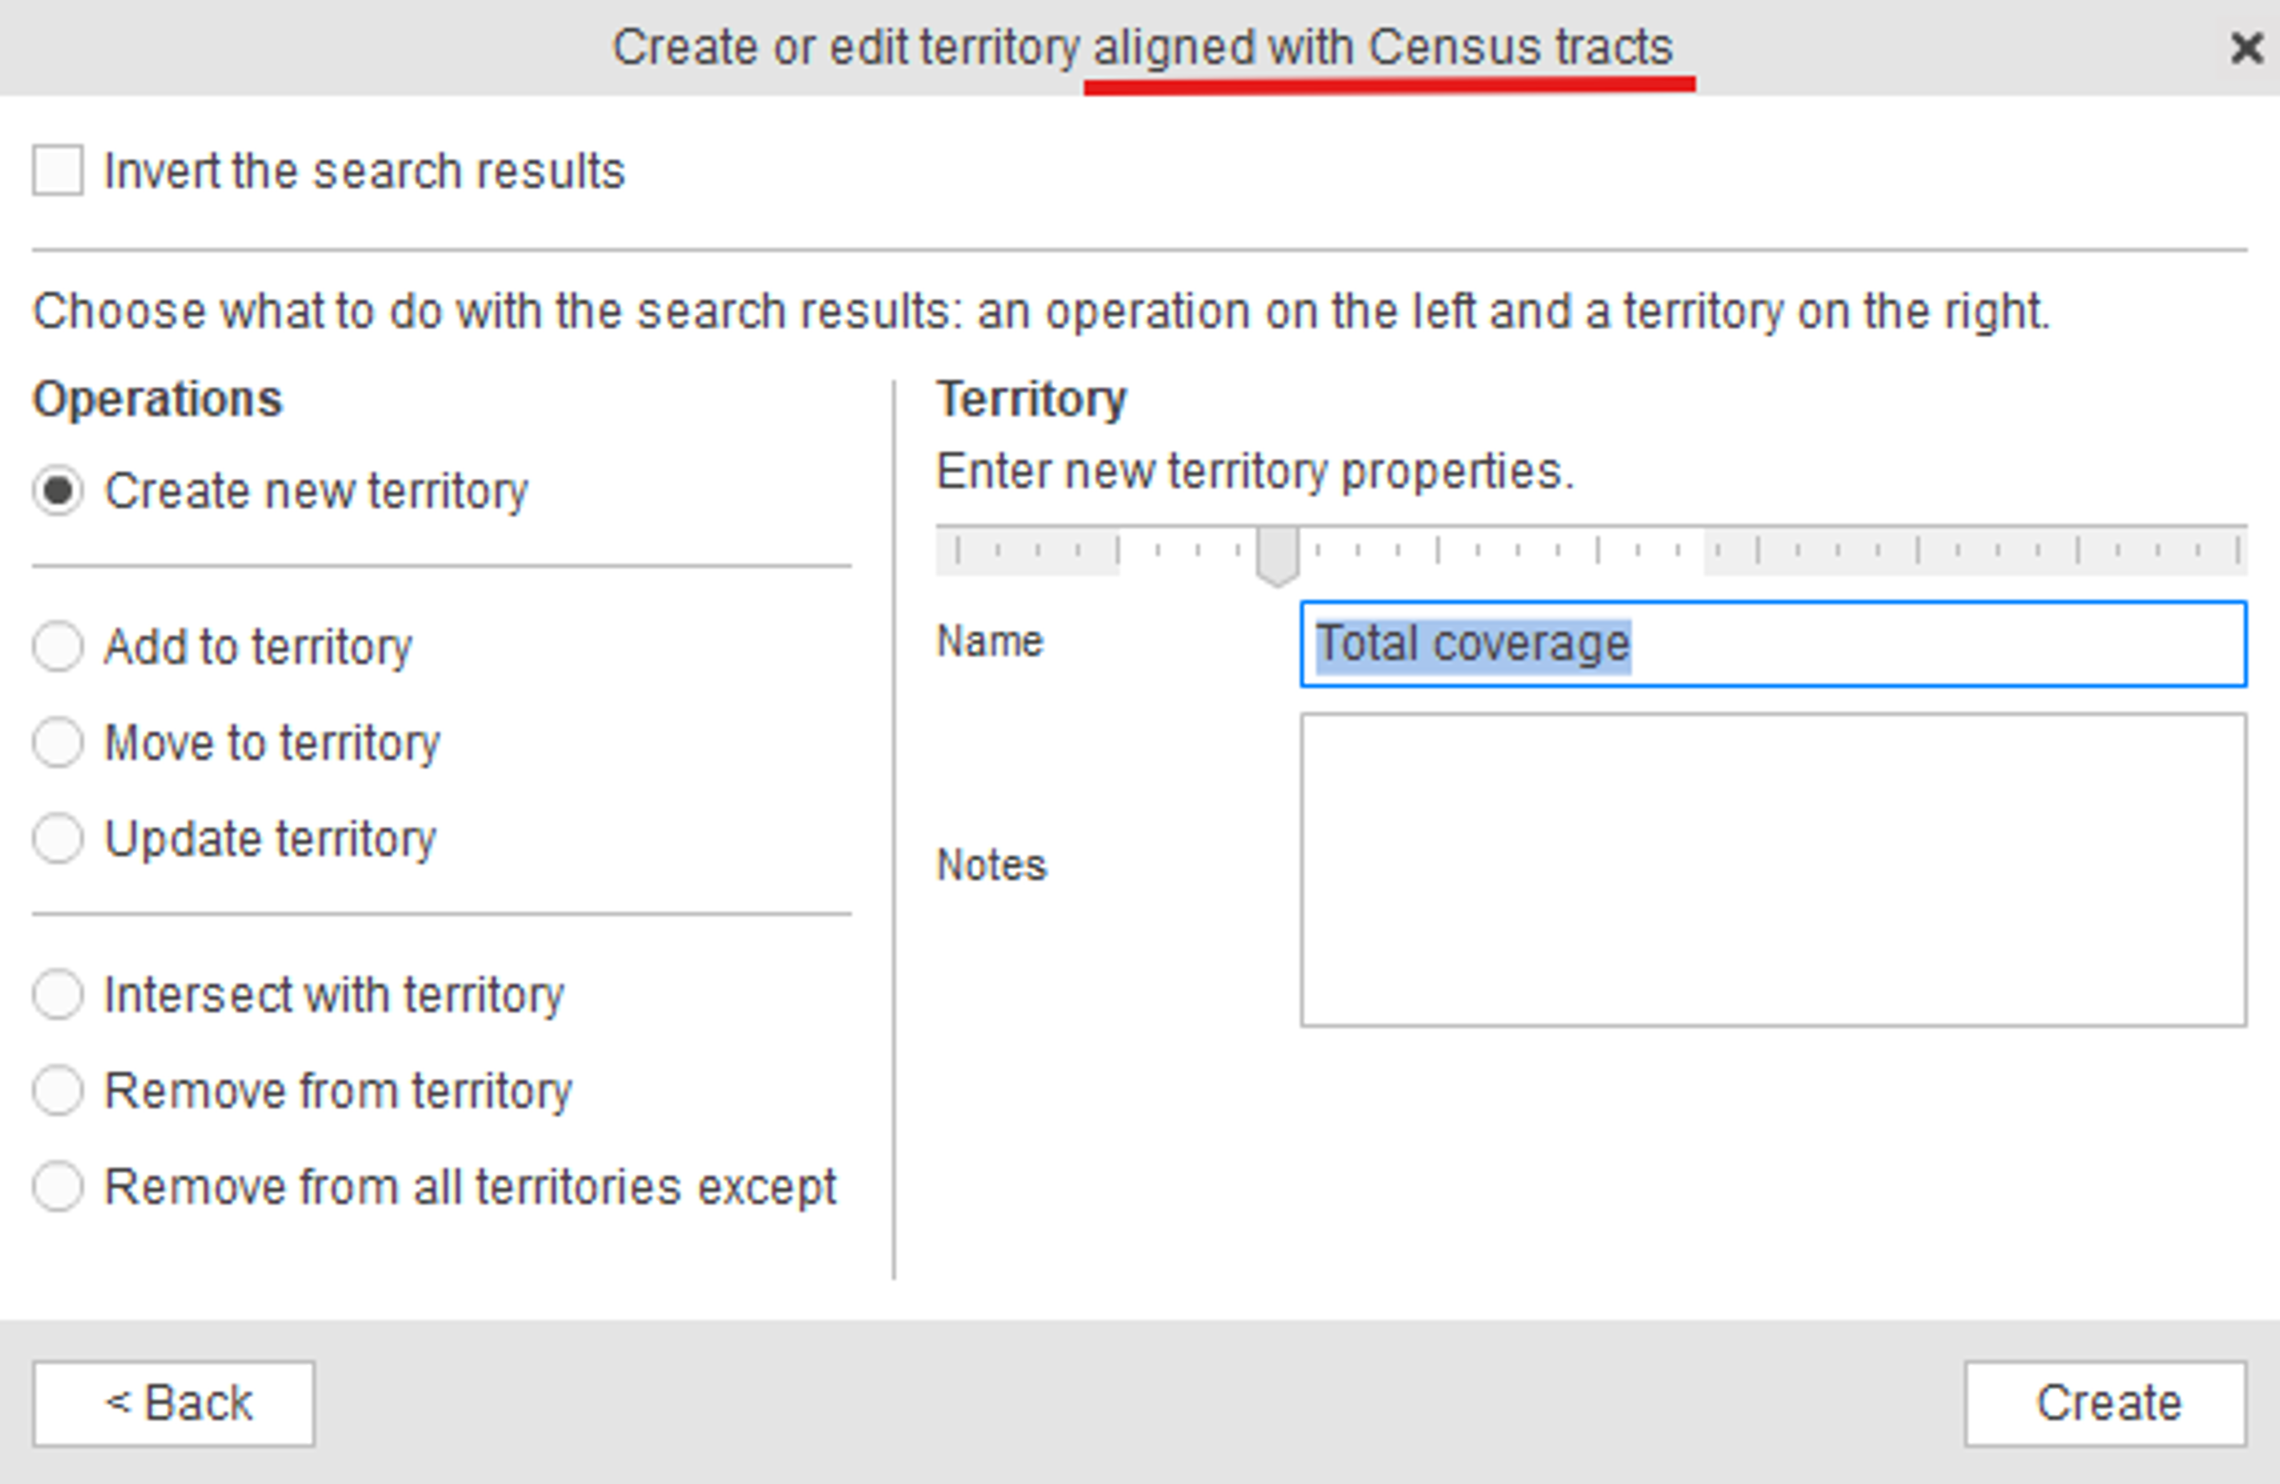
Step 5: Create a New Territory from the Selected Census Tracts
Select “Create new territory” and give it a name:
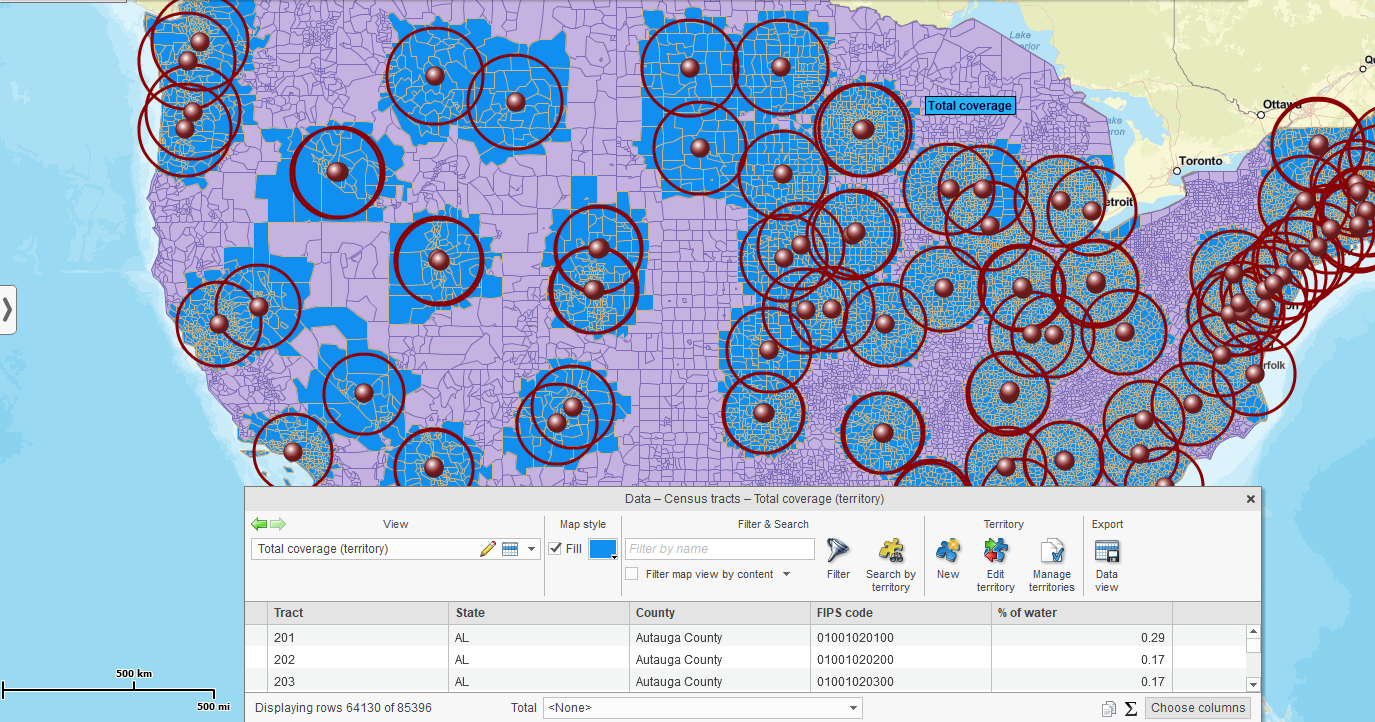
On the map you’ll see your center locations with the radius areas around each of them, the Census tract areas selected by each radius search, and the territory built from all of them:
Step 6: Summarize Population for the Territory
Summarize population for the selected territory to estimate the population covered by at least one location: click the “Summarize” button in the pop-up menu for the selected territory, or the same-looking button in the Data window:
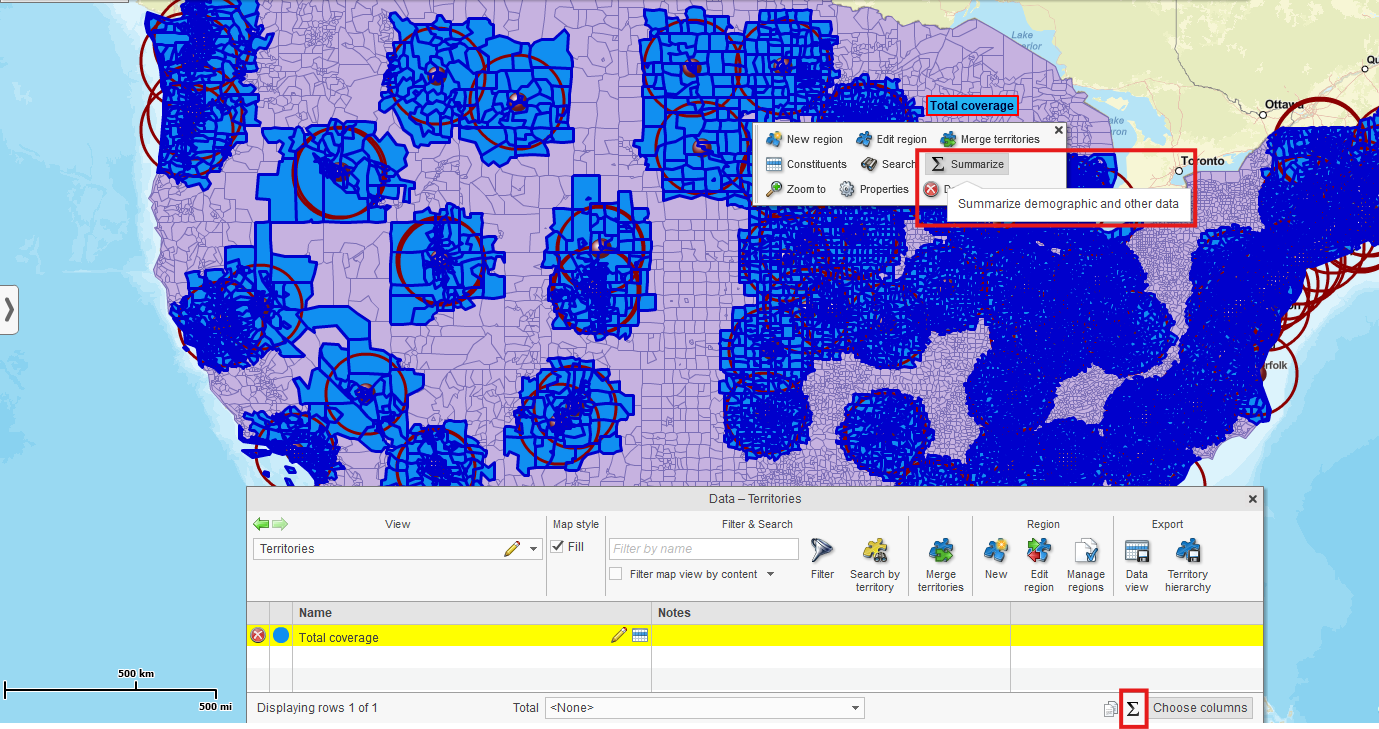
Step 7: Compare Covered Population with the Total U.S. Population
Use the Data window to calculate or view the total U.S. population from the same demographic dataset. The easiest way to do it is to select the “States” map layer and click the “Summarize” button which will give you the total population of all the states in the U.S.:
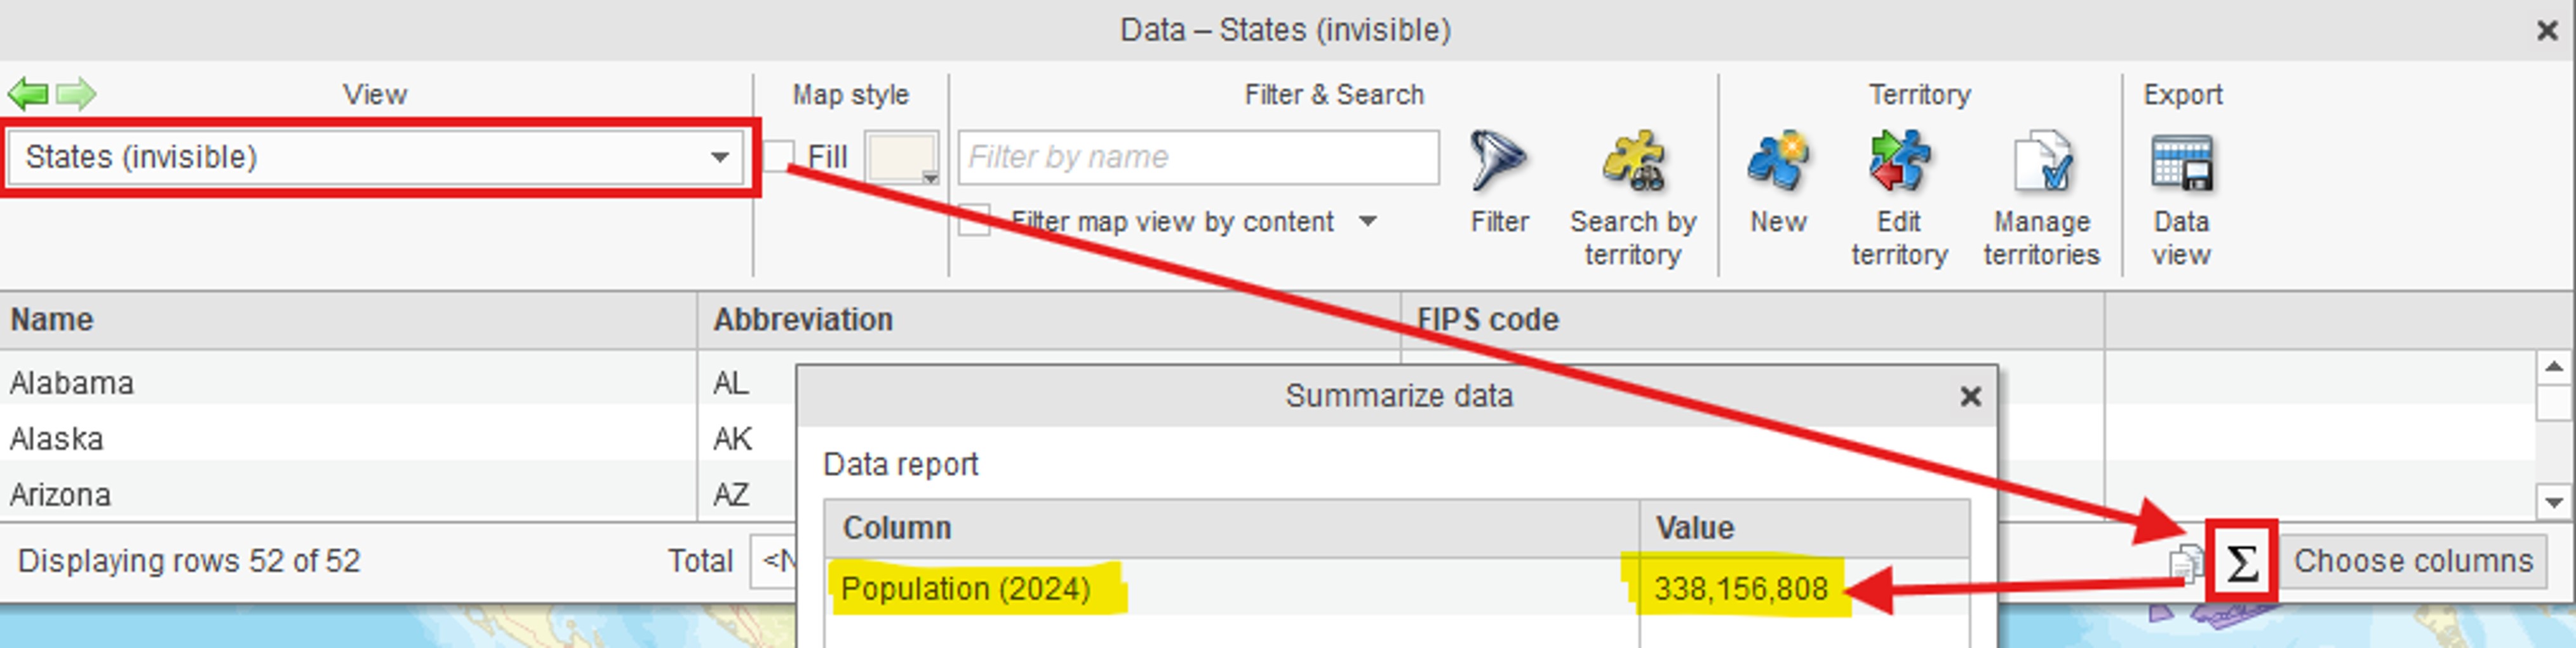
Then calculate:
(Covered population ÷ Total U.S. population) * 100% = Estimated population coverage within your territory
And finally:
100% − Estimated population coverage within your territory = Estimated population coverage outside your territory
Important Limits and Practical Notes
- As explained in the “Why Census tracts work better for this analysis” section above, the result is an estimate, not an exact household-level calculation – because Census tracts are counted as whole areas.
- If the number of locations exceeds MapBusinessOnline Pro’s current center-point limit for searching and segmenting data from multiple centers, split the dataset into batches and apply the steps to each batch.
- When using batches, be careful not to reintroduce double-counting across batch-created territories.
- Use the same population dataset (for instance, “Population (2024)”) for both covered population and total U.S. population.
- If your circle areas do not overlap, simply use MapBusinessOnline’s Summarize Demographics tool – this will get the precise result for you without building the coverage territory first.
- Using both mentioned Market Analysis tools, “Search & Segment Data from Multiple Centers” and “Summarize Demographics”, requires MapBusinessOnline Pro.


