Find Underserved Markets with a Competitor Density Map
The fastest way to spot an underserved market is to define a realistic trade area, map existing competitors, and compare competitor concentration against ZIP-level population. MapBusinessOnline supports radius and drive-time trade areas, business listing searches, ZIP-based demographic analysis, and color-coded boundary maps, so you can build a competitor density map that turns location research into a clear list of target ZIPs.
Define the trade area
Start by setting the area that represents the market you actually want to serve. MapBusinessOnline can easily visualize radius-based trade areas, drive-time polygons, and imported ZIP-based coverage areas, so the workflow can match simple proximity analysis or more realistic travel behavior.
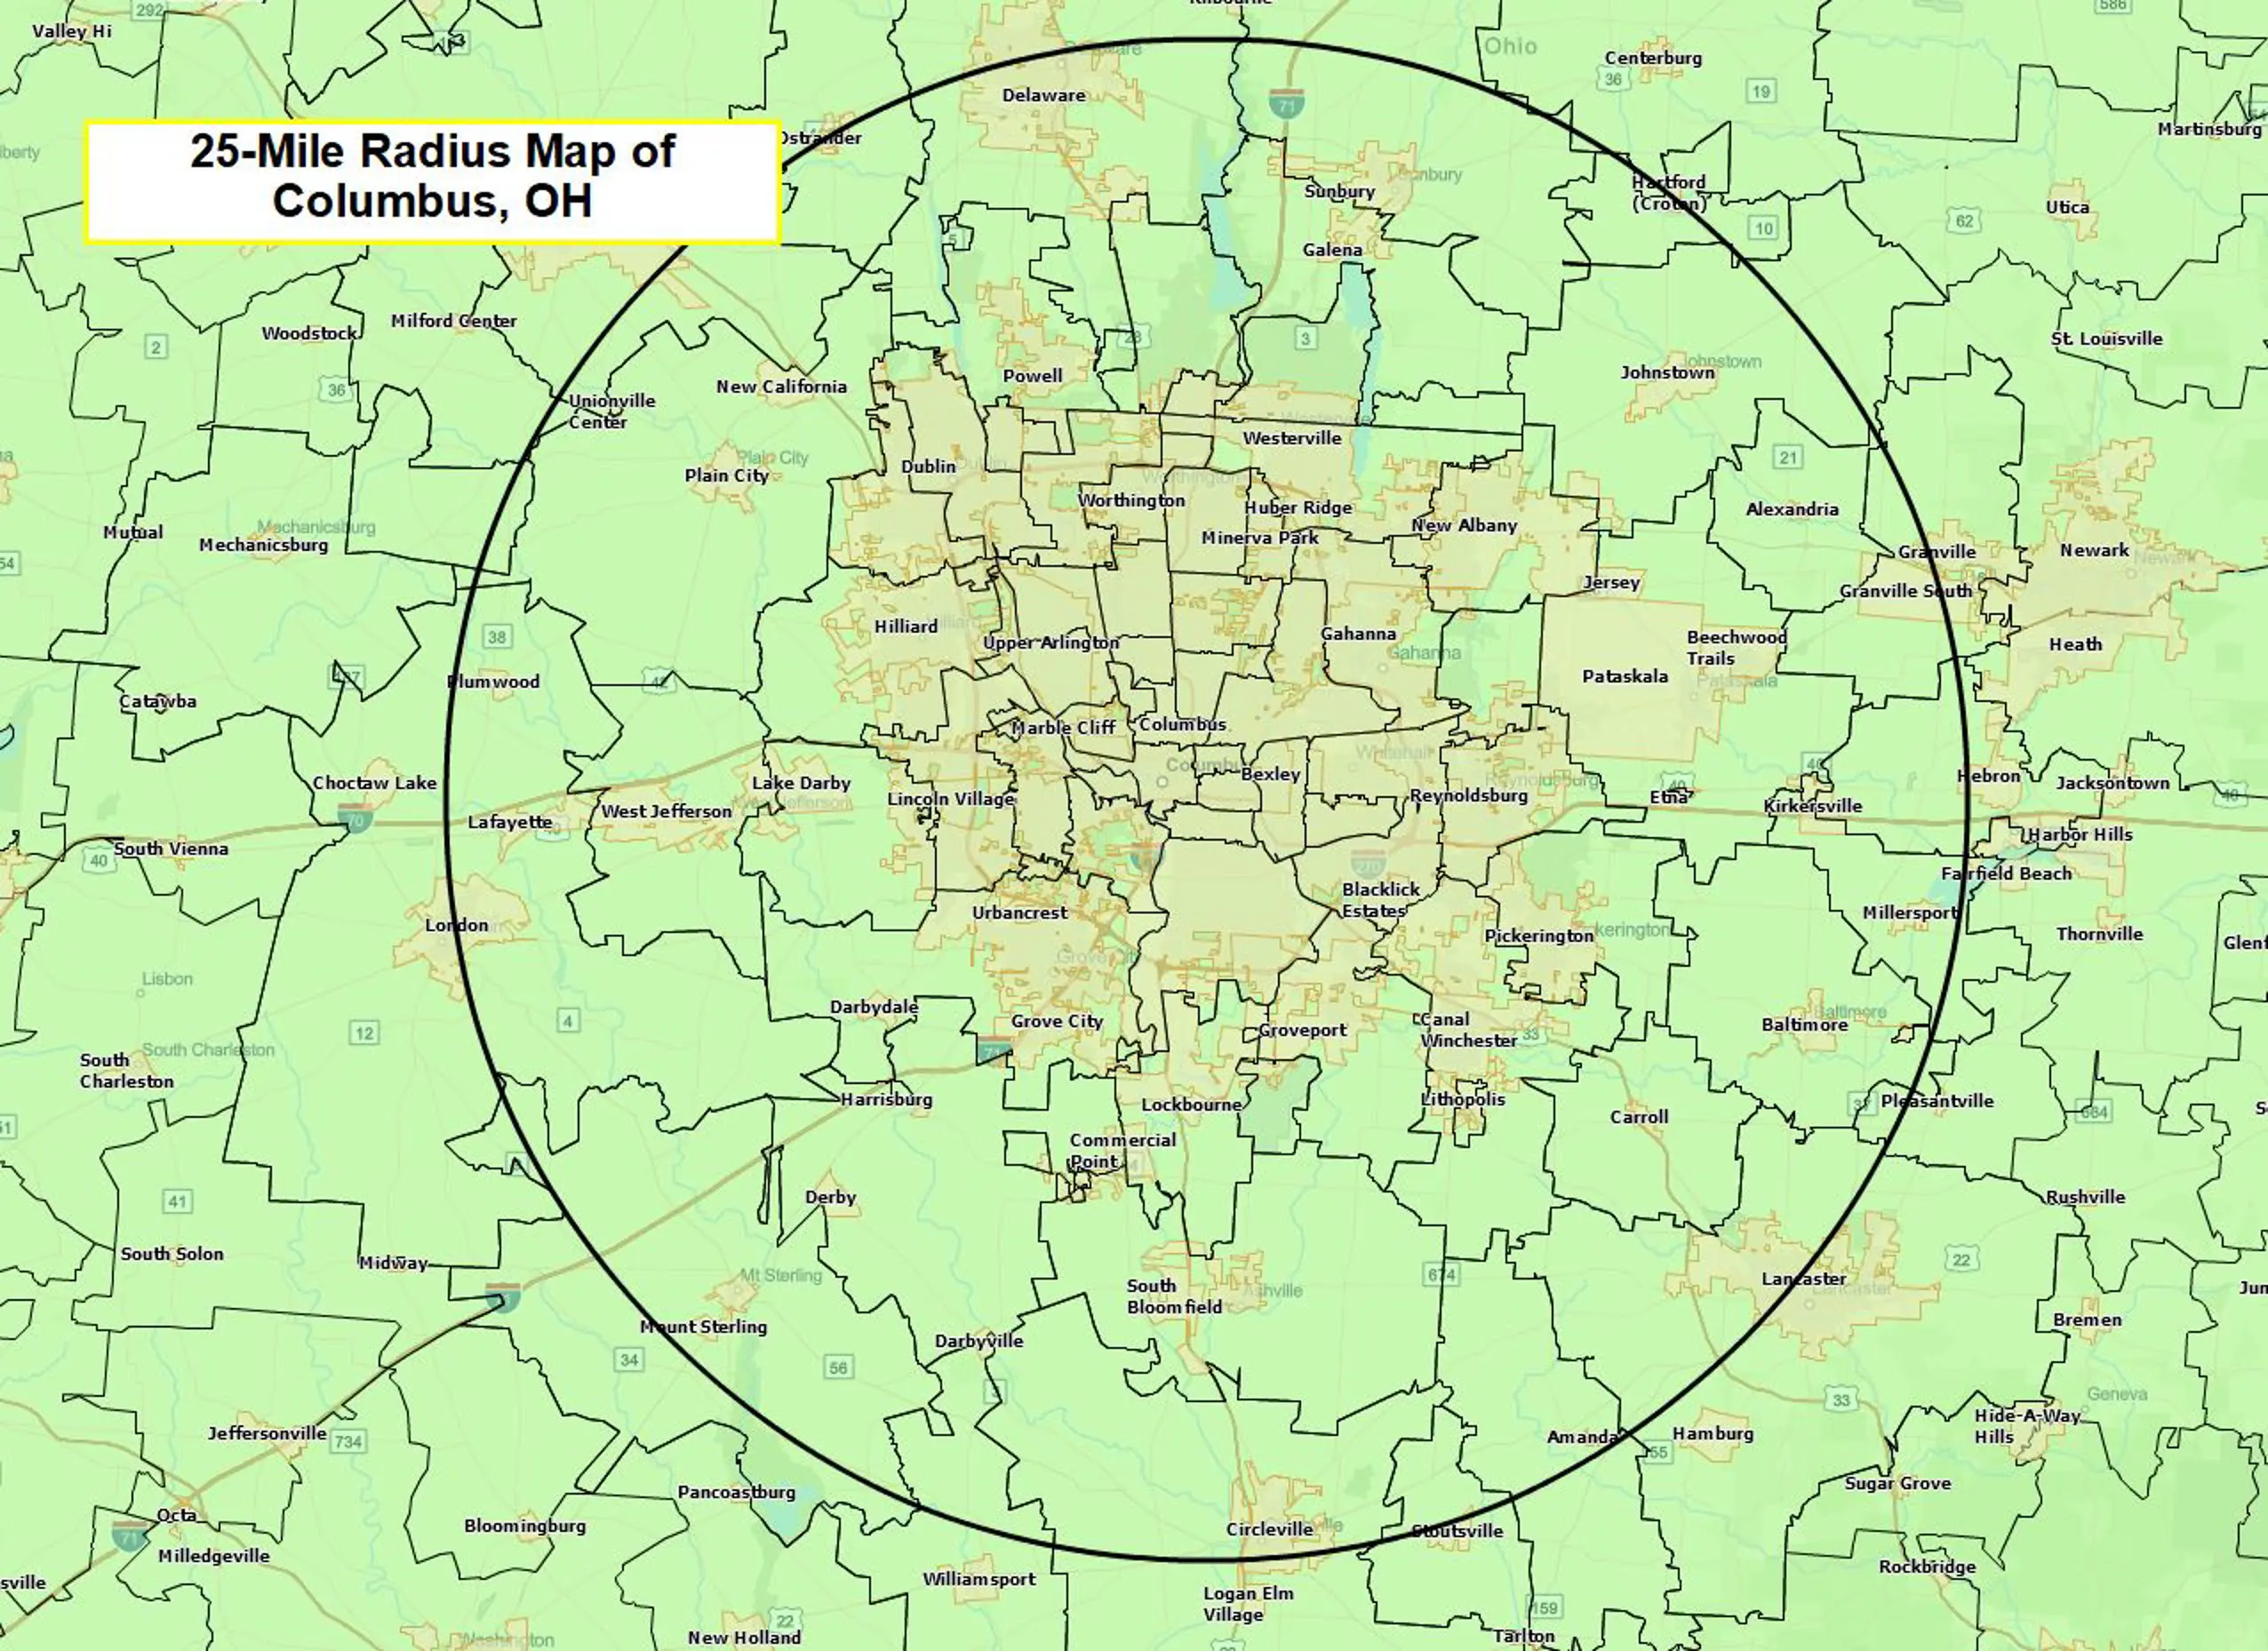
Use Columbus, Ohio as the running example. The first step is to create a 25-mile trade area around the city center. That circle area encompasses roughly 84 ZIP codes with a combined population of just under 2 million — enough to start meaningful analysis before a single competitor is placed on the map.
- Create a 25-mile radius around the target market with the Circle tool, or use a drive-time polygon if travel time is the better definition of reach.
- If you already know the target ZIPs, import them as a ZIP-based area instead of drawing a shape.
- Keep the trade area as the boundary for the rest of the workflow, because competitor searches and ZIP analysis should run inside that market definition.
A clearly defined market frame keeps the analysis disciplined. It prevents the competitor search from drifting too wide and ensures the ZIP-level scoring reflects the area you would actually serve.
Map competitors
Once the trade area is set, map the businesses already competing inside it. MapBusinessOnline supports Business Listings searches by radius, polygon, ZIP code, city, state, and industry category, and those listings can include attributes such as sales estimates, employee count estimates, and branch locations.
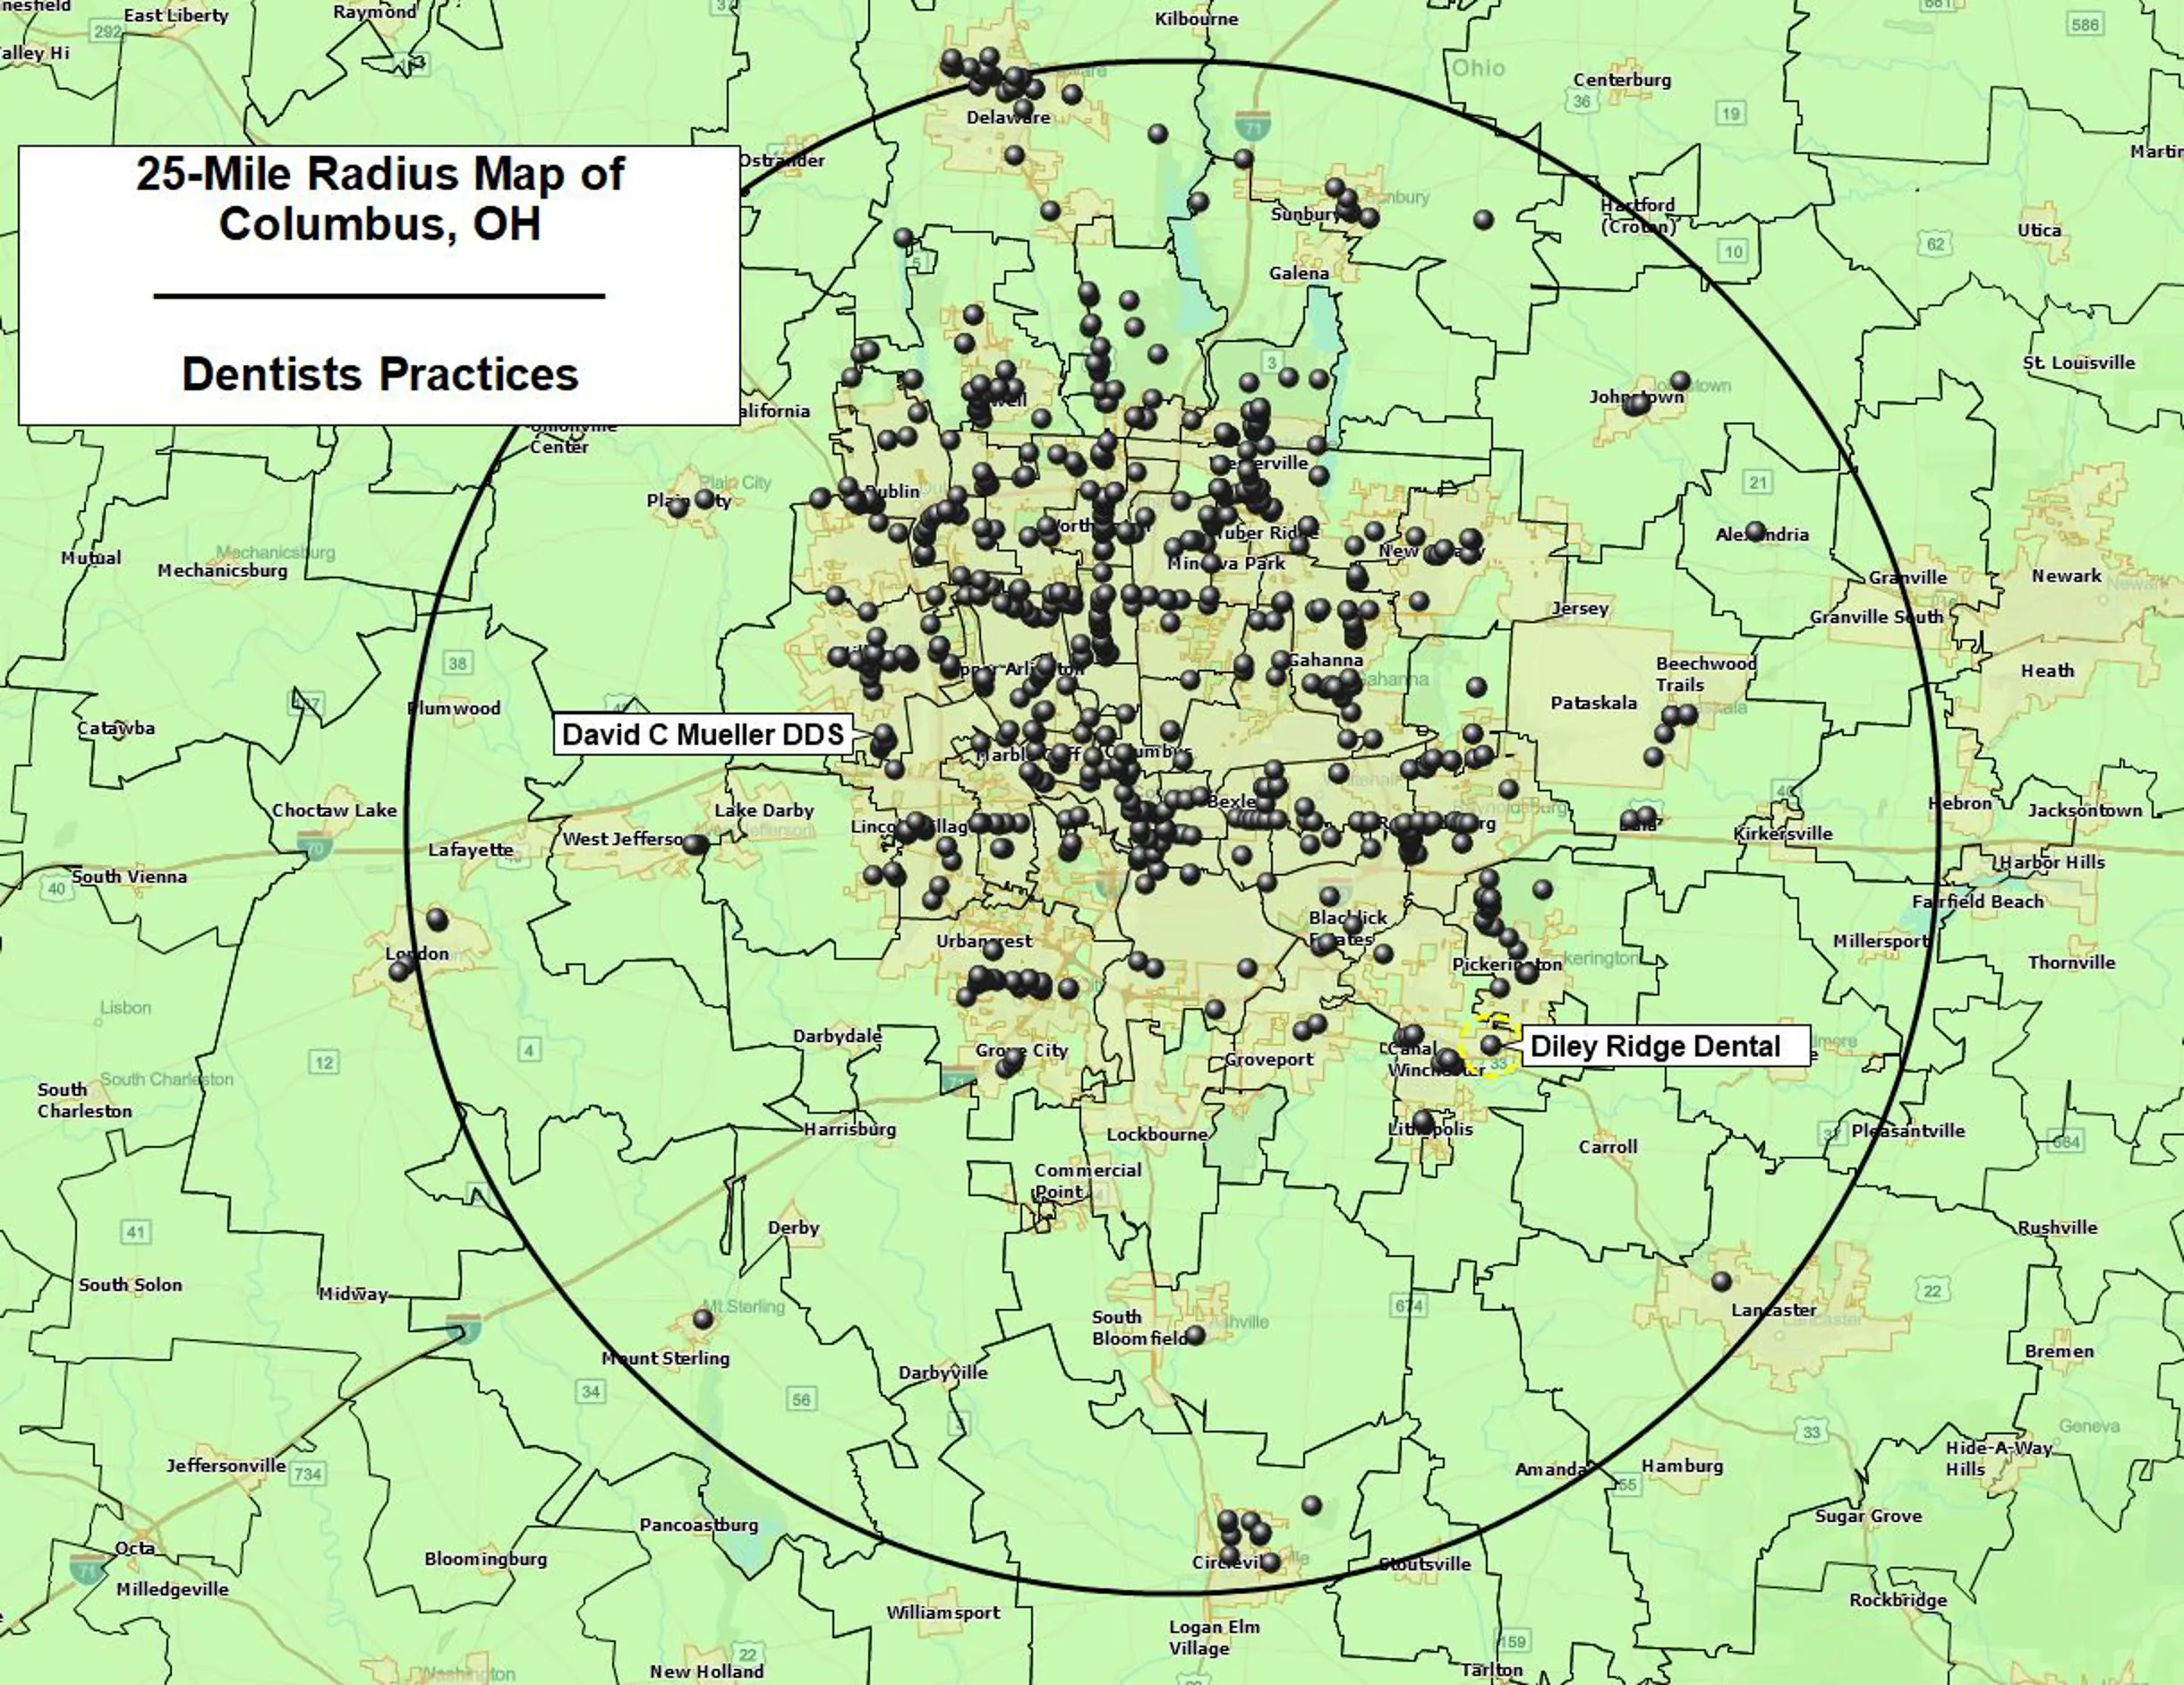
In the Columbus example, the next step is to pull dental practices across the selected market and plot them as a competitor density map. This creates an immediate supply-side view — you can see where practices are clustered, where corridors already look crowded, and where coverage begins to thin out.
- Open Business Listings and search within the defined trade area.
- Filter to the competitor category you want to analyze; in this example, that is dental practices.
- Add the results to the map and style the points so competitor locations are easy to distinguish.
Calculate underserved ZIPs
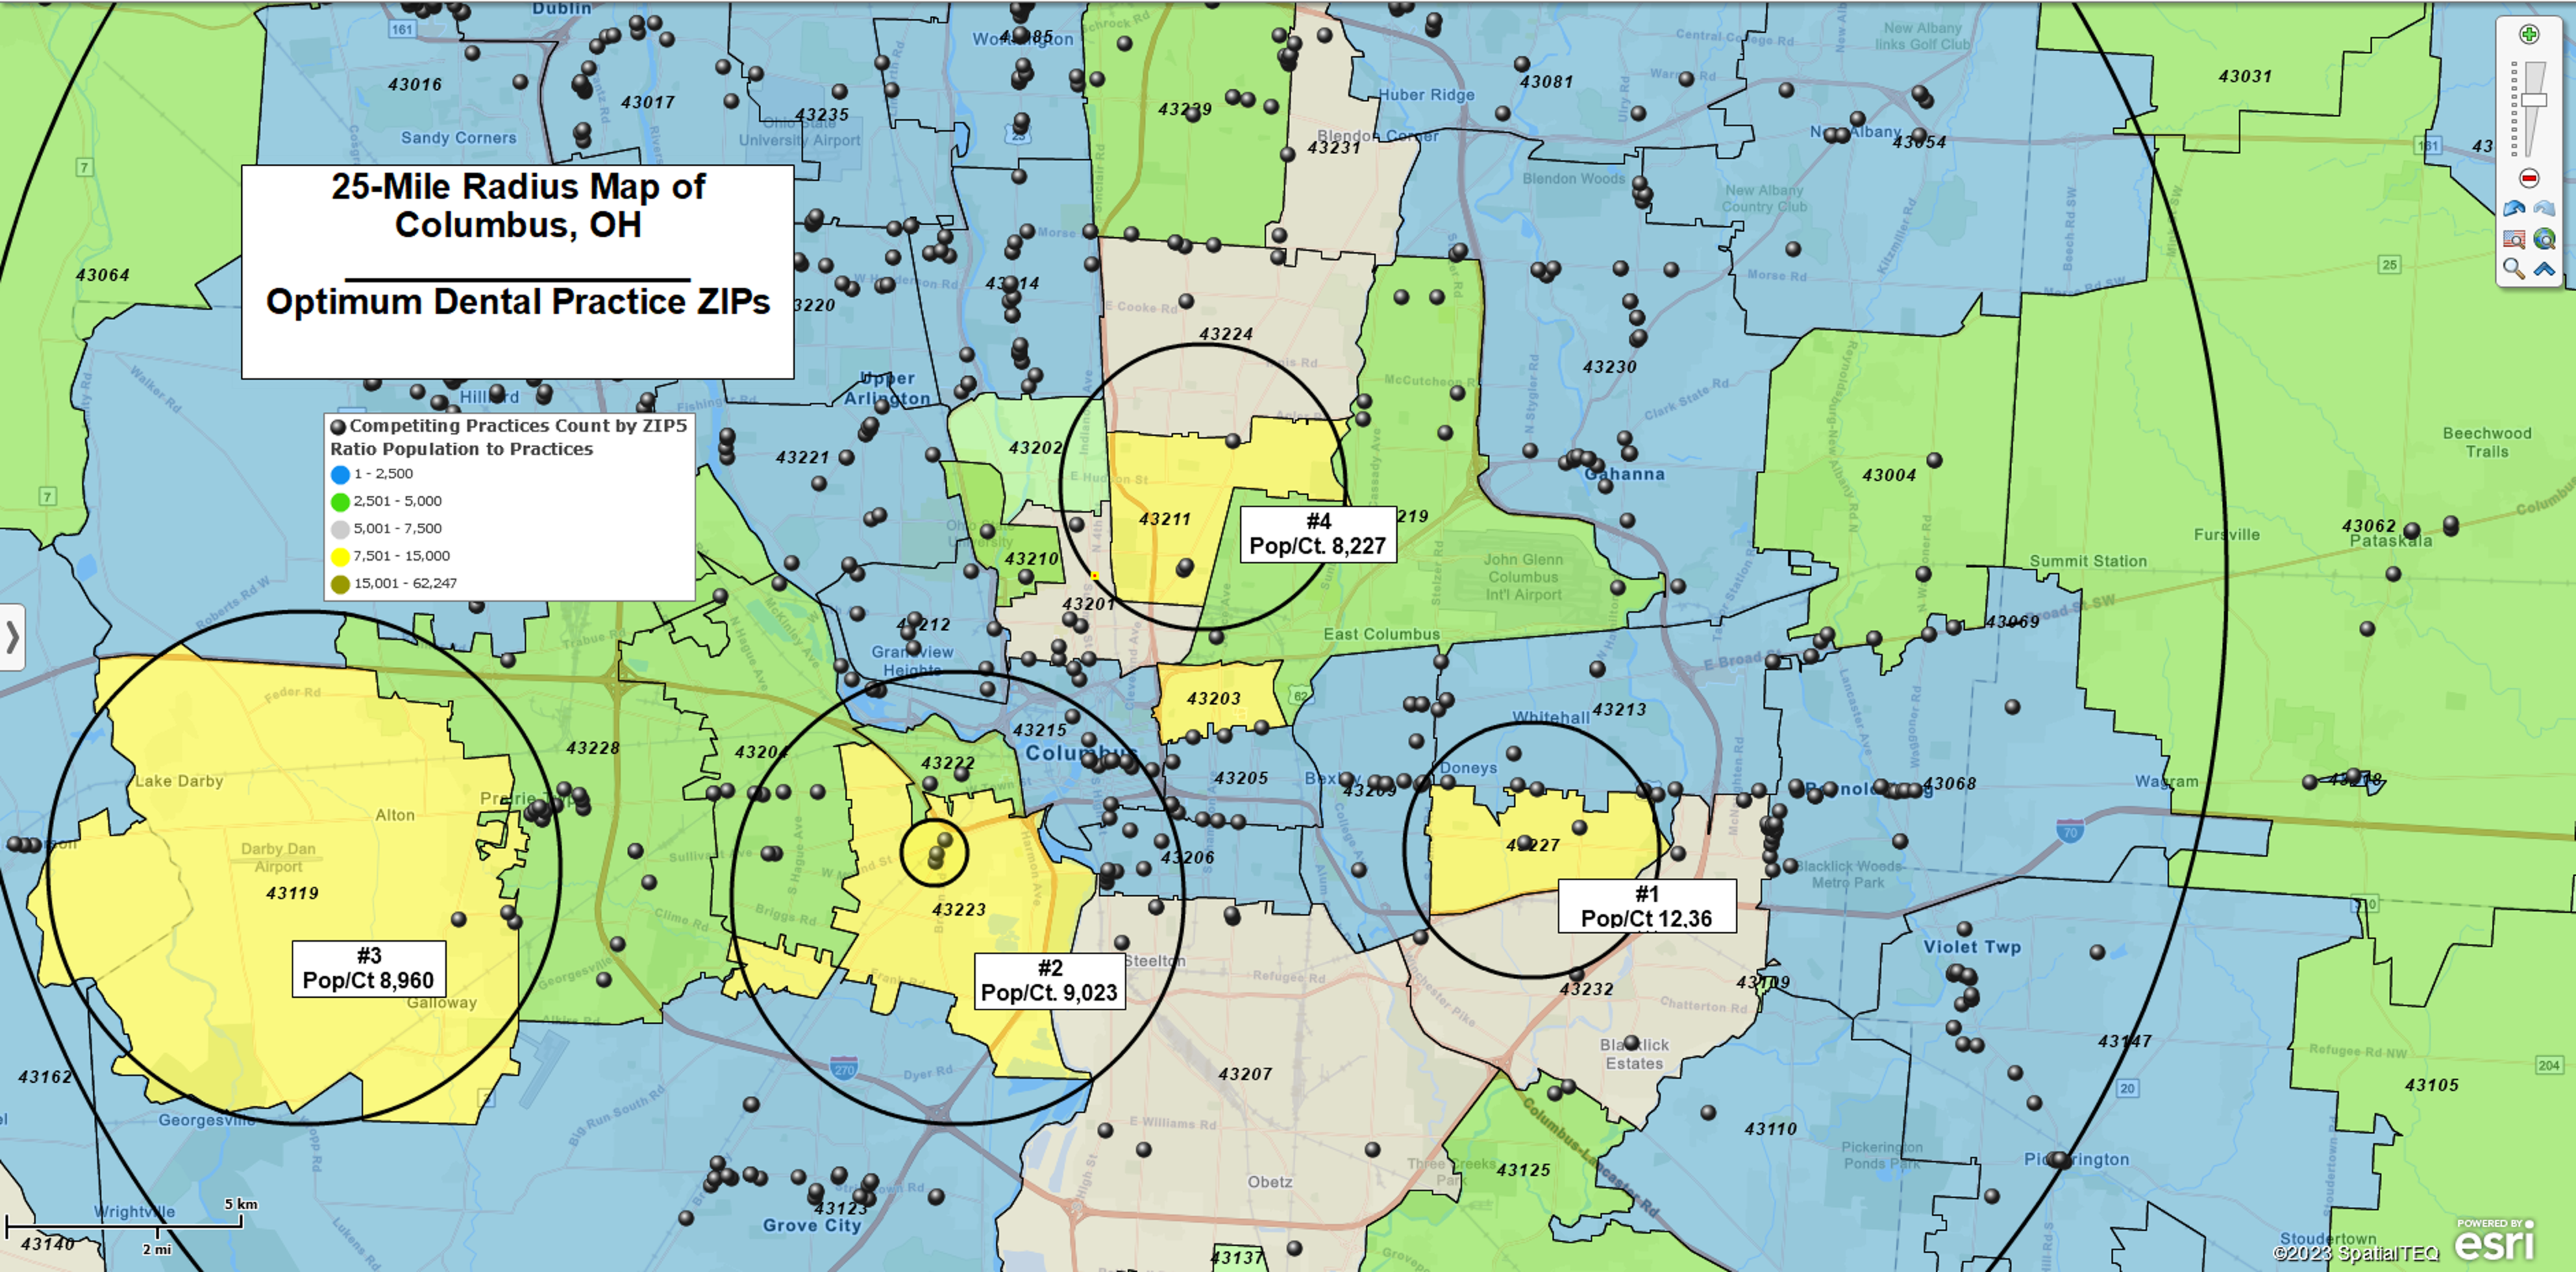
This is the key step — where the competitor density map gets its scoring layer. The analysis is based on competitor count and population by ZIP: measure how many competitors operate in each ZIP, compare that count against ZIP-level population, then color-code the ZIP boundaries so the strongest opportunities stand out visually.
In the Columbus example, the best ZIPs are the ones with stronger population and fewer competing dental practices. A color-coded ZIP map makes those candidate areas easy to identify at a glance, giving you a much clearer signal than competitor count alone. A ZIP with several competitors may still be attractive if the population is large enough. A ZIP with fewer competitors tells a different story if the market depth simply isn't there.
- Open Manage Map and Data, select the ZIP5 layer, and click Customize map layer. In the dialog, select Calculated data column category and click Add data column.
- In the Add Data Column wizard, type a column name, choose a format, click Formula Options, then select Simple Formula. In the final dialog, choose your competitor dataset and the Count column as the Numerator, then choose Demographic Data and the population column as the Denominator. Click Add to apply.
- Use Color-Code Map Layer to shade the ZIPs by that calculated column — ZIPs with the lowest competitor-to-population ratio are your strongest candidates. You can also add the numbers (competitor count and population) to the ZIP code labels on the map.
Bonus: Research competitors in the area
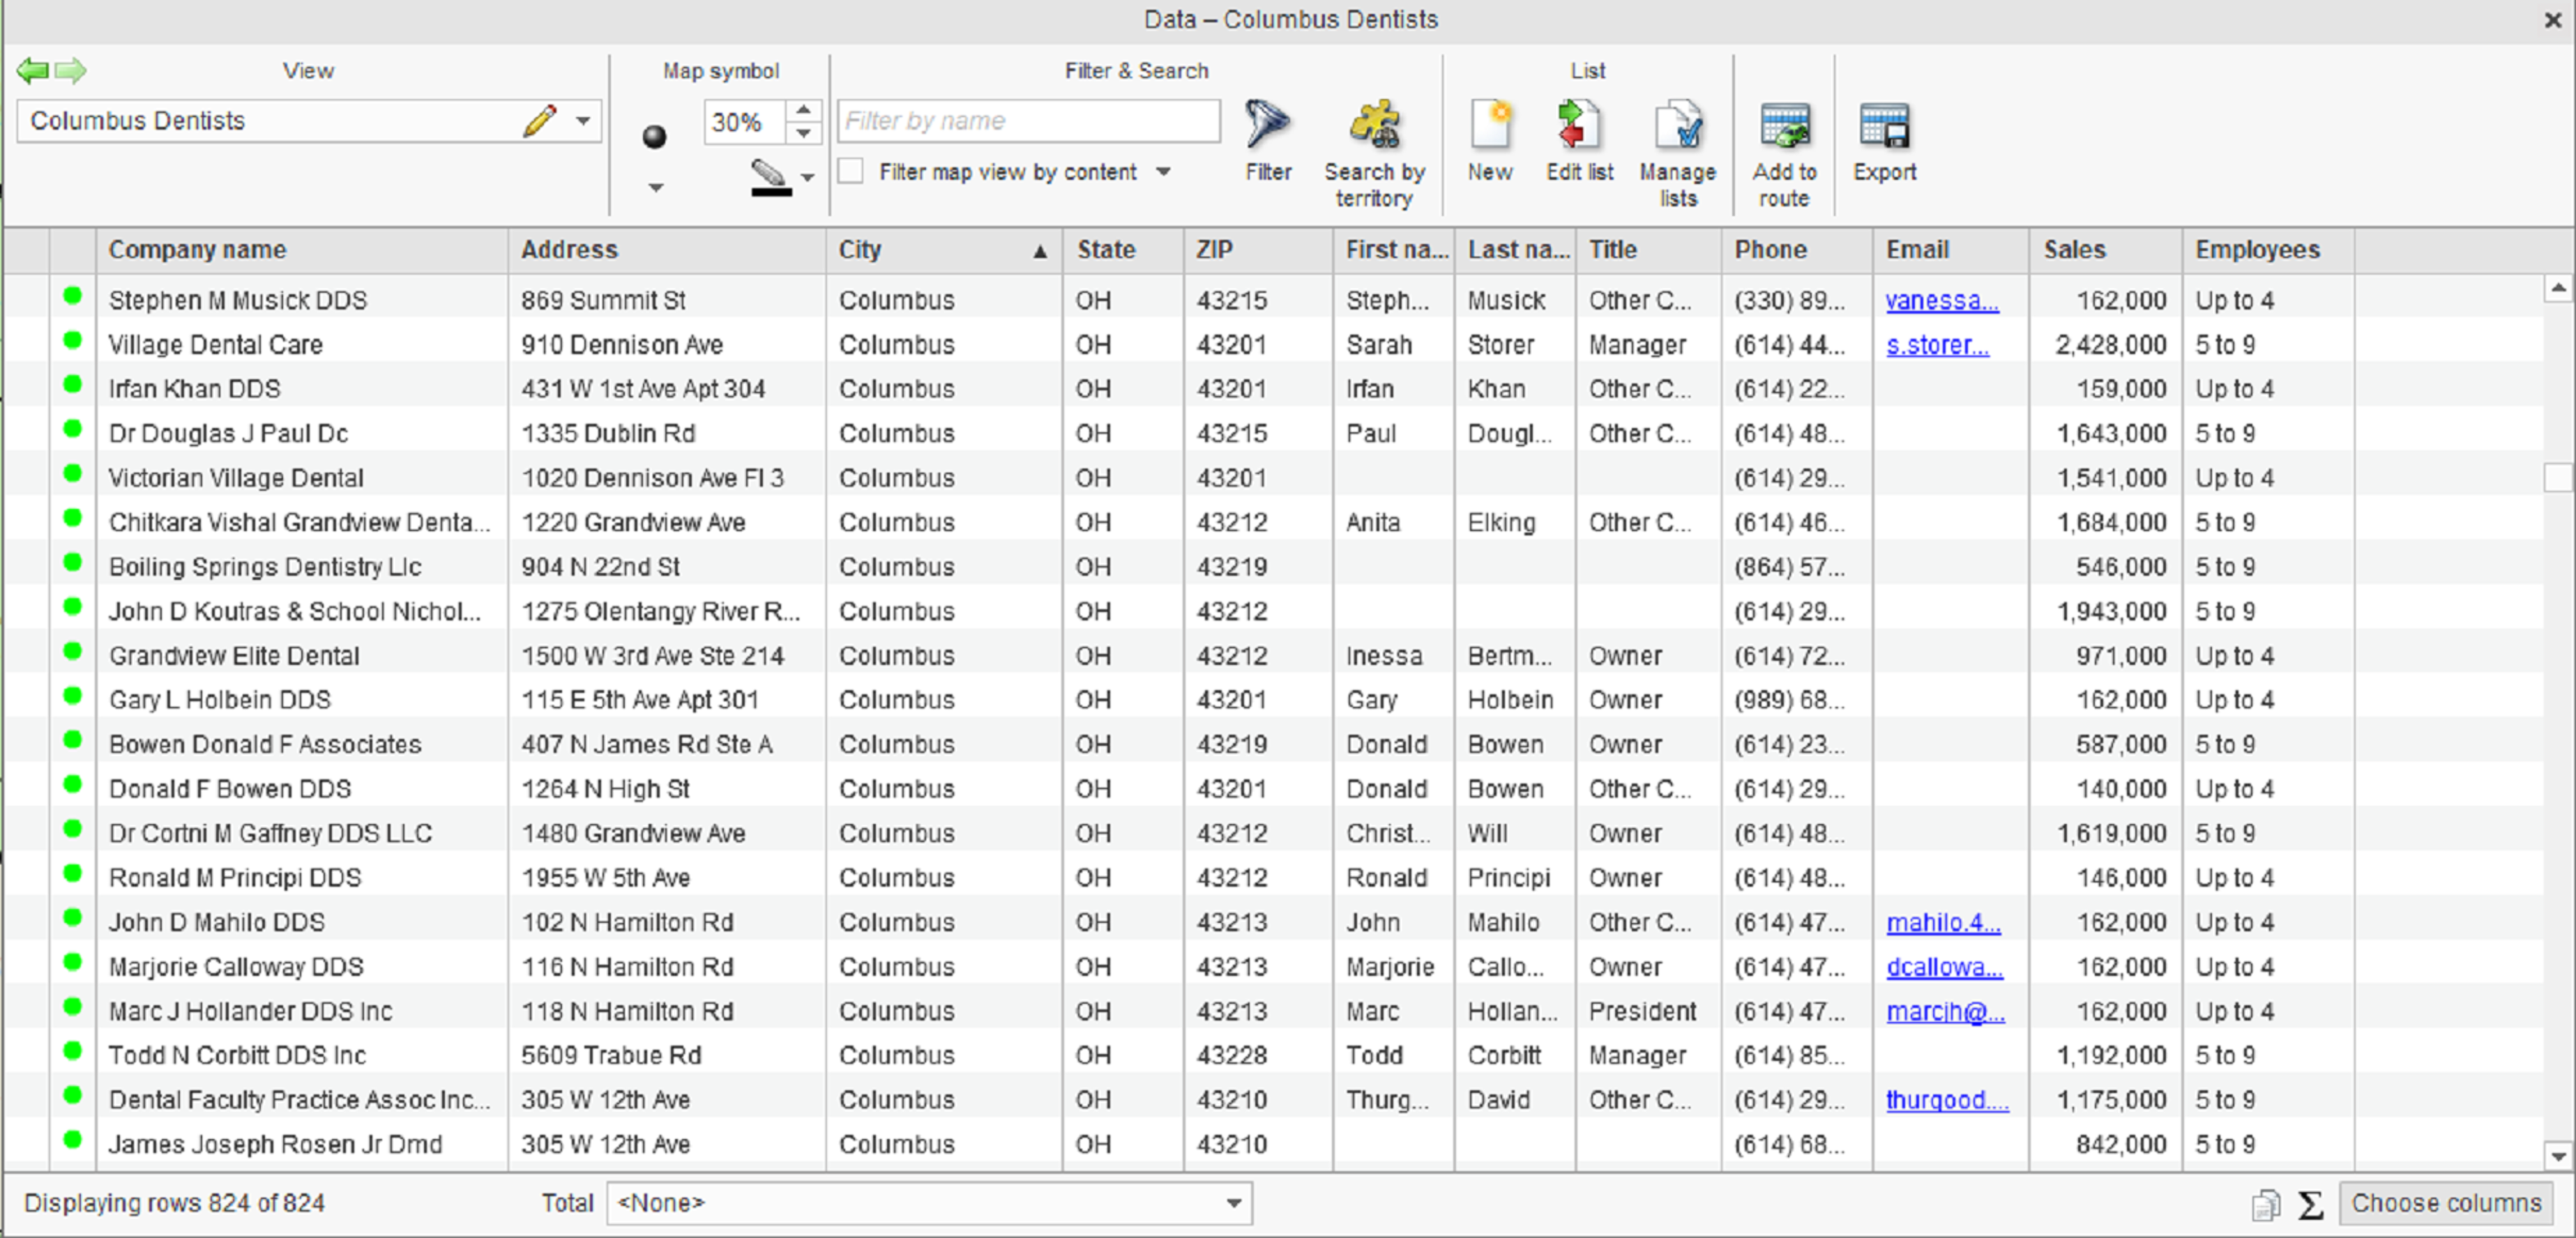
The competitor density map tells you where to look. If you want to know who you'd be competing against before committing to a market, MapBusinessOnline's Data Window and Business Listings data let you review competitor records table-by-table inside the top-scoring ZIPs — business name, industry type, organization type, facility type, annual revenue estimate, contact details where available, and employee counts. It takes an extra ten minutes and can save months of guesswork.
Need Help?
Do you need help tweaking this approach based on your business requirements?


