How To Generate Demographics by Radius
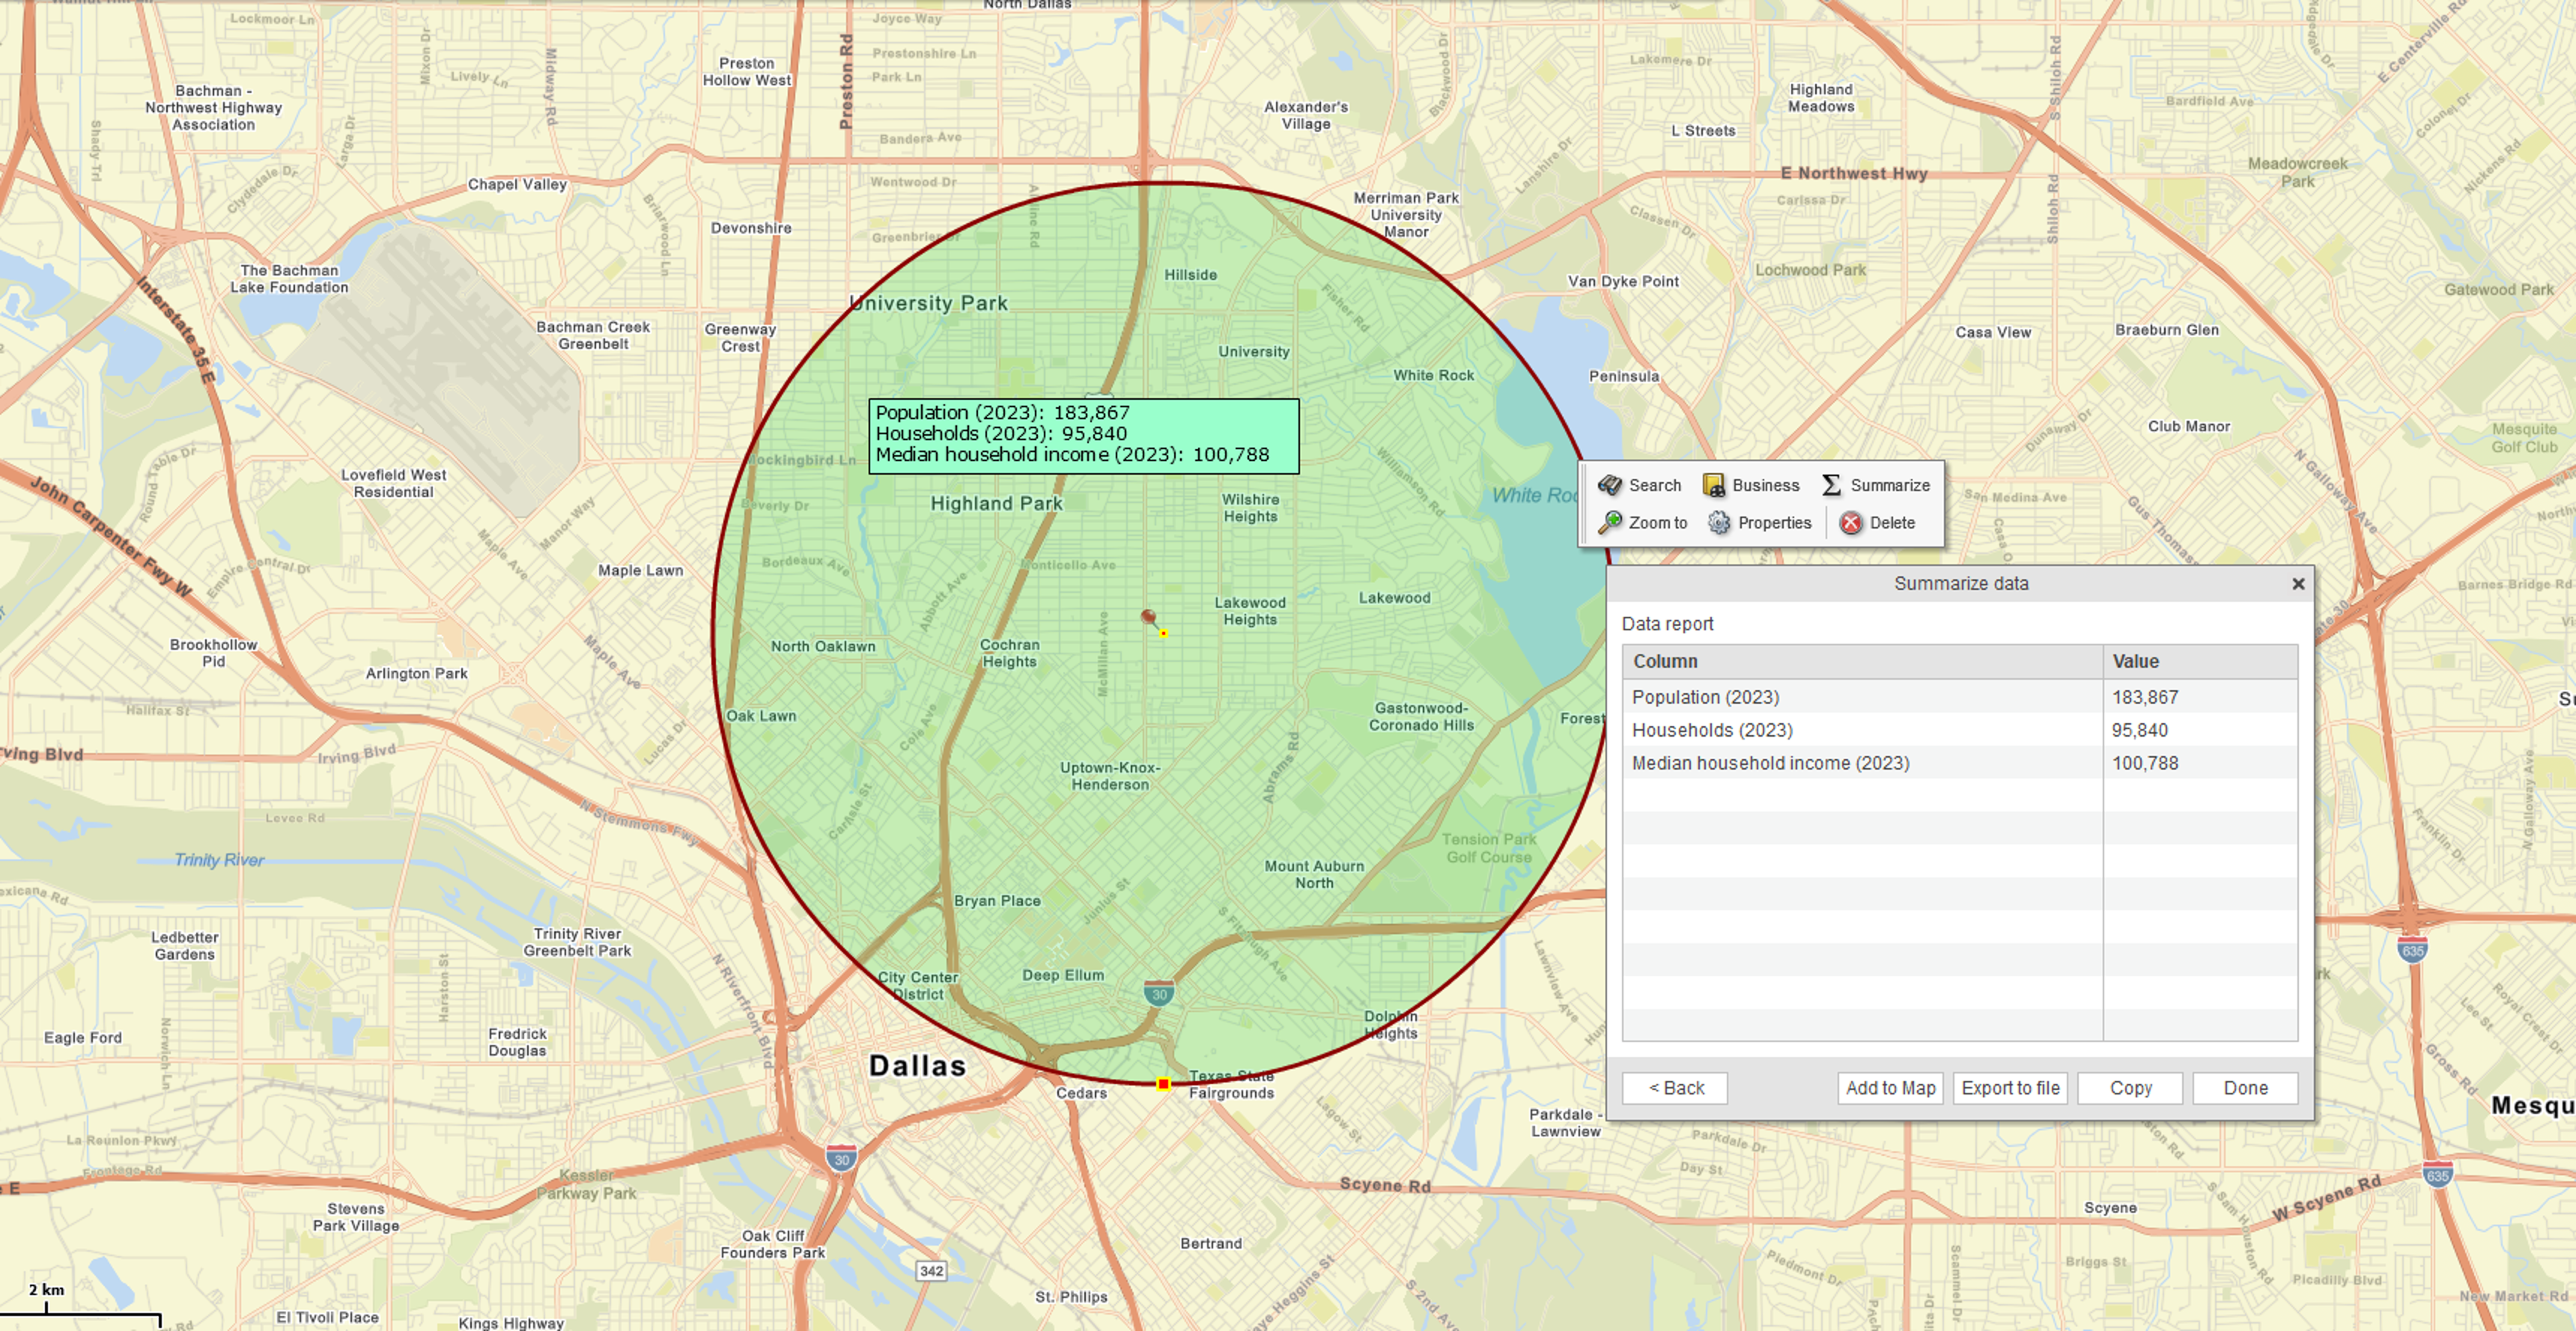
How To Get Demographics Around A Point
-
Find A Location: enter a street address or click the map to place the center point.
-
Set The Radius: type the distance in miles or drag the radius handle on the map.
-
Select Variables: choose the demographic fields you need (for example, Population; Households; Median Household Income).
-
View The Data Report: totals appear for the area within your circle.
-
Export To File: download a CSV for spreadsheets or BI.
Unlimited demographic reports and powerful mapping; plans from $150.00/year
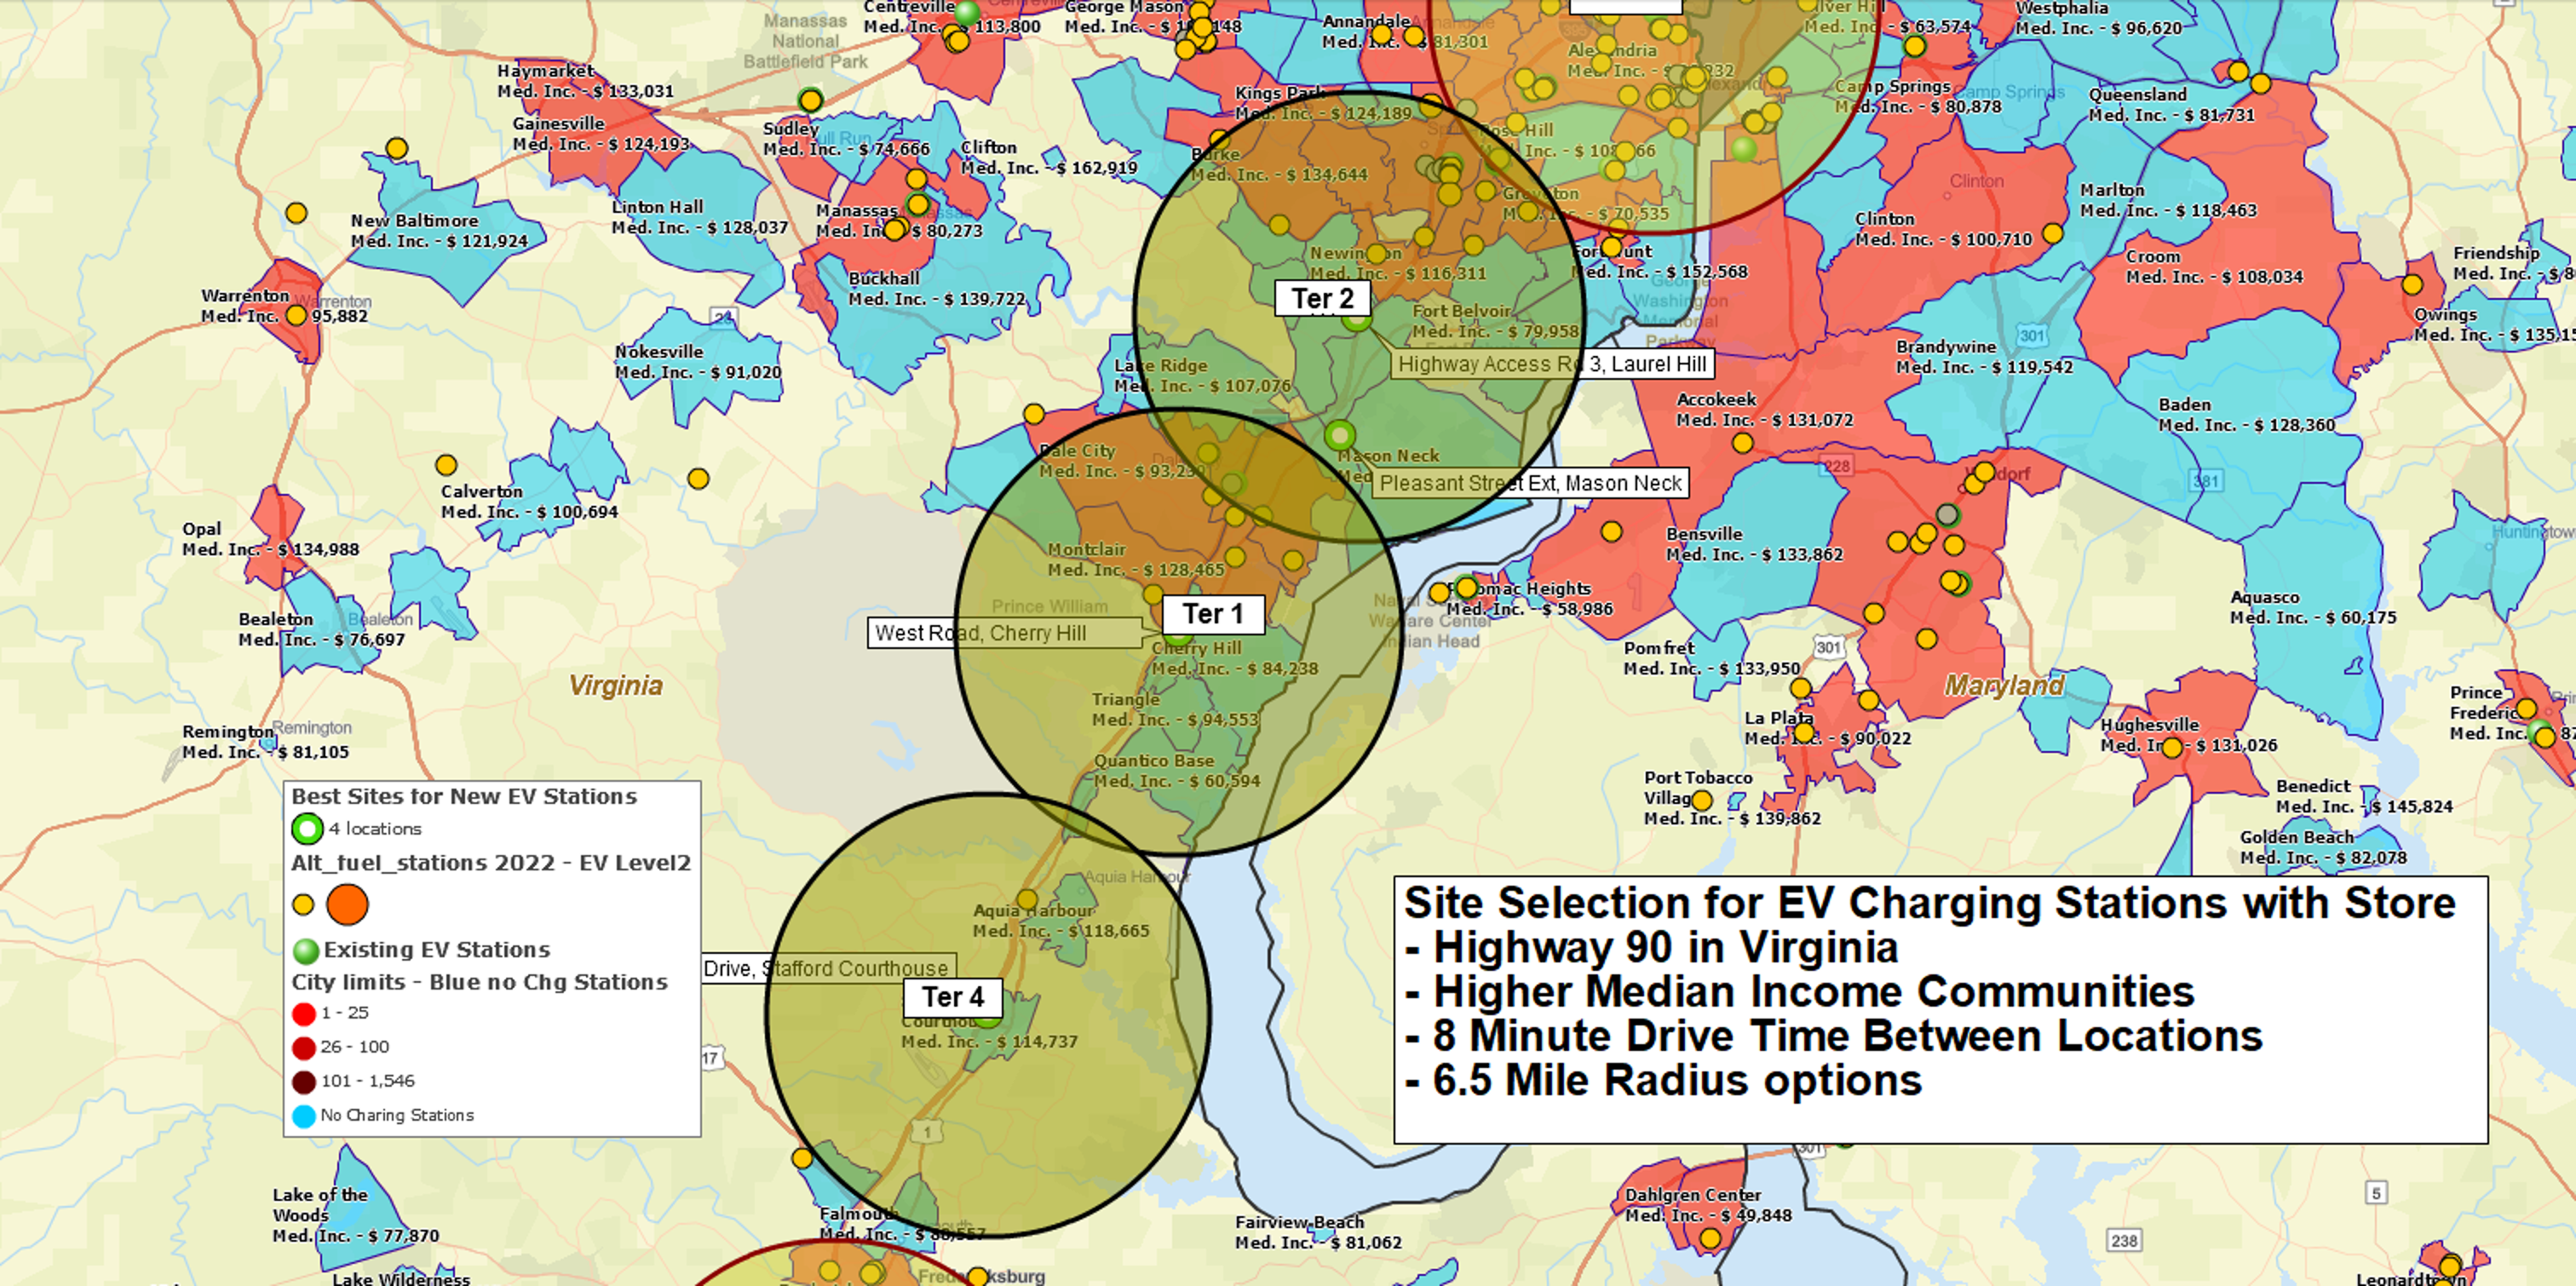
What You Can Do With Demographic Maps
Once you’ve generated a radius and seen the Data Report, you can turn that result into a clear, visual story for planning and site selection. These options help you move from a table to decisions on a map enhancing your workflow.
-
Color-Code Geographies By Variable: color-shade ZIPs, Counties, or States by Population; Income; Age; and more to reveal patterns and gaps.
-
Compare With Your Business Data: overlay customers; stores; or sales to find look-alike markets and prioritize outreach.
-
Site Selection Using Demographic Profiles: shortlist candidate locations using measurable criteria — e.g., 3-mile Population ≥ 40,000; Median Household Income ≥ $70,000; Households With 4 or More People ≥ 25%.
-
Filter By Value Ranges: focus on areas that meet specific thresholds — e.g., ZIPs with Population above 50,000; Median Household Income between $60,000 and $85,000; Age 25–44 share above 35%.
Learn more about Demographic Mapping.
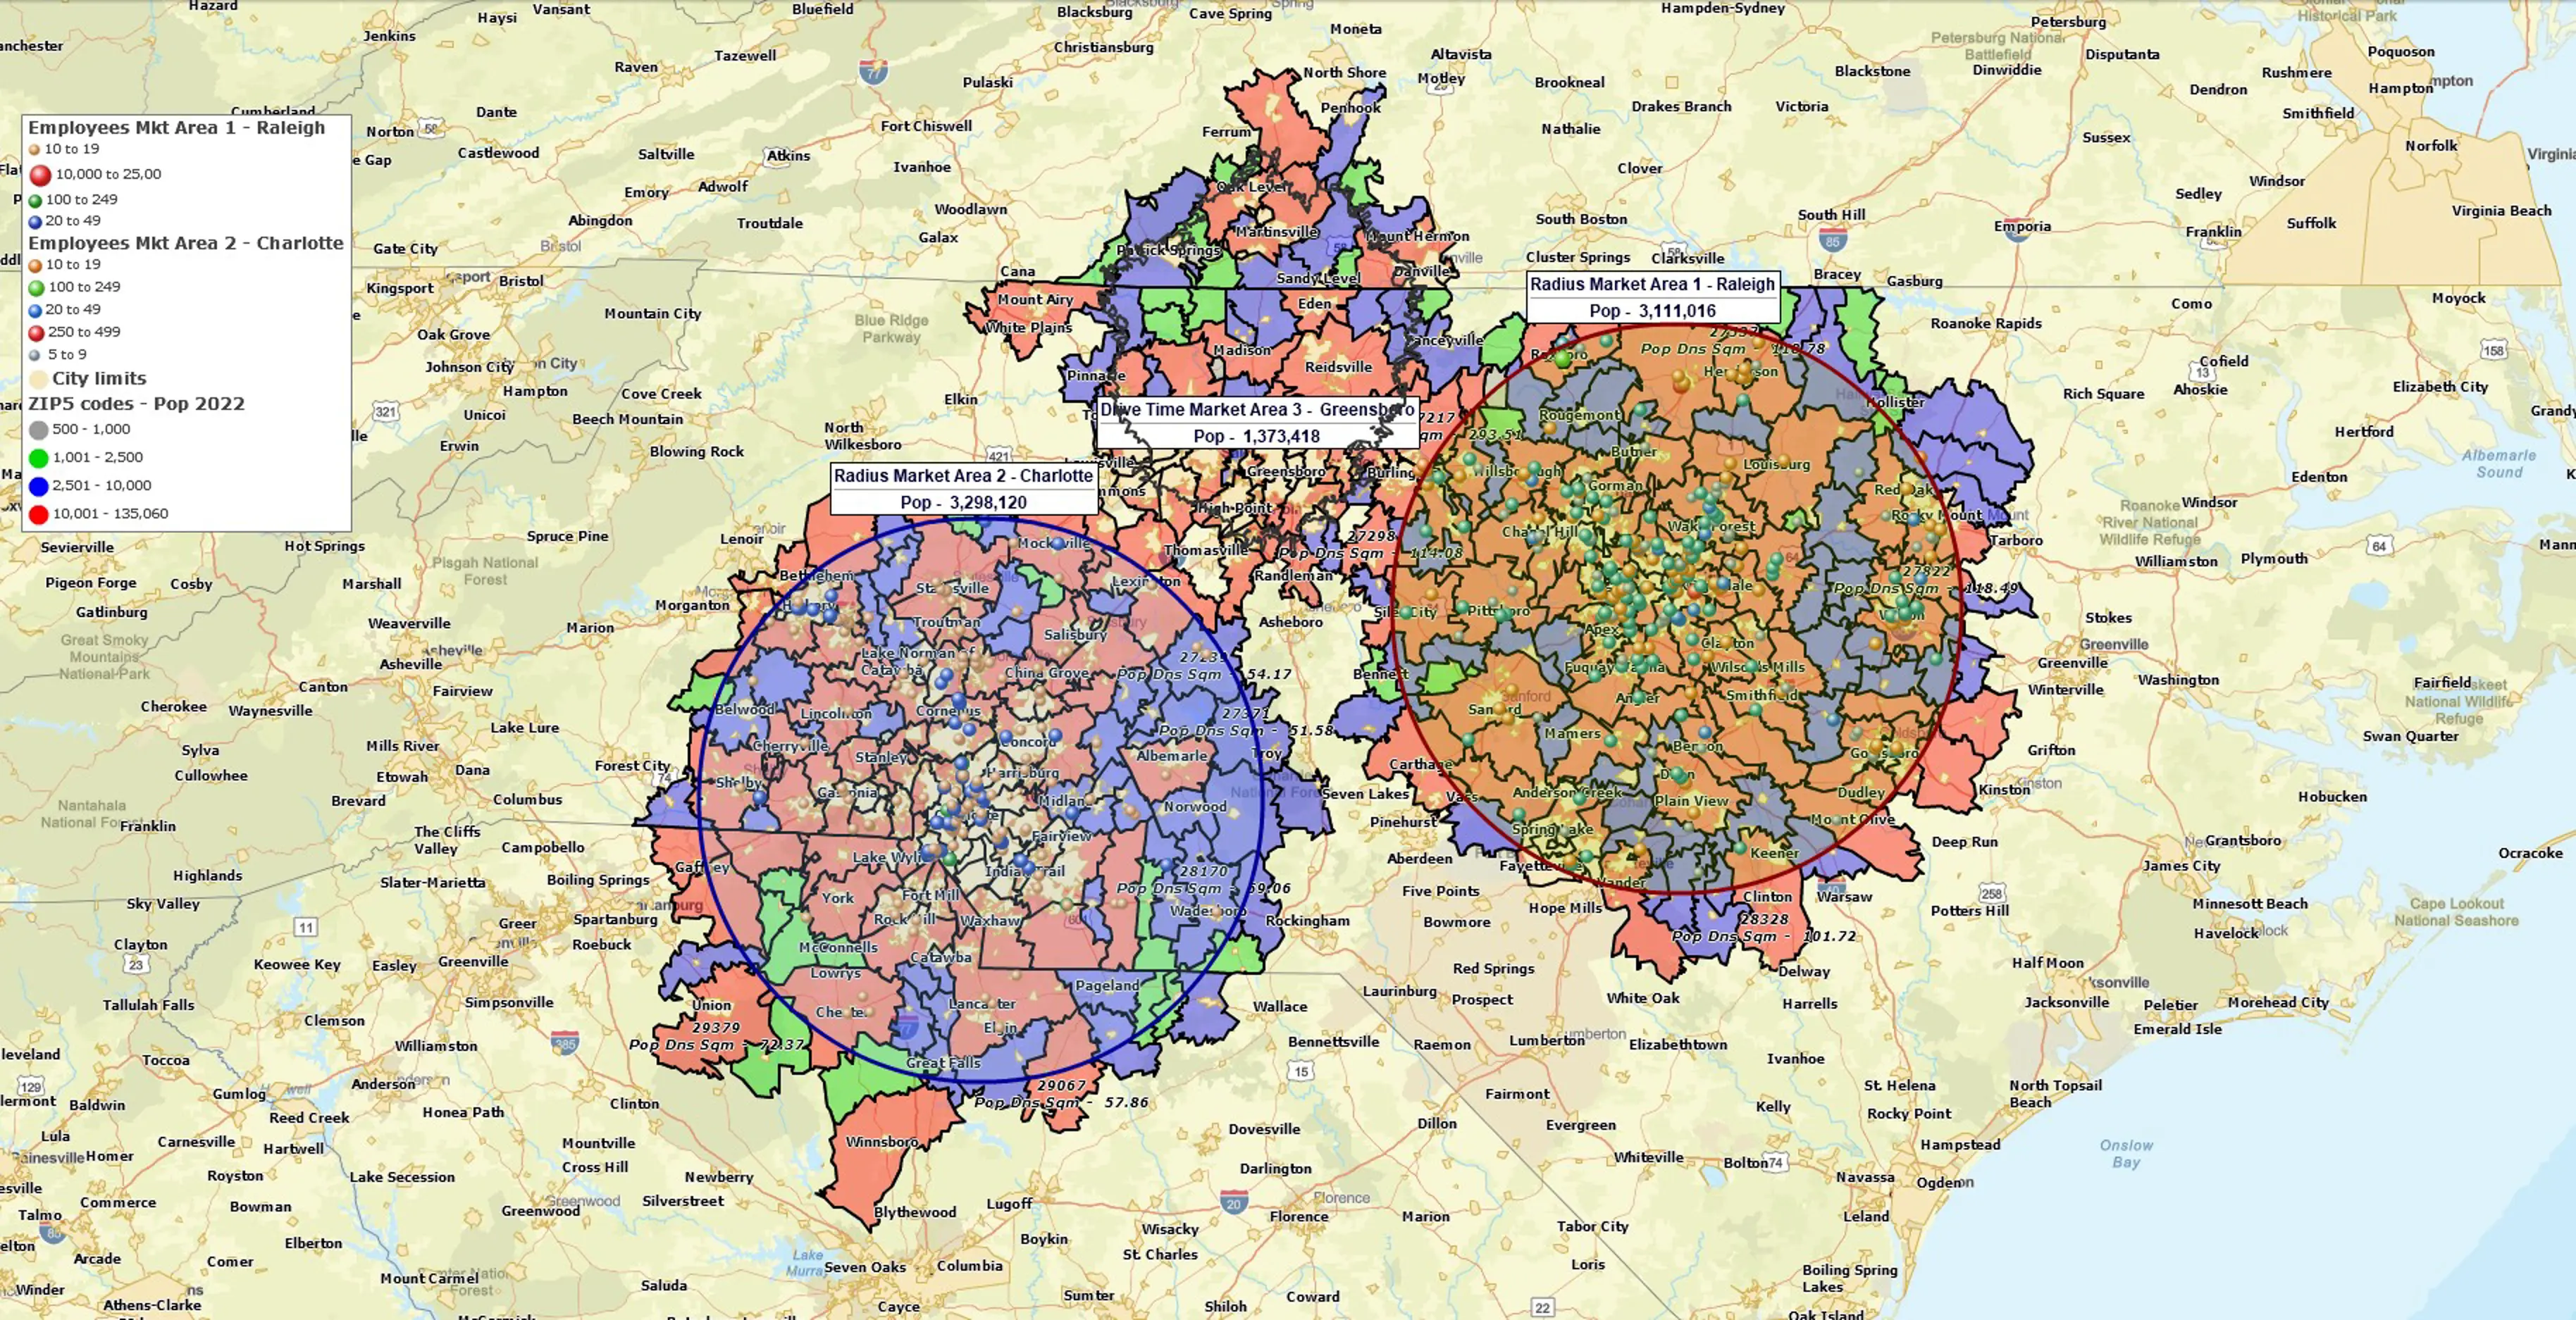
More Ways To Define Your Area Of Interest
Different questions call for different area shapes. If a simple circle isn’t the best fit, choose an option that mirrors how people reach you or how your organization defines market areas.
-
Drive-Time Areas (Minutes-Based Reach): model real access using travel time instead of distance when minutes matter more than miles.
-
Drawn Polygons And Freehand Shapes: sketch custom boundaries to reflect local knowledge or planning zones and generate the same demographic report.
-
Territories Built From Existing Boundaries: combine ZIP Codes; Counties; Cities; or Census Tracts into sales or service territories and roll up demographics consistently across regions.
-
Multiple Areas From A Set Of Points: create many radii or drive-time areas at once for candidate sites or store networks to batch-compare demographic totals.
About The Data
Demographic totals are derived from current Census-based datasets available in MapBusinessOnline. Data is refreshed in line with new releases so your radius results reflect the latest available figures used across demographic mapping.
Export And Share
Use Export To File to save the Data Report as a CSV for spreadsheets or BI; or share results as an interactive map with public or private access controls so stakeholders can explore the same demographic radius analysis within the visual map context.
Unlimited demographic reports and powerful mapping; plans from $150.00/year


