Color-Coded Maps
How You Can Benefit from Color-Coding Maps in MapBusinessOnline
- Color code business locations with circles, symbols, or charts to visualize sales volume and market opportunities, classify customers, and compare other important business characteristics.
- Create color-coded demographic maps using the Census demographic data included with your subscription to compare markets using population, household income, age groups, and other available demographic data.
- Color code geographic areas and territories – including ZIP Codes, counties, cities, states, census tracts, and sales, service, or franchise territories – to compare performance across the areas that matter to your business.
- Group locations and summarize business data by geographic area using customer counts, sales totals, averages, or other numeric values to reveal geographic patterns and compare markets.
- Define value ranges and assign colors to each range to distinguish underperforming, highly productive, and in-between territories or geographic areas at a glance.
- Combine multiple map layers on the same map to compare business performance with demographic characteristics and territory boundaries and put your results into geographic context.
- Share interactive maps, export presentation-ready images, or print large-format wall maps to communicate geographic insights with colleagues and decision-makers.
Choose the Color-Coded Map That Fits Your Business Data
MapBusinessOnline gives you several ways to turn business and demographic data into visual maps. Explore the options below to find the map style that best fits what you want to compare, highlight, or communicate.
Color-Coded Boundary Maps
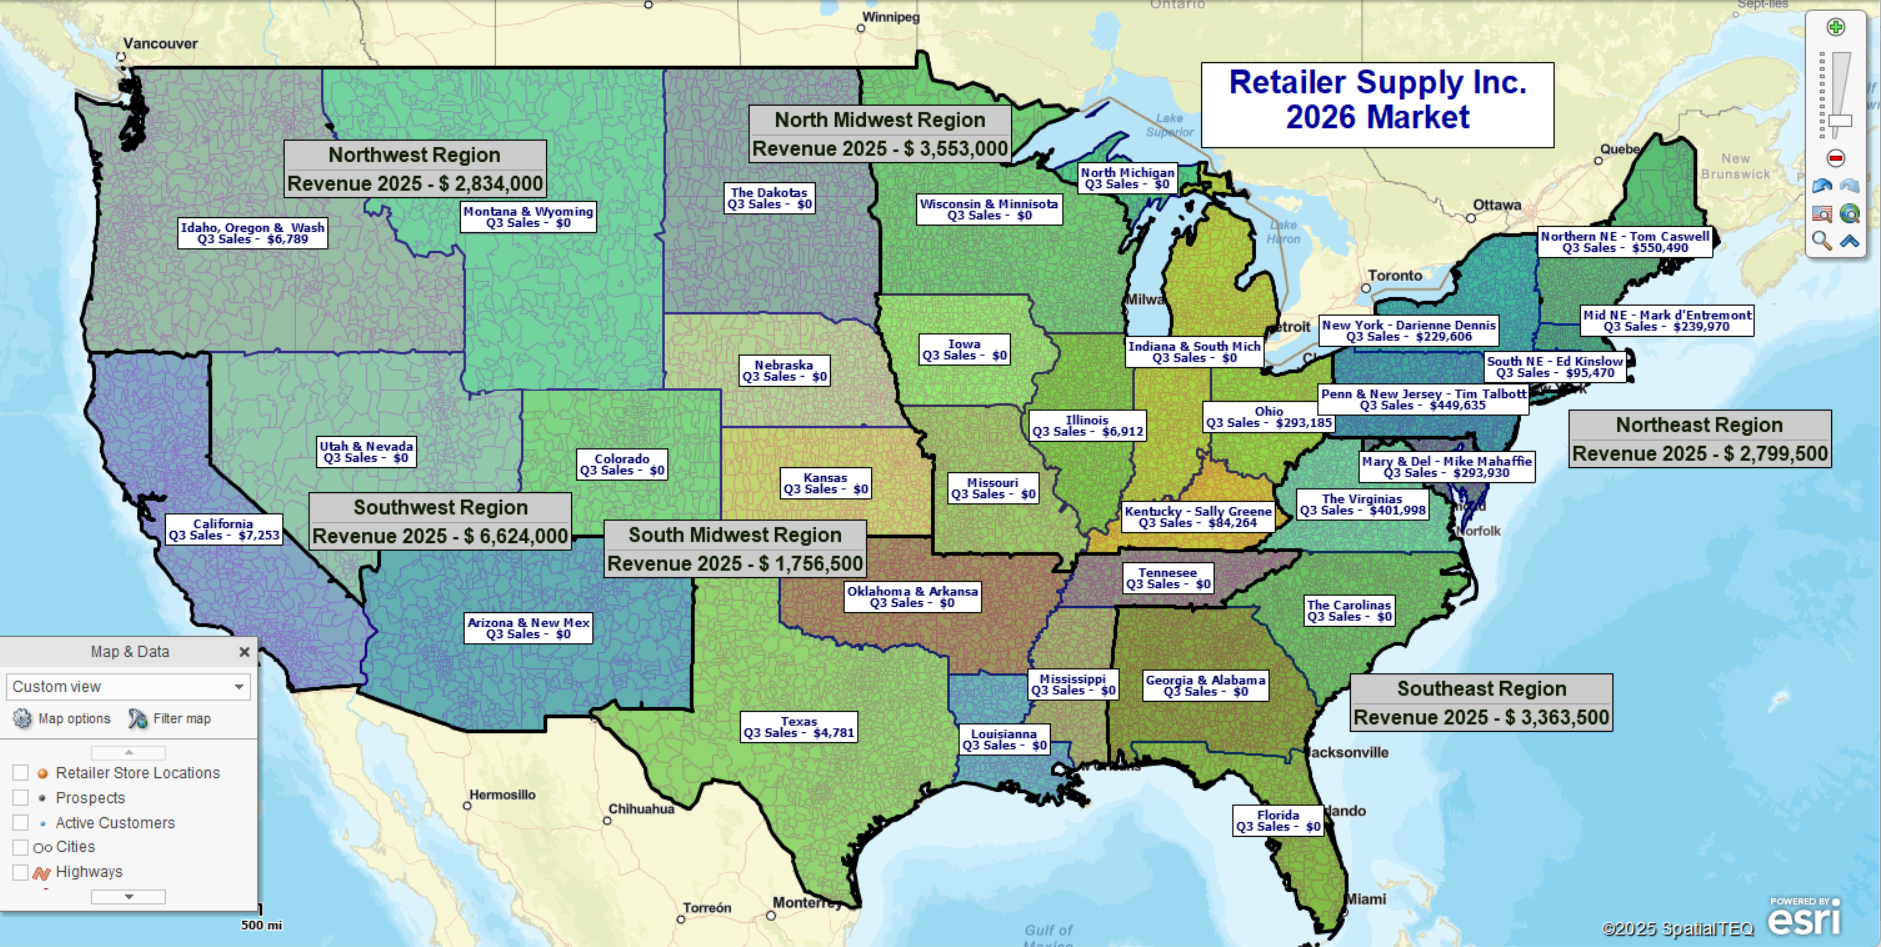
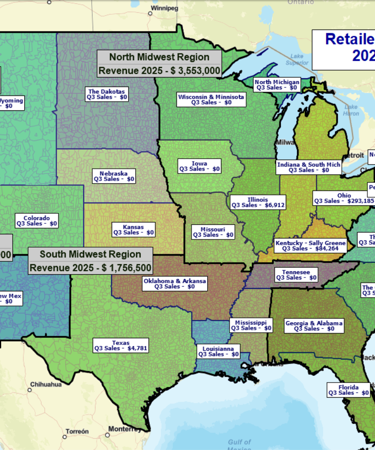
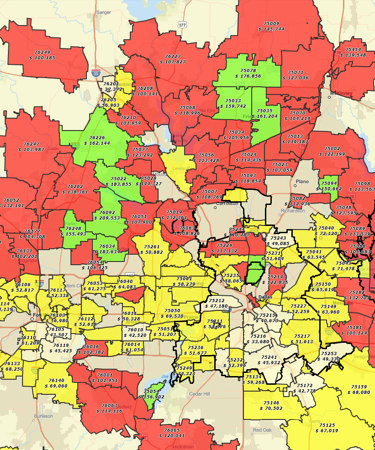
Color-shade geographic areas to compare business performance across ZIP Codes, counties, cities, states, census tracts, or sales, service, and franchise territories. Summarize your business data such as customer counts, sales totals, averages, or other numeric values, then define value ranges and assign colors to quickly identify high-performing, underperforming, and emerging market areas.
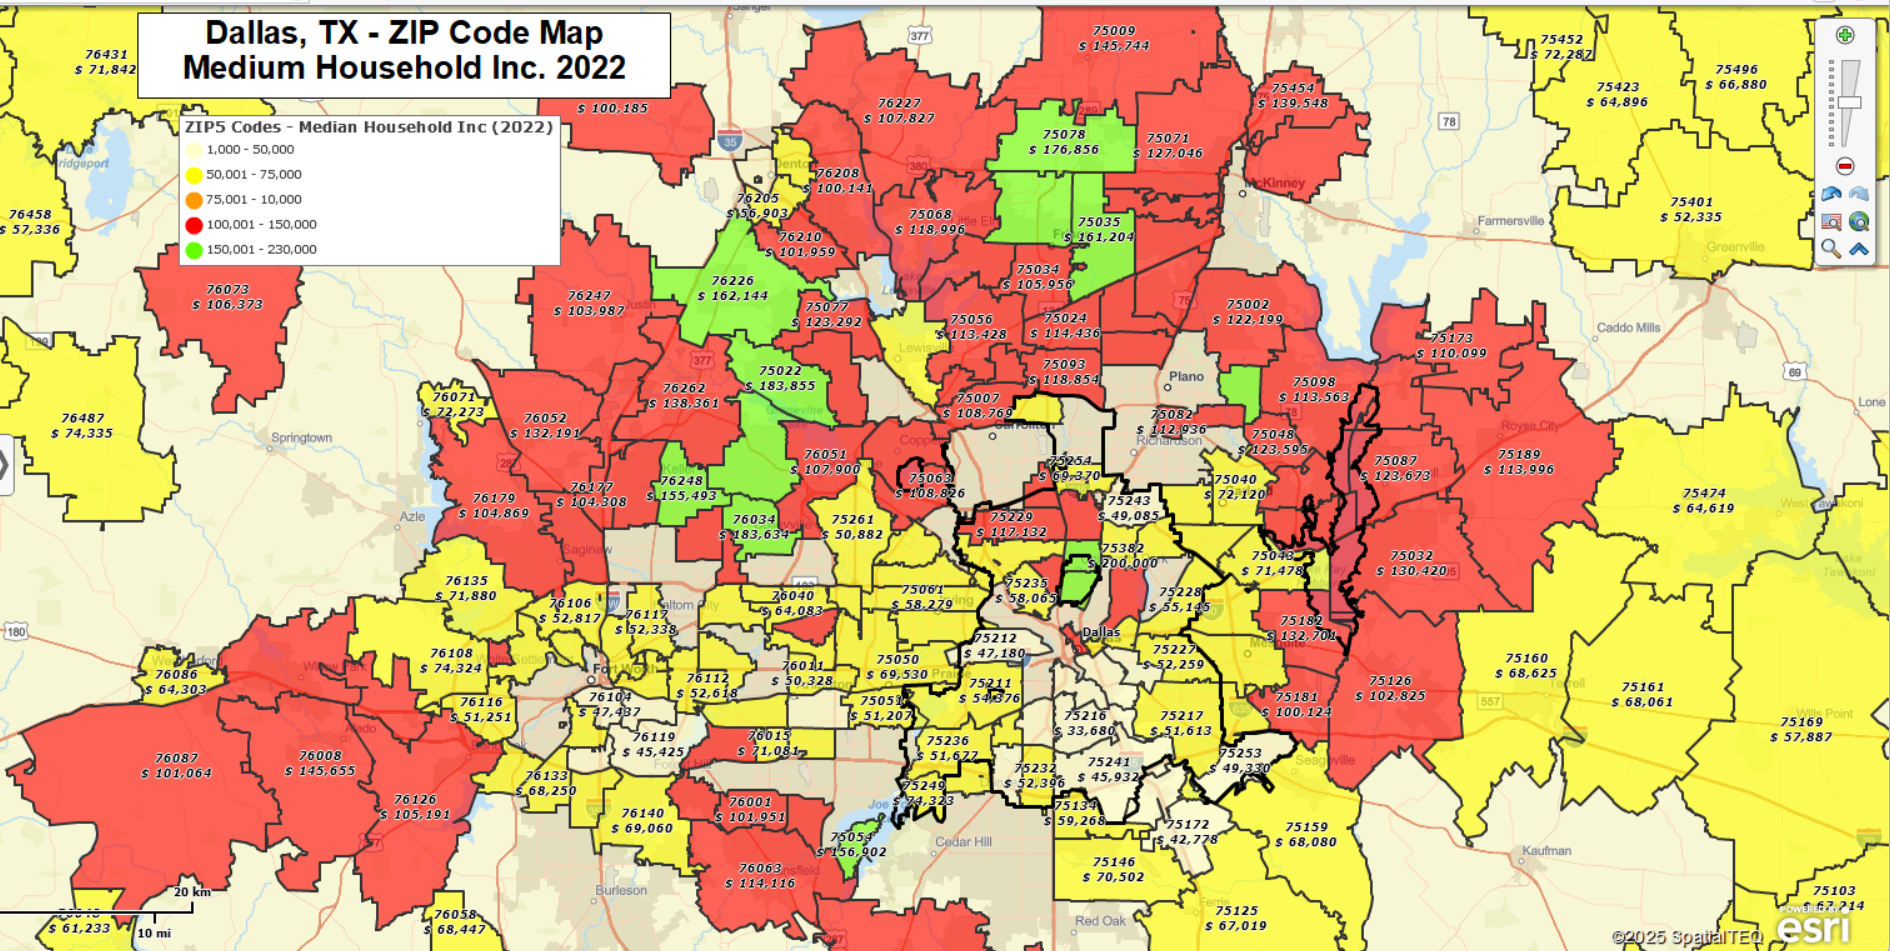
You can also create color-coded demographic maps using the Census demographic data included with your subscription to compare geographic markets by population, household income, age groups, and other available demographic characteristics:
Bubble or Circle Maps
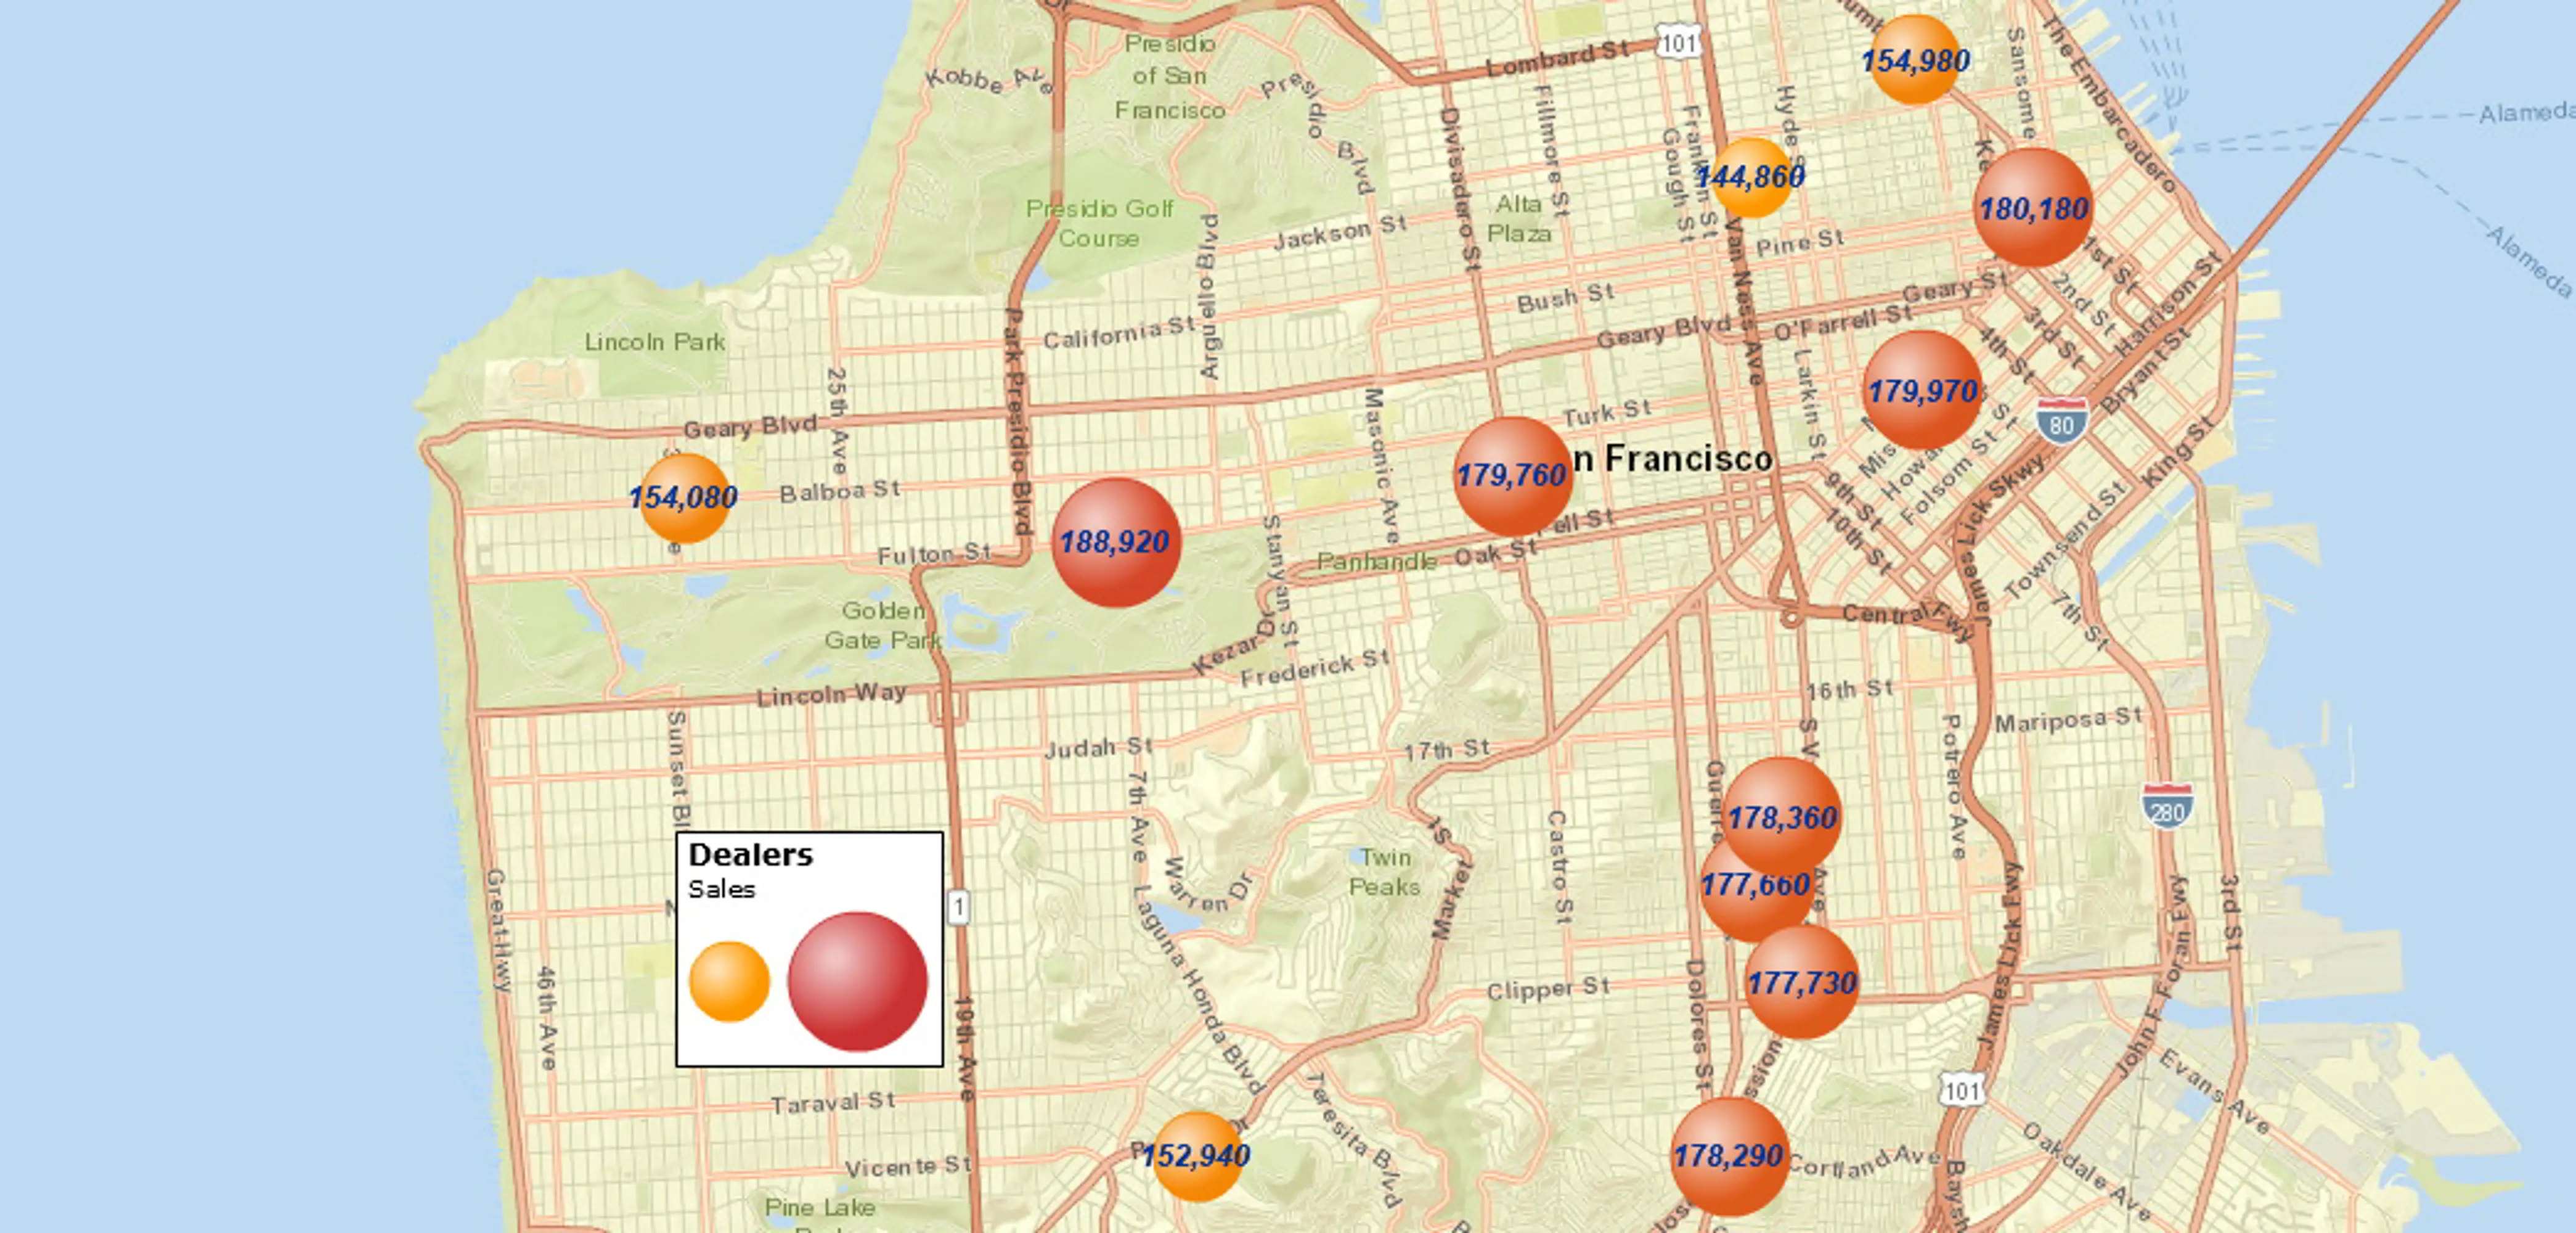
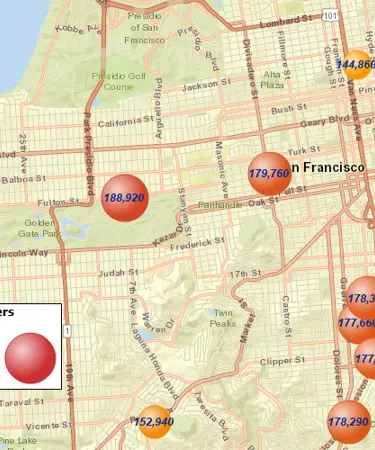
Use customizable circle colors and sizes to visualize numeric business data such as sales, customer counts, or other values. Bubble maps make differences in magnitude easy to recognize and help reveal high- and low-performing locations at a glance.
Display circles at individual mapped locations, or group locations by ZIP Code, county, state, or another geographic area and display a summarized circle at the area's center. This lets you compare individual locations or broader geographic markets using the same visual approach.
Variable Symbol Maps
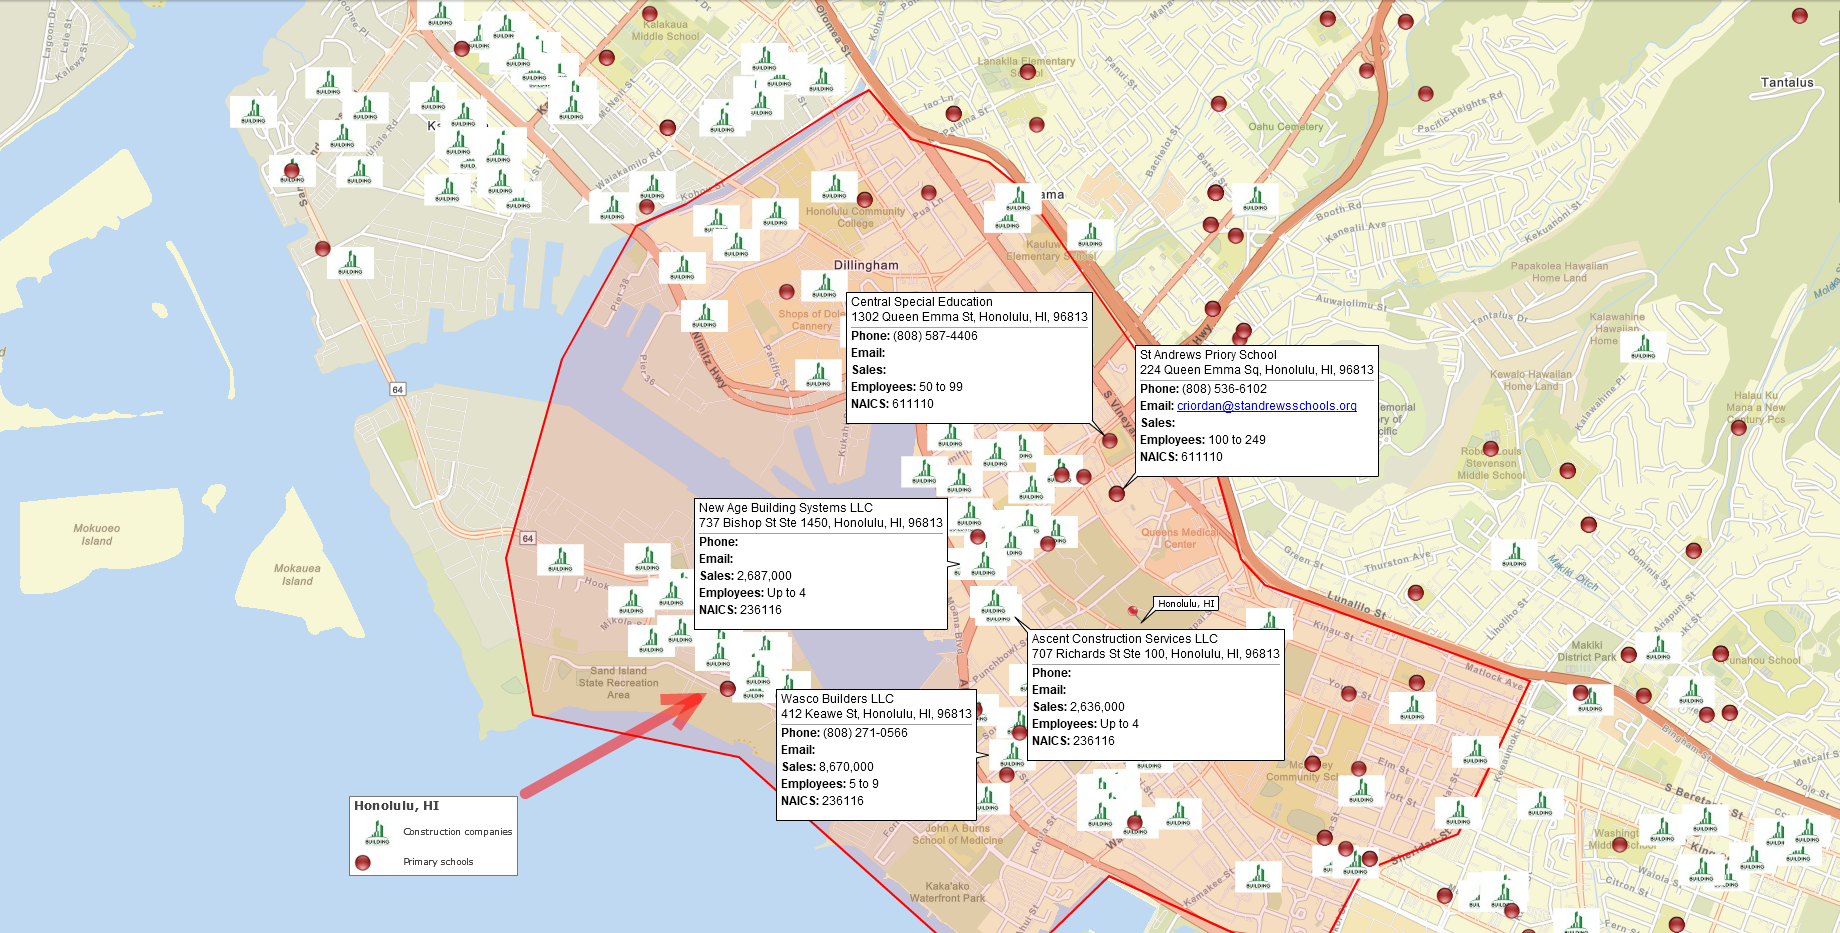
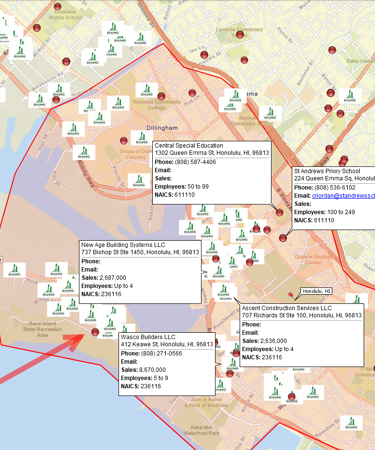
Assign different symbols, colors, and sizes to mapped locations to classify customers, products, opportunities, or other categories in your business data. Use MapBusinessOnline symbols or import your own symbols to make important location types easy to recognize on the map.
Symbols can represent individual business locations, or you can group locations by ZIP Code, county, state, or another geographic area and display a symbol representing the summarized data at the area's center.
Chart Maps
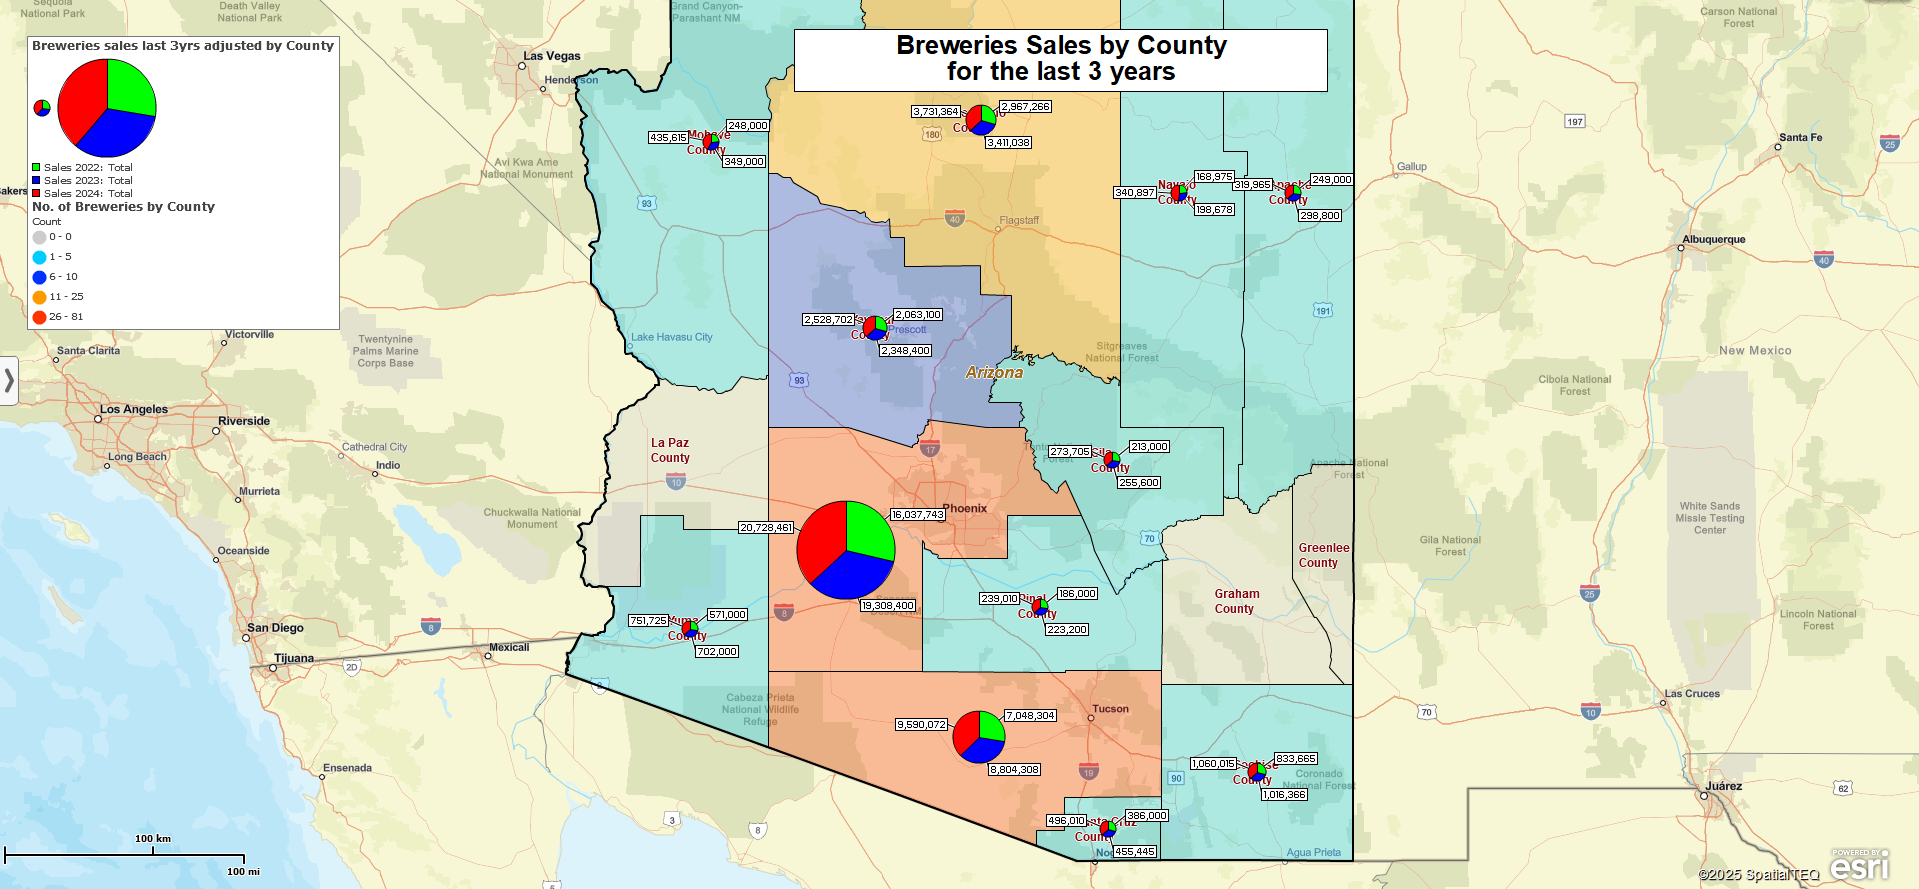
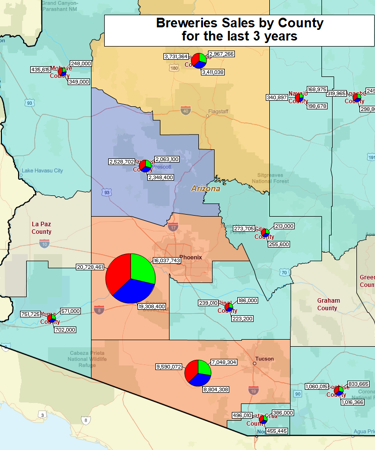
Display bar, column, or pie charts on the map to compare multiple business values at a glance, such as sales by year, sales by product, or customer counts by type. Chart maps let you see both where business activity occurs and how several values compare at each location.
Display charts at individual mapped locations, or group locations by ZIP Code, county, state, or another geographic area and display a chart representing the summarized data at the area's center. This is particularly useful when you need to compare multiple metrics across geographic markets rather than visualize just one value.
Know When to Use Heat Maps Instead
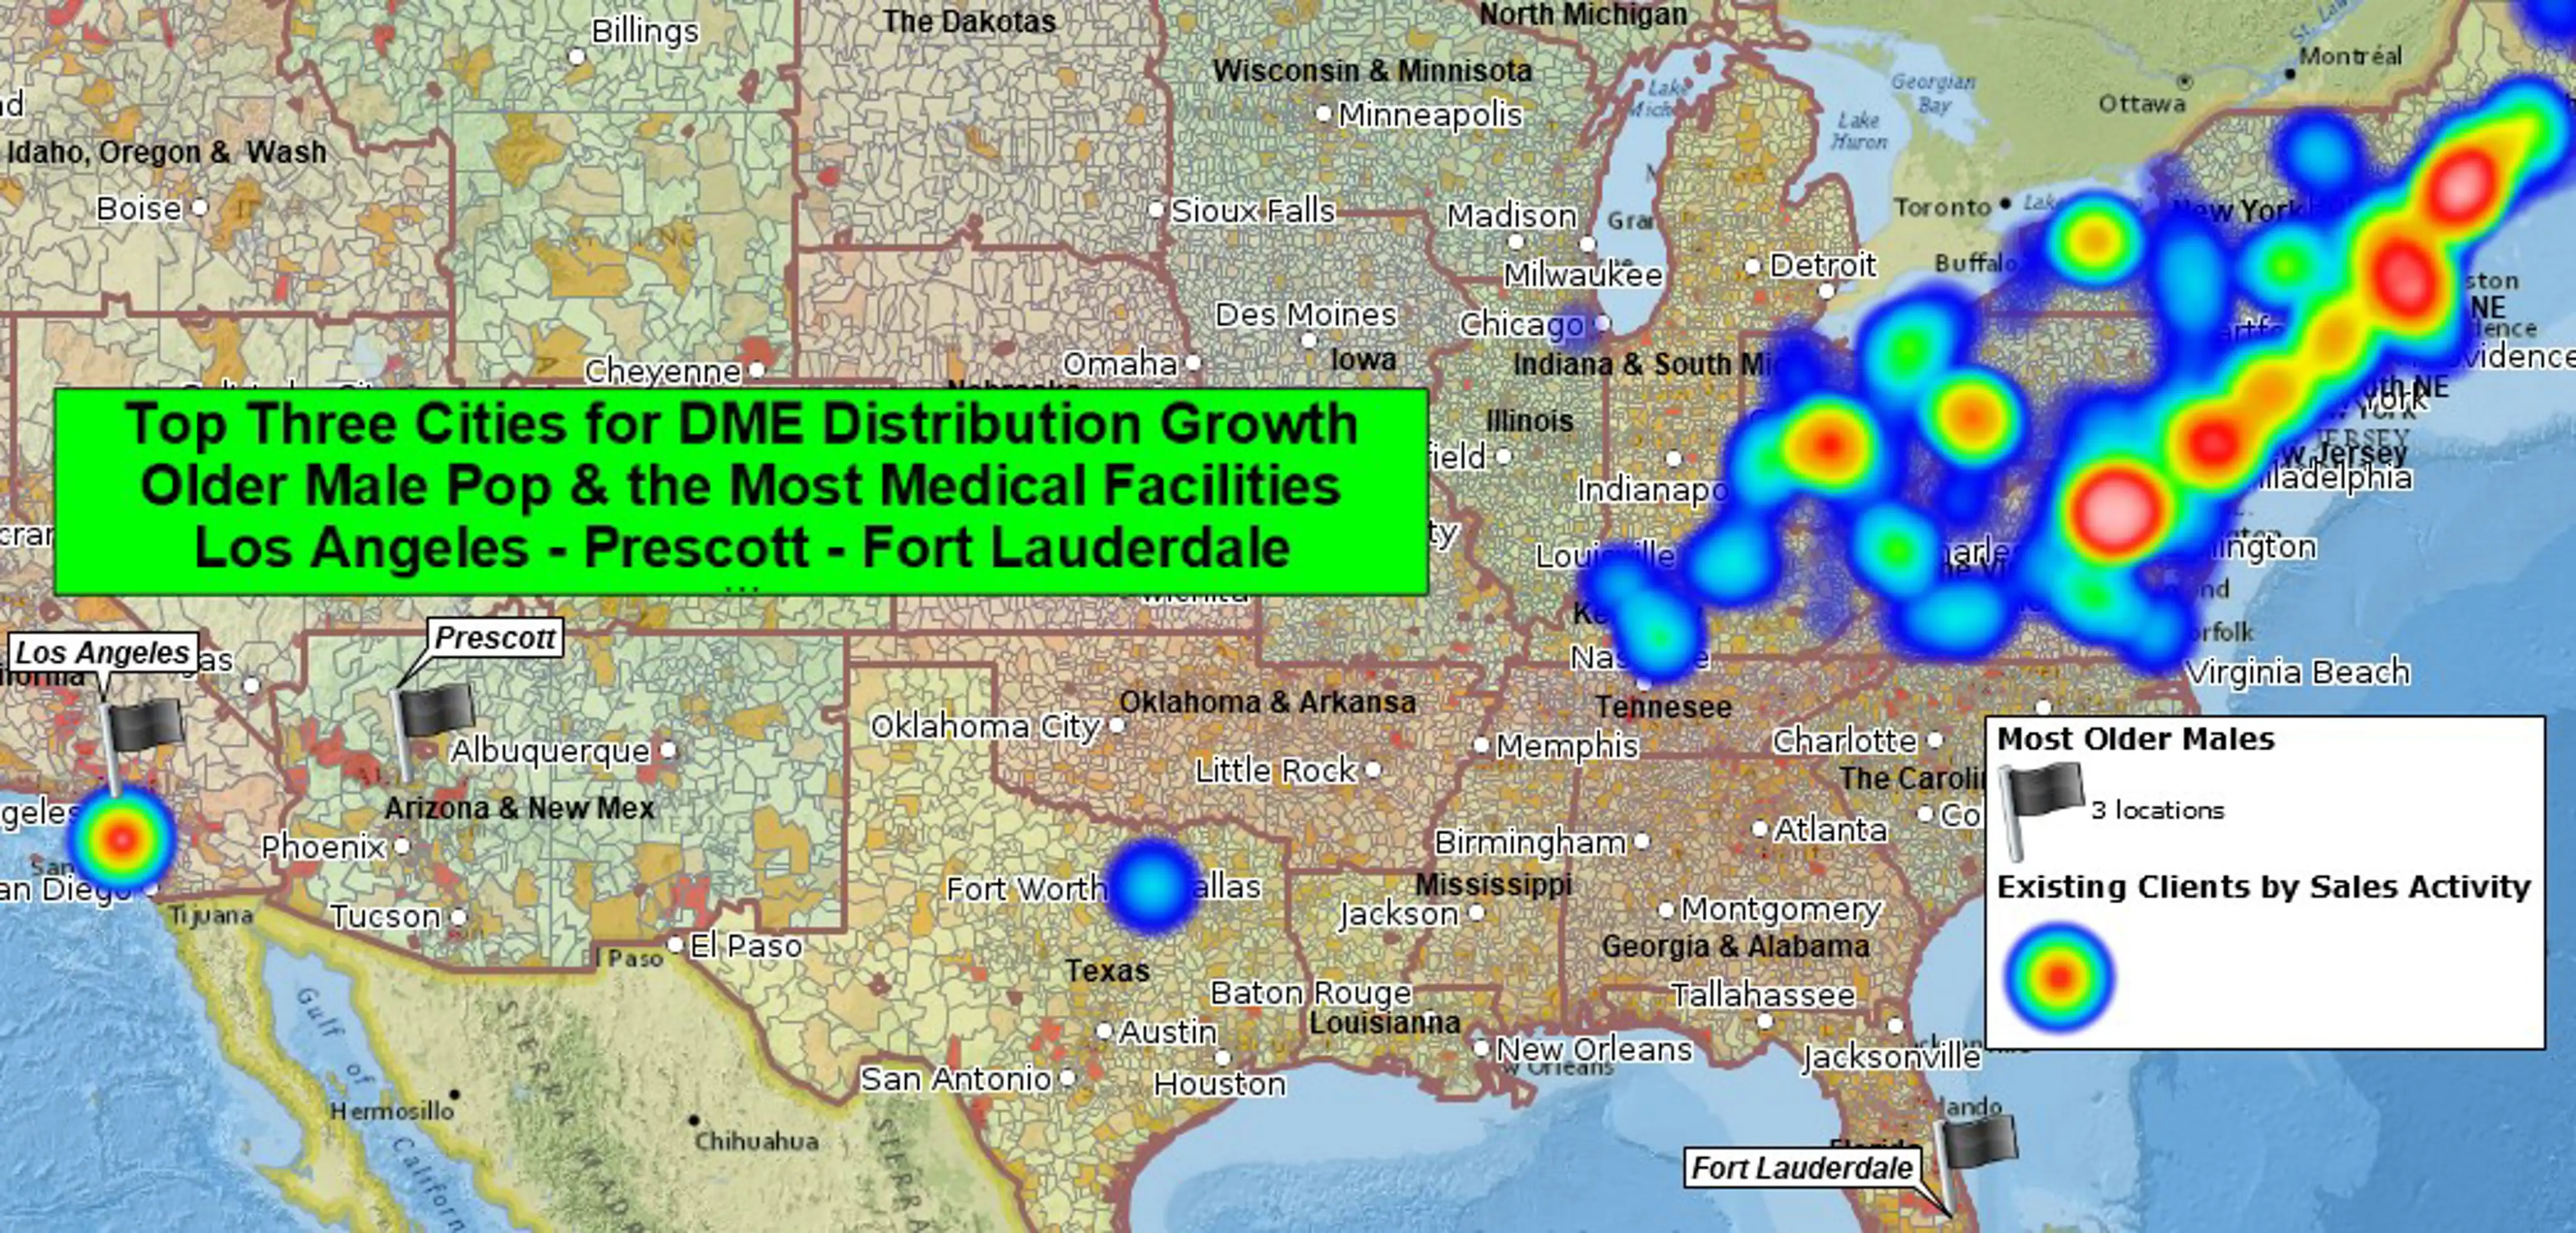
Although the terms are often used interchangeably, color-coded maps and heat maps answer different business questions. Both use color to visualize geographic data, but they represent that data in different ways.
Use color-coded maps when you want to compare business metrics (like sales, customer counts) or demographic parameters (like population or household income) across mapped locations or defined geographic areas such as ZIP Codes, counties, states, territories, etc.
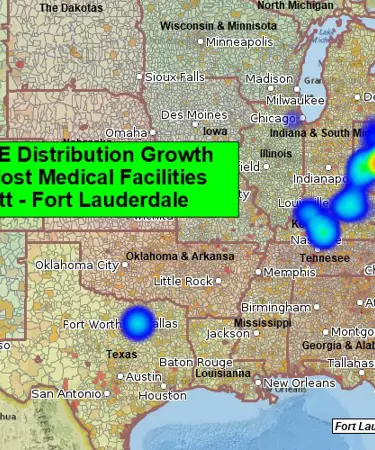
Use heat maps when you want to reveal the natural concentration of customers, prospects, stores, service calls, or other business locations – regardless of geographic boundaries. Heat maps use graduated color intensity to emphasize concentrations of business locations, making it easy to identify market hotspots, underserved areas, and geographic trends at a glance.
Looking for a deeper explanation of heat maps and their business applications? Visit our Heat Maps solution page to learn more.
See MapBusinessOnline in Action
Request a demo
Learn How Our Customers are Succeeding with MapBusinessOnline

This leading national footwear brand manufacturer uses MapBusinessOnline to conduct retail coverage assessments nationwide. They loved MBO’s ability to provide both street level detail and USA wide high level views of points-of-sale. Importing location enabled address databases for symbolization and color shading is easy. New and planned stores can be added to the map market analysis as products are launched and mature.
"Importing location enabled address databases for symbolization and color shading is easy."
Todd Eichelberger
Sales Director
Adidas

"We use MapBusinessOnline to prepare for sales meetings. The program’s territory mapping enables color-coded sales territories by zip-code helping to define sales responsibilities and keeping our focus on selling."
Christie Shedd
Operations Manager
AFTCO Bluewater

"I have been using MapBusinessOnline for about 8 months and couldn’t be happier with the services it provides. I have employees and myself who map around 250 routes monthly for our sales team. The interface is easy-to-use and the abilities are exactly what I need. My sales team finds the maps and step by step routes easy to follow and accurate. My store lists change every quarter and the uploading system allows me to quickly upload a new list and categorize the account by priority using colors and shapes. I have also used the heat mapping capabilities and found those easy to customize and quick to use. As with any advanced software, this does take a week or two to learn the more complex features, but it is well worth the time invested. This is the software I would have designed if I was to create one myself. Great job!!!"
Bill Hanavan
Director of Operations
Strategic Retail Solutions

Popular MapBusinessOnline features
Color code maps by ZIP code, county, or state

Import business data by ZIP code to show it geographically. Create colorful maps for business analysis that connect real Census data to locations on the ground.
Display business data against demographic maps

Categorize geographic areas by population or household income. Explore new markets, business patterns, or social trends against color coded Census maps for business and competitor analysis.
Visualize business data on map with various symbols

Assign specific symbols, colors, and sizes to your data points on map. Choose from a wide variety of symbols or create your own. Visually define customers and prospects across multiple locations using symbols color coding.
Illustrate business data on map with charts

Graphically depict your business data on a map using pie or bar charts. Use charts to show sales by product, invoices due vs. paid, products ordered vs. shipped, and sales by customer demographics.
Emphasize customers density with heat maps

Highlight market areas that generate more business. Visually compare map areas for business potential. Select from a variety of heat map colors and options.
Share business maps

Create interactive maps and share with friends, colleagues, dealers, customers, prospects or vendors. Share territory maps. Email saved JPEG and PNG files or embed map files in PowerPoint presentations. Includes PDF export for larger print formats.


