Presentation Map Software
From Spreadsheet to Slide in Minutes. Faster Prep, Tighter Meetings, Better Decisions
- Create presentation‑ready maps with pinpoints in minutes from Excel/CSV data — no GIS expertise required.
- Spotlight patterns with color‑coding, heat/density maps, and chart symbols.
- Style and brand your map: custom symbols, colors, labels, callouts, and legend.
- Present territories and trade areas (ZIP/county/state, radius, or drive time) with clear labels and colors.
- Draw and annotate custom shapes (radius, polygon, lines, text boxes) to focus the story.
- Add a context to your map with demographic data and business listings included.
- Share maps in multiple ways: export high-resolution images (PNG/JPEG) that can be inserted into PowerPoint and Word or emailed, - or share interactive maps (public or private) with access controls.
- Print large-format wall maps for workshops and executive briefings.
Create Presentation‑Ready Maps from Your Data
Turn a simple Excel/CSV list into a persuasive map with pinpoints in minutes — display customers, facilities, or event locations. Import a list of locations that matter for your presentation (Address, City, State, ZIP), style it once, and save a named map you can reuse across your slides. Plot large datasets and keep maps responsive while editing or demonstrating live. Use filters to present just the points that matter for your audience. Industry standard geocoding, clean basemaps, and a table view of all data will help you verify accuracy before presenting.
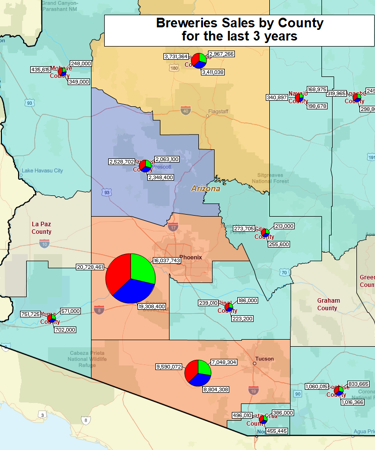
Visualize and Spotlight What Matters
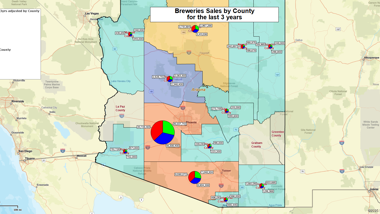
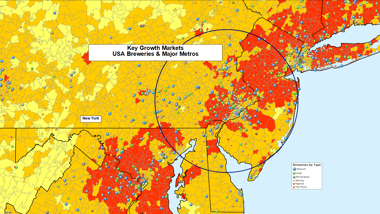
Make the slide tell one clear story. Color‑code areas (ZIP/county/state) by sales tier or any other relevant value. Create heat maps to show customer density. Use chart symbols (bar/pie) to compare metrics like revenue vs. goal at each location. Filter map data by territory, area, etc. to keep the view focused. Configure smart labels to display counts, KPIs, or territory names only where needed.
Brand, Label, and Annotate Map Slides
Make your map match the brand. Choose or upload symbols, style colors, and borders, and tailor labels/callouts to display the fields your audience needs. Add text notes, arrows, and free‑form shapes to highlight regions, corridors, or sites that are relevant to your story. Get cleaner, more persuasive slides that executives can read at a glance.
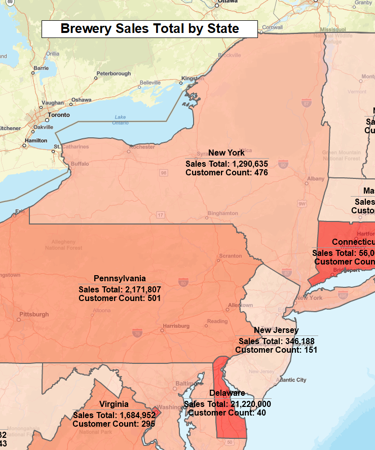
Present Territories and Trade Areas with Clarity
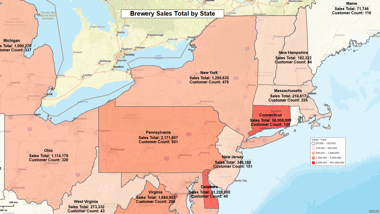
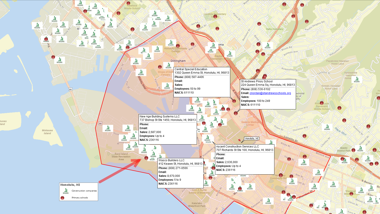
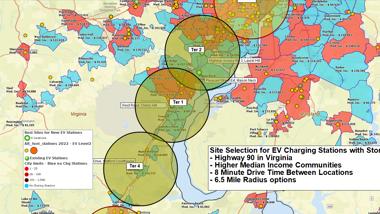
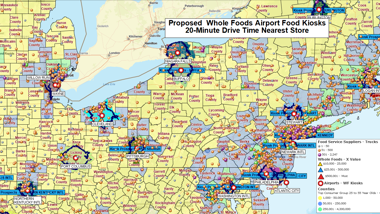
Color ZIP/county/state areas by performance, build sales, service, or delivery territories, and label counts or KPIs. Draw radius circles around key sites or use drive‑time/distance areas to communicate realistic reach. Segment customers by territory to show accountability and coverage. Everyone sees who owns what — and where the gaps are.
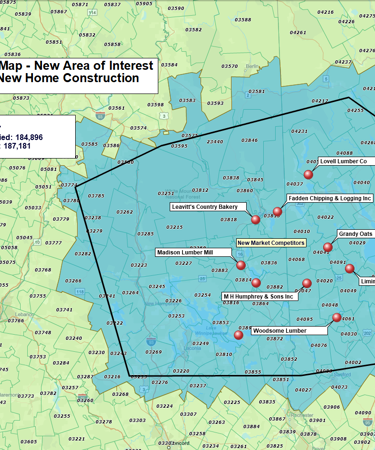
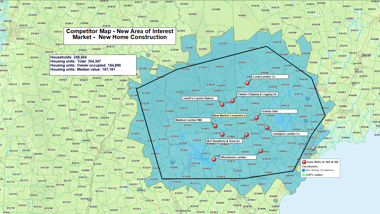
Add Demographics or Business Listings to Maps
Strengthen your message with built‑in demographics (population, income, etc.) and searchable business listings to show competitors, partners, or prospects near your sites. Enrich slides with quick facts that explain why a market is performing, or why an area is promising. Or add a demographic snapshot to a sales map to justify territory changes.
Export to PowerPoint & Print High Resolution Maps
Insert high-resolution map images directly into PowerPoint or Word and keep the quality crisp on large displays. Export high‑resolution images for decks and save PDFs for wall maps up to 60’’ x 60’’.
Share Maps in Multiple Ways
Pick the sharing mode that fits the meeting. Static: export PNG/JPEG for slides or PDF for handouts and printing. Or interactive: share a live, clickable map for Q&A or remote stakeholders — publicly or privately with role‑based access. Collaborate securely on a map with a colleague over the Internet and display it live if the meeting requires it.
How Teams Use Presentation Maps
Thousands of businesses and nonprofits enhance internal and client communications with clear, data-driven map visualizations for proposals, project planning, and identifying operational trouble spots.
- Sales: territory reviews, strategic meetings, route plans, goal tracking.
- Marketing: market opportunity, campaign coverage, location proposals.
- Operations: service coverage, site planning, resource allocation.
- Public sector & nonprofits: community briefings, emergency resources, event planning.
It’s Easy to Get Started
- Import your spreadsheet and save the map with a clear name (e.g., “Customer Coverage”).
- Style the map (colors, labels, legend) and add annotations.
- Export to PNG/JPEG for PowerPoint or save a PDF for print.
- Share an interactive link for follow‑up questions.
See MapBusinessOnline in Action
Request a demo
You're in Good Company
This leading national footwear brand manufacturer uses MapBusinessOnline to conduct retail coverage assessments nationwide. They loved MBO’s ability to provide both street level detail and USA wide high level views of points-of-sale. Importing location enabled address databases for symbolization and color shading is easy. New and planned stores can be added to the map market analysis as products are launched and mature.
"Importing location enabled address databases for symbolization and color shading is easy."
Todd Eichelberger
Sales Director
Adidas

"We use MapBusinessOnline to prepare for sales meetings. The program’s territory mapping enables color-coded sales territories by zip-code helping to define sales responsibilities and keeping our focus on selling."
Christie Shedd
Operations Manager
AFTCO Bluewater
"We recently switched to Map Business Online at our company. Not only is MBO returning us better results than our old software, but it came with a 3500% decrease in yearly licensing fees! We couldn't be happier with the switch. Excellent ease of use. I was able to just open up the program and go. It's very user friendly. I did get stuck with one feature, and reached out to customer service for help. I didn't really expect to get anything in return, but they emailed me back within the hour, and I was only a trial member! Very pleased."
Business Manager
Storecrafter


