Download the App
Contact Us
800-425-9035
Toggle navigation
START FREE NOW
Contact Us
MapBusinessOnline
Help
Home
Features
Solutions
Customer Success
Pricing
Subscribe Now
About
Help
Try Free
Account
Log Out
Solutions
By Need
By Industry
By Business Type
More...
By Need
MapPoint Alternative
Business Map Visualizations
Sales Territory Mapping
ZIP Code Mapping
Excel Data Mapping
Color Coding and Heat Maps
Call Planning with Optimized Routing
By Industry
Services
Industrial & Manufacturing
Retail
Finance
Insurance
Healthcare
Transportation & Logistics
By Business Type
Enterprise
Customer Success
Success Stories
Case Studies
Contact us
Ask a question or provide feedback
Request a live Web demo
Contact information
Help
Watch Video Demonstrations on YouTube
Basics
Team basics
Plot data
Update data
Work with maps
Share maps
Color code map and locations
Search map and data
Sales territories
Radius map
Demographic data
Route
Business Listings
Customize map
Draw on map
Market analysis
Market data
Print map
Export map image
MapPoint migration
FAQ
SDK & API
Basics
Getting started
Windows & main toolbar
Zoom & pan map
Find address
Edit layer or dataset properties
View data in table
Auto-calculated data columns
Edit location data
Edit location address
Change measurement units
Team basics
Setup Team subscription
Invite your team
Plot data
Prepare data for plotting
Add multiple locations on map one by one
Plot pre-loaded data on map
Plot data from Microsoft® Excel
Plot data from text file
Copy & paste data from spreadsheet
Microsoft Dynamics® CRM
salesforce.com
Plot data from Intuit QuickBooks
salesforce.com
Plot data from salesforce.com
Save data selection in Salesforce campaign
Microsoft Dynamics® CRM
Install MapBusinessOnline customization package for Microsoft Dynamics® CRM Online
Plot Accounts data from Microsoft Dynamics® CRM Online
Plot Contacts data from Microsoft Dynamics® CRM Online
Plot Appointments data from Microsoft Dynamics® CRM Online
Plot Opportunities data from Microsoft Dynamics® CRM Online
Update data
Update data from file
Work with maps
Create new map, save map, or open existing map
Share maps
Share public interactive map
Share interactive map privately
Open shared map
Color code map and locations
Color code dataset locations on map
Color code dataset locations with circles
Color code dataset locations with symbols
Show charts for dataset locations
Create heat map
Color code map or territories
Make business coverage map
Number locations on map
Change dataset symbol
Revert color-coded map to normal display
Search map and data
Find address
Search data by radius
Search data in polygon
Search data by drive time or distance
Delete search area
Search ZIP codes by city, county, or state
Search business listings
Sales territories
Sales territory basics
Design sales territories
Search by territory
More about territories
Sales territory basics
Overview
Table view of territories
Rename territory & edit notes
Change territory color, transparency & outline
Hide territory internal lines
Customize territory labels
Delete territory
Design sales territories
Importing ZIP Code Territories from CRM
Design sales territories by ZIP code
Design sales territories by county or state
Create territories by ZIP code from file
Create territories by county or state from file
Highlight and resolve sales territories overlap
Search by territory
Search customer data by territory
Search ZIP codes by territory
Look up territory for a customer
Segment customers by territory
More about territories
Export territory assignments to a file
Highlight market area on map
Hide geographies that are not part of any territory
Radius map
Make a radius map
Make ZIP code radius maps
Demographic data
View demographic data
Aggregate demographic data in circle
Route
Optimize stops order in route
Business Listings
Search business listings
Customize map
Show ZIP codes, counties, or states on map
Add Cities, Highways, Census tracts, ZIP3 codes and other layers to map
Select type of ZIP code layer
Change data format
Add notes to dataset callouts
Customize dataset callouts
Customize map layer labels
Edit map legend
Filter map by state
Draw on map
Map drawings tips & tricks
Market analysis
Search data from multiple locations
Find nearest store for multiple customer locations
Count and summarize customer data
Summarize demographics for multiple locations
Enrich a dataset with demographic or geographic variables
Batch calculate distances and drive times, single dataset
Batch calculate distances and drive times, two datasets
Batch calculate distances and drive times, single location
Print map
Print current map view
Print large map
Export map image
Insert map image into Microsoft® PowerPoint
Insert map image into Microsoft® Word
MapPoint migration
Import MapPoint map
MapPoint migration tips
FAQ
Change account email address
Setup Single Sign-On Service
Market data
Use RealDatasets Market Data
Account
Account information
Subscription
Messages (0)
Users & Teams
Single Sign On
Extensions
Password
Developer tools
Refer & Get a Gift
Features
Solutions
By Need
MapPoint Alternative
Business Map Visualizations
Sales Territory Mapping
ZIP Code Mapping
Excel Data Mapping
Color Coding and Heat Maps
Call Planning with Optimized Routing
By Industry
Services
Industrial & Manufacturing
Retail
Finance
Insurance
Healthcare
Transportation & Logistics
By Business Type
Enterprise
More...
Customer Success
Success Stories
Case Studies
Pricing
Subscribe Now
About
Help
Account
Log Out
START FREE NOW
Live Chat Now
Revert color-coded map to normal display
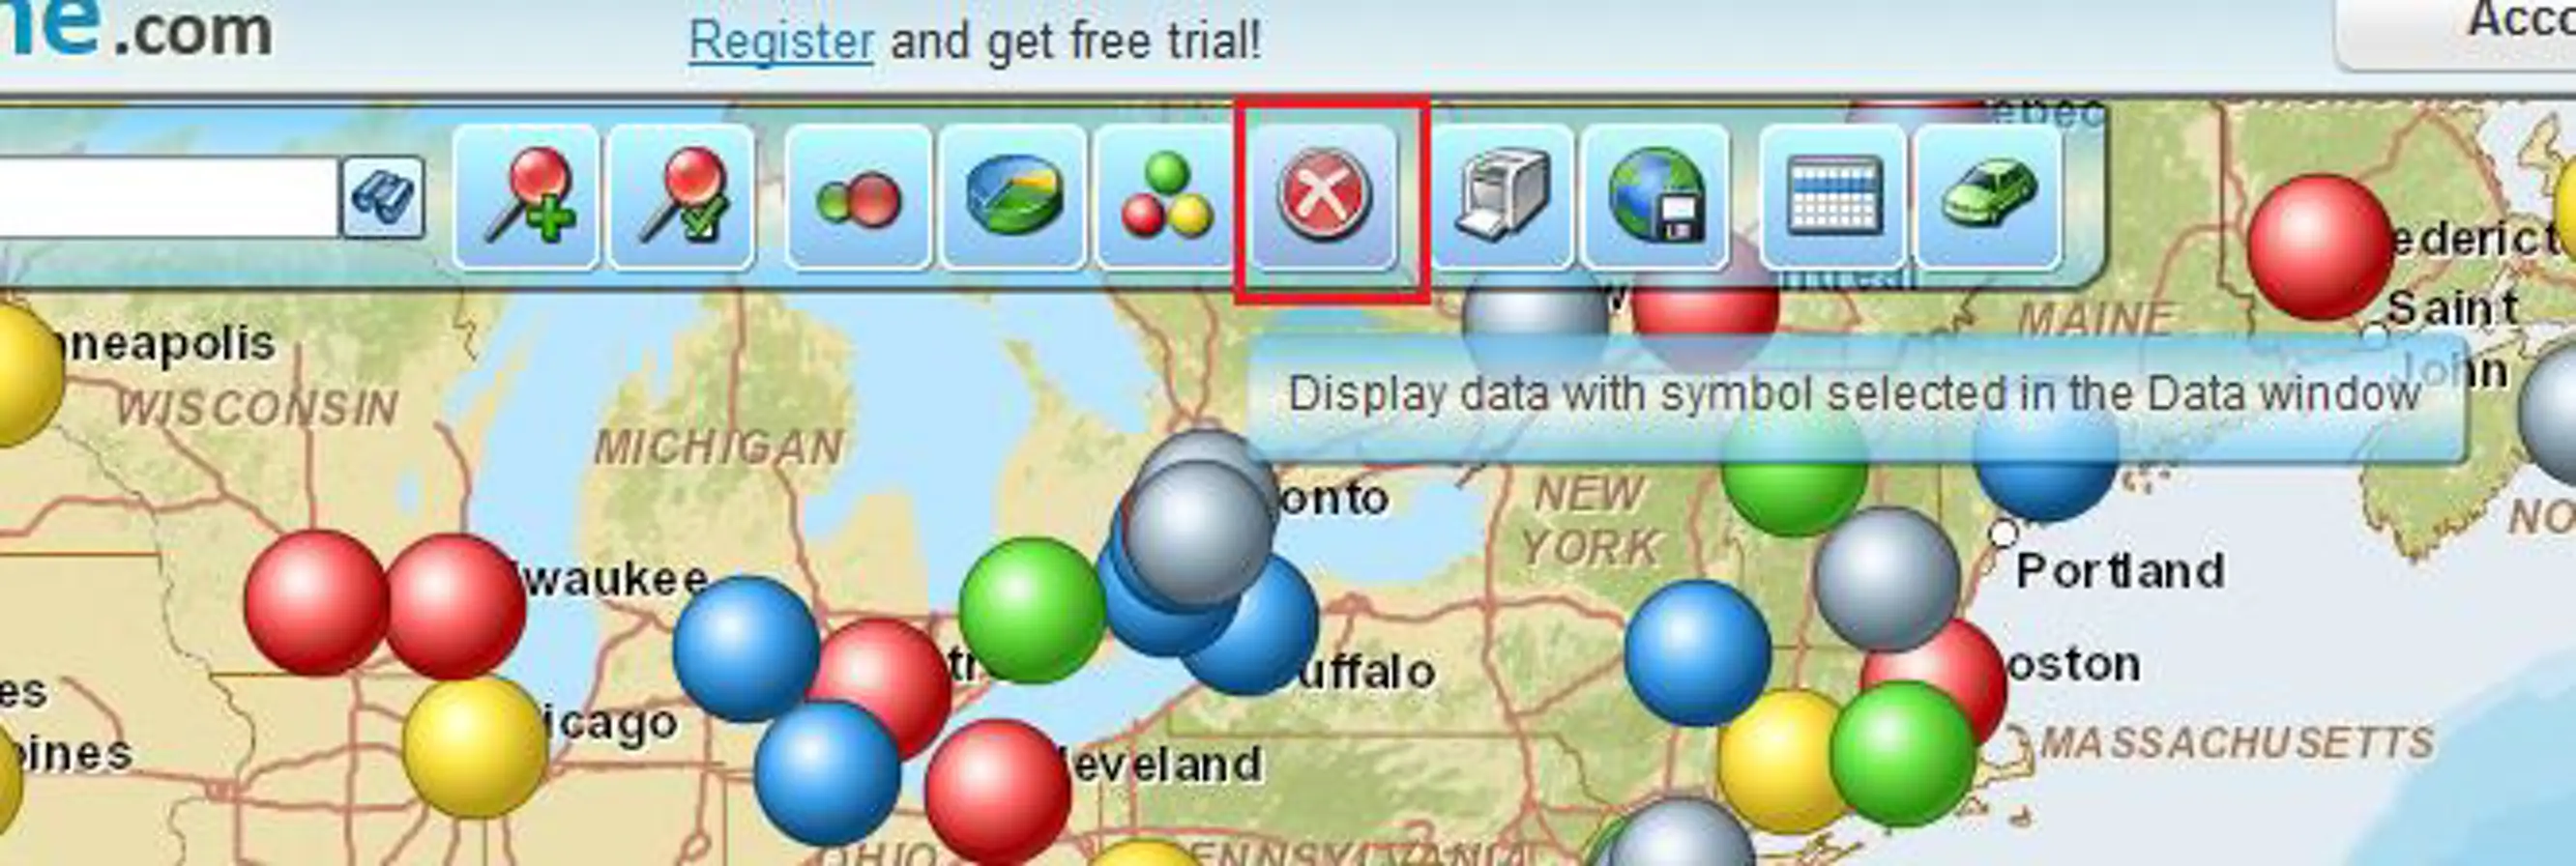
To remove color coding from map click ‘Clear color coding’ on MapBusinessOnline toolbar.
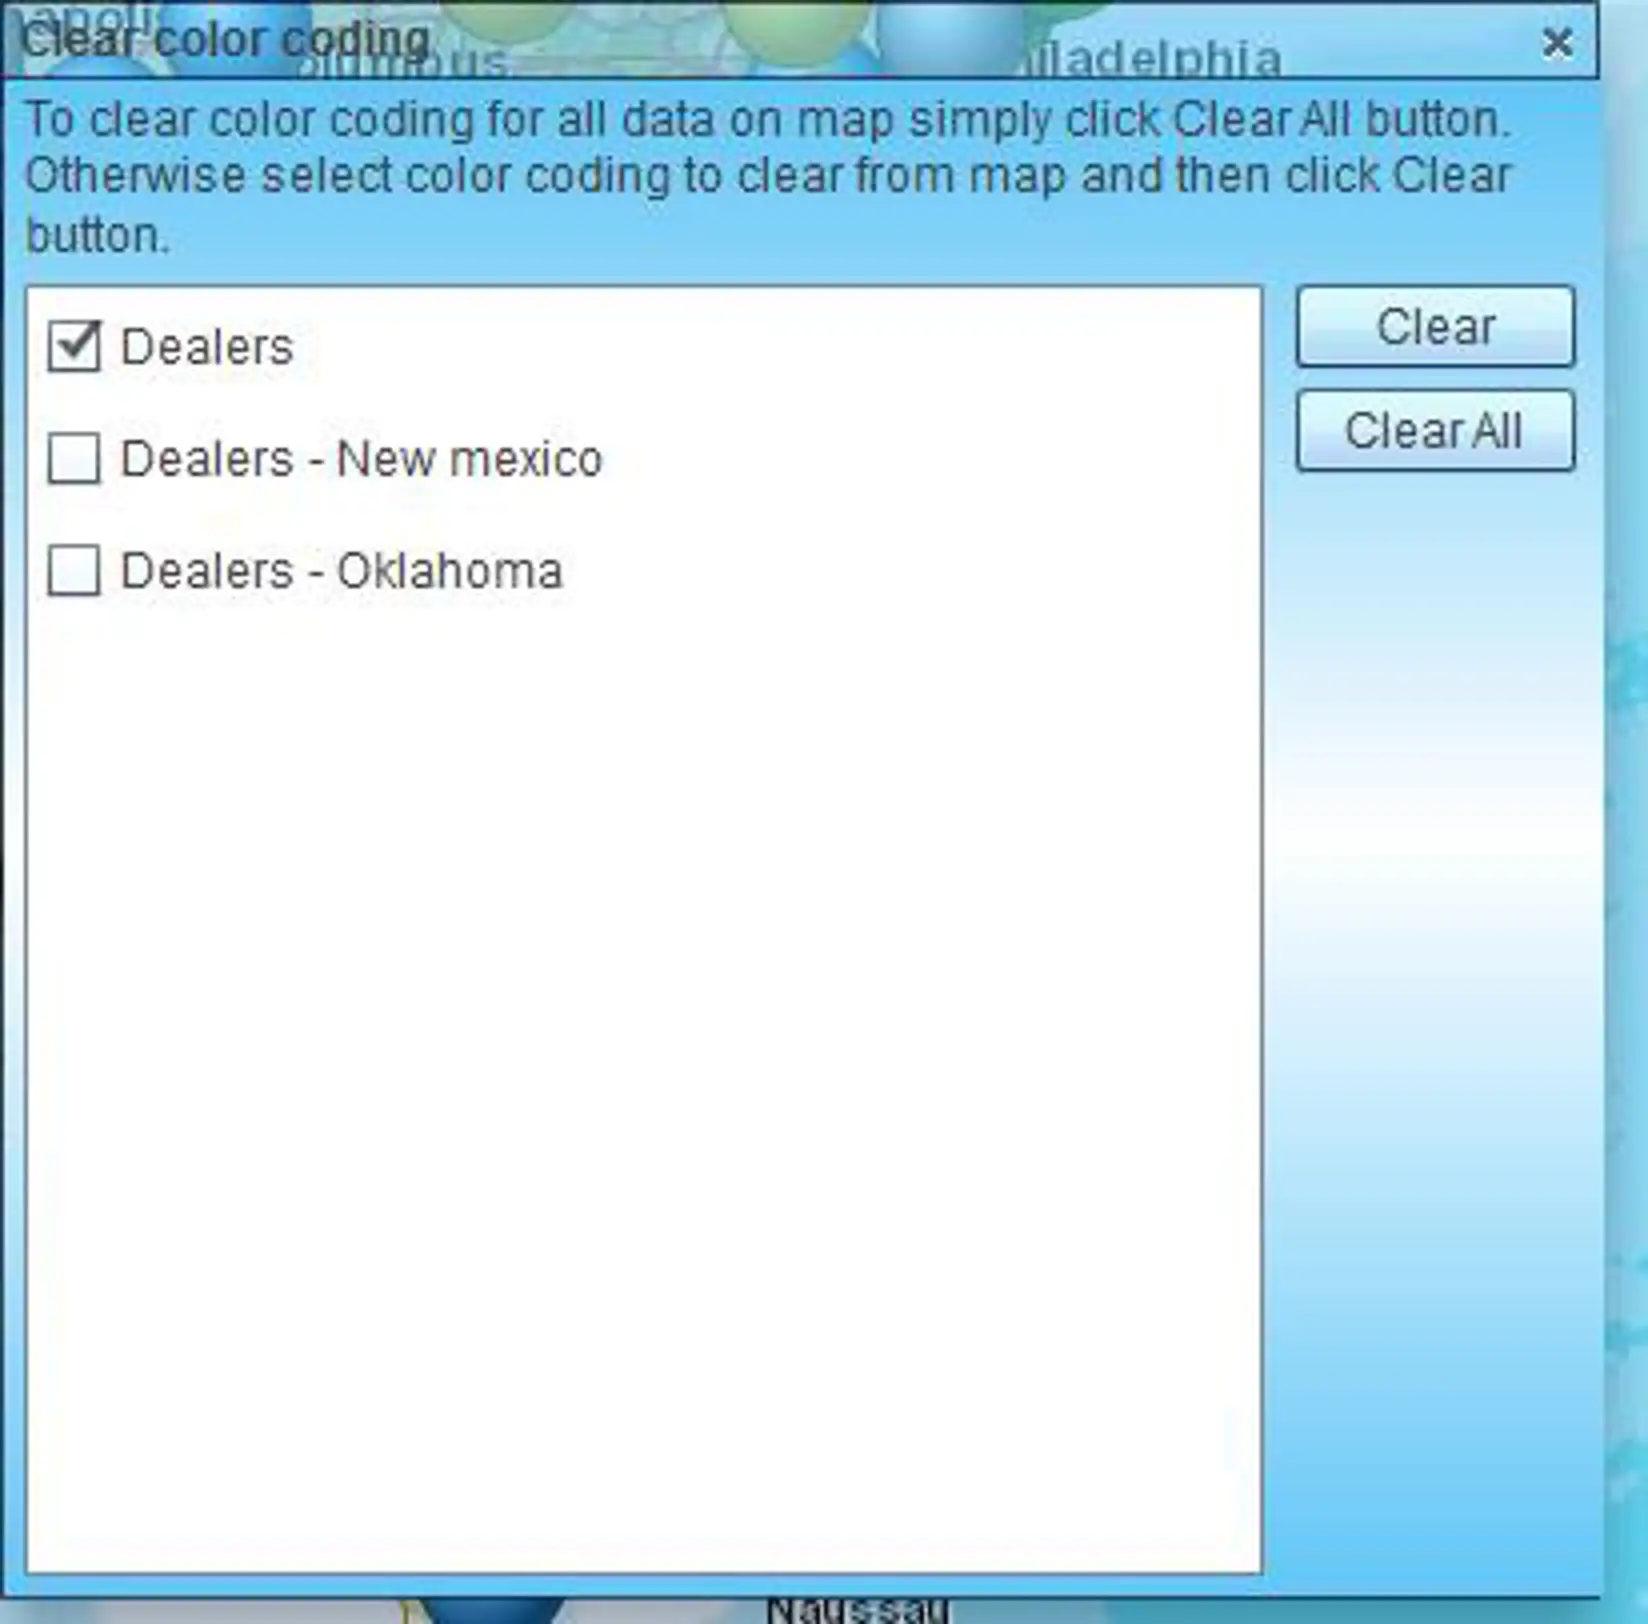
Select color coded data and click Clear. Use Clear All to revert all color coded data to normal display in the case you plotted more than one data file.
© Copyright 2010 - 2021. SpatialTEQ, Inc.
All trademarks and logos are registered by their respective owners.
This page requires JavaScript. Please enable JavaScript in your Web browser settings and reload the page.
×
This page relies on browser cookies. Please enable cookies in your Web browser and reload the page.