Plot Your Data on a Map
to Plot Your Business Data on a Map – Take a FREE Trial
We live in a world where the quantity of business data available to us is overwhelming. The challenge that business owners, salespeople, executives and other professionals face is finding affordable and reliable ways to derive value from this avalanche of data. Map plotting software from MapBusinessOnline, a leading developer of business mapping software since 1996, is an invaluable data analysis tool that can have a positive impact on just about any organization’s bottom line.
What Is Map Plotting?
Map plotting is the process of importing data from CRM, ERP or Excel spreadsheets into a mapping software solution. This enables you to visualize the data geographically instead of simply looking at a pile of numbers, which can provide an enhanced level of insight into your operation. Map plotting solutions allow you to create maps based on your data and supplemented with ZIP codes, counties, states and key demographic data. These maps can be shared as printed wall maps, image files, or as map URL’s, with other key members of your team.
The Possibilities Are Virtually Endless
Map plotting software offers a wide variety of potential benefits for an organization. Salespeople can use it to create optimized multi-stop routes that improve efficiency and enhance productivity, while sales managers can use it for territory mapping and sales accountability. Just about any operation can use map plotting to increase its “location awareness”, which is the concept of visualizing the customers, sales, prospects, and resource locations surrounding a business. We are always surprised by our customers’ creative use of our business mapping software.
The MapBusinessOnline Advantage
When you select map plotting software from MapBusinessOnline, you get a software solution backed by decades of years of experience. Our simplified user interface results in the easiest sales territory mapping product available on the market. Our mapping data is compiled by the world’s foremost GIS experts, ensuring that accuracy and reliability will never be an issue. Our world-class technical support sets the standard for the map plotting software industry; you’ll receive one-on-one assistance from a knowledgeable professional who will do whatever it takes to resolve your technical issue promptly. And at the low cost our software is the most affordable product of its kind.
Get Started With a FREE Trial
If you still have doubts about the value of our map plotting software, online demos are available that allow you to “kick the tires” on a risk-free basis. We invite you to try our product at no cost, and you’re under no obligation to keep the software at the end of the trial period. You have nothing to lose by giving MapBusinessOnline a try, so why not register to receive your FREE trial today?
See MapBusinessOnline in Action
Request a demo
Learn How Our Customers are Succeeding with MapBusinessOnline
"I wanted to thank my customer service rep Jason for always going above and beyond every time I call for answers...AND THIS IS WHILE I AM USING A TRIAL VERSION!!! With this kind of service, why would you ever use another software company?"
David imports his USA-wide network of restaurant service suppliers and uses the map to visualize his contacts for instant access.
"Every time I use MapBusinessOnline…and I always get what I need."
David Ziviello
Sales
Rosito Bisani

MVP Sports Clubs is a sports and health facility management and development company with operations in Central Florida and West Michigan. MVP uses MapBusinessOnline to construct demographic map profiles of a radius surrounding each of their many sports clubs. Such market analysis helps MBO users develop a better understanding of their business which makes strategic planning more effective.
"MBO users develop a better understanding of their business which makes strategic planning more effective."
Mark Hope
Business Manager
MVP Sports

"You guys are awesome! I used the MapBusinessOnline trial to get promoted to a sales position within my company. I showed them how I would work my territory with great MBO printed maps that showed projected sales dollars by account locations. I got the Job!"
Jeff Krieger
Territory Manager
Mizuno USA
Popular MapBusinessOnline features
Build fast map visualizations of your business data

Map business data from various sources by street address, city name, ZIP code, or latitude and longitude. Plot 250,000 or more locations on a map at once. All you need to start is a spreadsheet with business data.
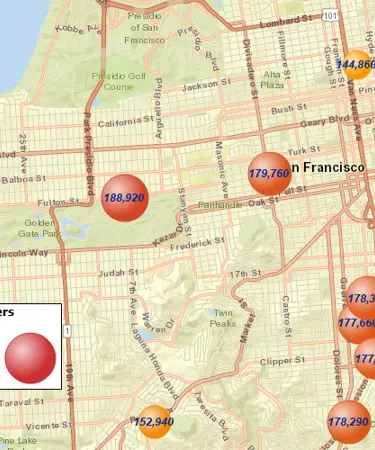
Visualize business data on map with various symbols

Assign specific symbols, colors, and sizes to your data points on map. Choose from a wide variety of symbols or create your own. Visually define customers and prospects across multiple locations using symbols color coding.
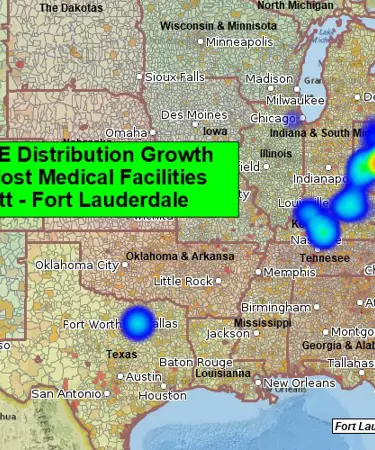
Emphasize customers density with heat maps

Highlight market areas that generate more business. Visually compare map areas for business potential. Select from a variety of heat map colors and options.
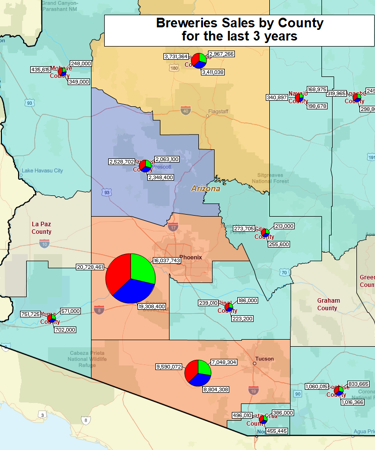
Illustrate business data on map with charts

Graphically depict your business data on a map using pie or bar charts. Use charts to show sales by product, invoices due vs. paid, products ordered vs. shipped, and sales by customer demographics.
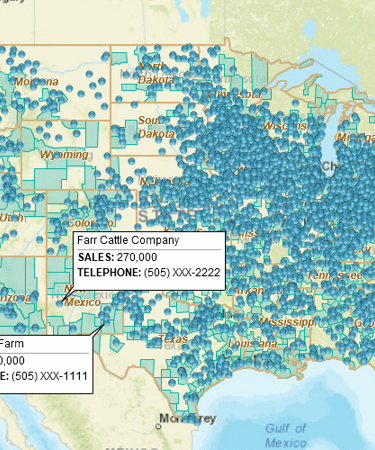
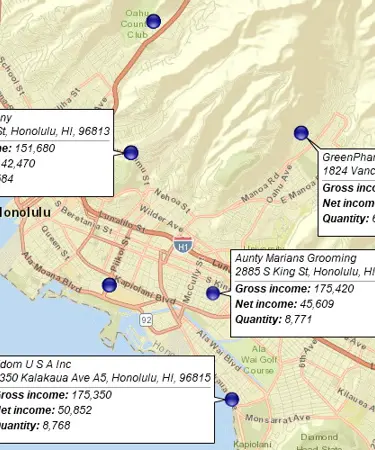
Label your business data using flexible callouts

Show more than one callout on map at a time. Add notes to individual map callouts. Change callouts orientation for better map layouts. Customize callouts look & feel.
Draw custom graphics and annotate maps

Draw circles, rectangles, polygons, and lines. Choose from a selection of line styles and fill colors. Identify map locations with text. Draw market areas and sales territories. Customize your business map.
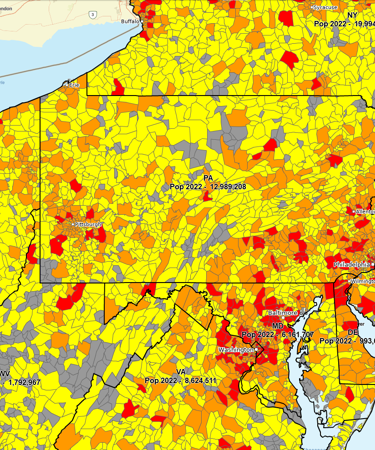
Display business data against demographic maps

Categorize geographic areas by population or household income. Explore new markets, business patterns, or social trends against color coded Census maps for business and competitor analysis.
Share business maps

Create interactive maps and share with friends, colleagues, dealers, customers, prospects or vendors. Share territory maps. Email saved JPEG and PNG files or embed map files in PowerPoint presentations. Includes PDF export for larger print formats.
Print large format map views

Print large maps to use in presentations and project plans. Save maps as PDF files to print as large as 60” x 60” customer maps. Supports multiple pages option to use your home or office printer for large wall maps.
Search data spatially with radius maps

Explore your data within circle or polygon areas. Organize search results into marketing lists or market areas. Export ZIP code demographics, territories, or marketing lists in Microsoft® Excel spreadsheets.


