Demographic Maps by ZIP Code
Introduction
If you want to analyze population trends, compare household income levels, or understand where your customers live, a demographic map by ZIP Code is one of the fastest ways to gain insight. MapBusinessOnline makes it easy to create interactive maps using U.S. Census data and other demographic datasets.
In this article, we’ll walk step-by-step through how to create a ZIP Code demographic map, and show how you can use it to make smarter business decisions.
You can start building your own demographic ZIP Code map right away with a free trial of MapBusinessOnline.
Step 1: Start with a ZIP Code Map
Click the New Map button on the Master Toolbar to open a fresh U.S. map.
In the Map and Data window (the blue floating box on the left), check the ZIP Code layer to display ZIP boundaries.
-
For best accuracy, set ZIP Code options to ZIP5 Code with Fillers. This prevents missing areas around parks and rural regions.
-
Adjust the transparency so you can still see the base map behind ZIP Code boundaries.
Step 2: Add Demographics by ZIP Code
With the ZIP layer active, open the Map Layer Properties panel and click Color-Code Map Layer.
From the dropdown, choose Demographic Data. You’ll find hundreds of available variables — from total population to households, median household income, or average household size.
-
Example: Select Households (2023) and apply a five-color scheme to visualize distribution.
-
Break your ranges logically (e.g., 1–250, 251–1,000, 1,001–5,000).
-
Adjust color shades for clarity.
This instantly creates a demographic map by ZIP Code, showing patterns you can use for market analysis, territory planning, or customer profiling.
Step 3: Customize the Map Look and Feel
ZIP Codes can look crowded at the national level. Tweak the appearance to make your demographic map easier to read:
-
Thicken or darken ZIP Code boundaries.
-
Adjust transparency for better background visibility.
-
Zoom in to see more ZIP Code labels displayed automatically.
Step 4: Append Demographic Data to ZIP Code Labels
Adding demographic data directly to ZIP Code labels makes the map even more insightful.
-
Hover over the ZIP Code layer and click Edit Map Layer Properties.
-
Open the Labels tab and enable Show Auto Labels.
-
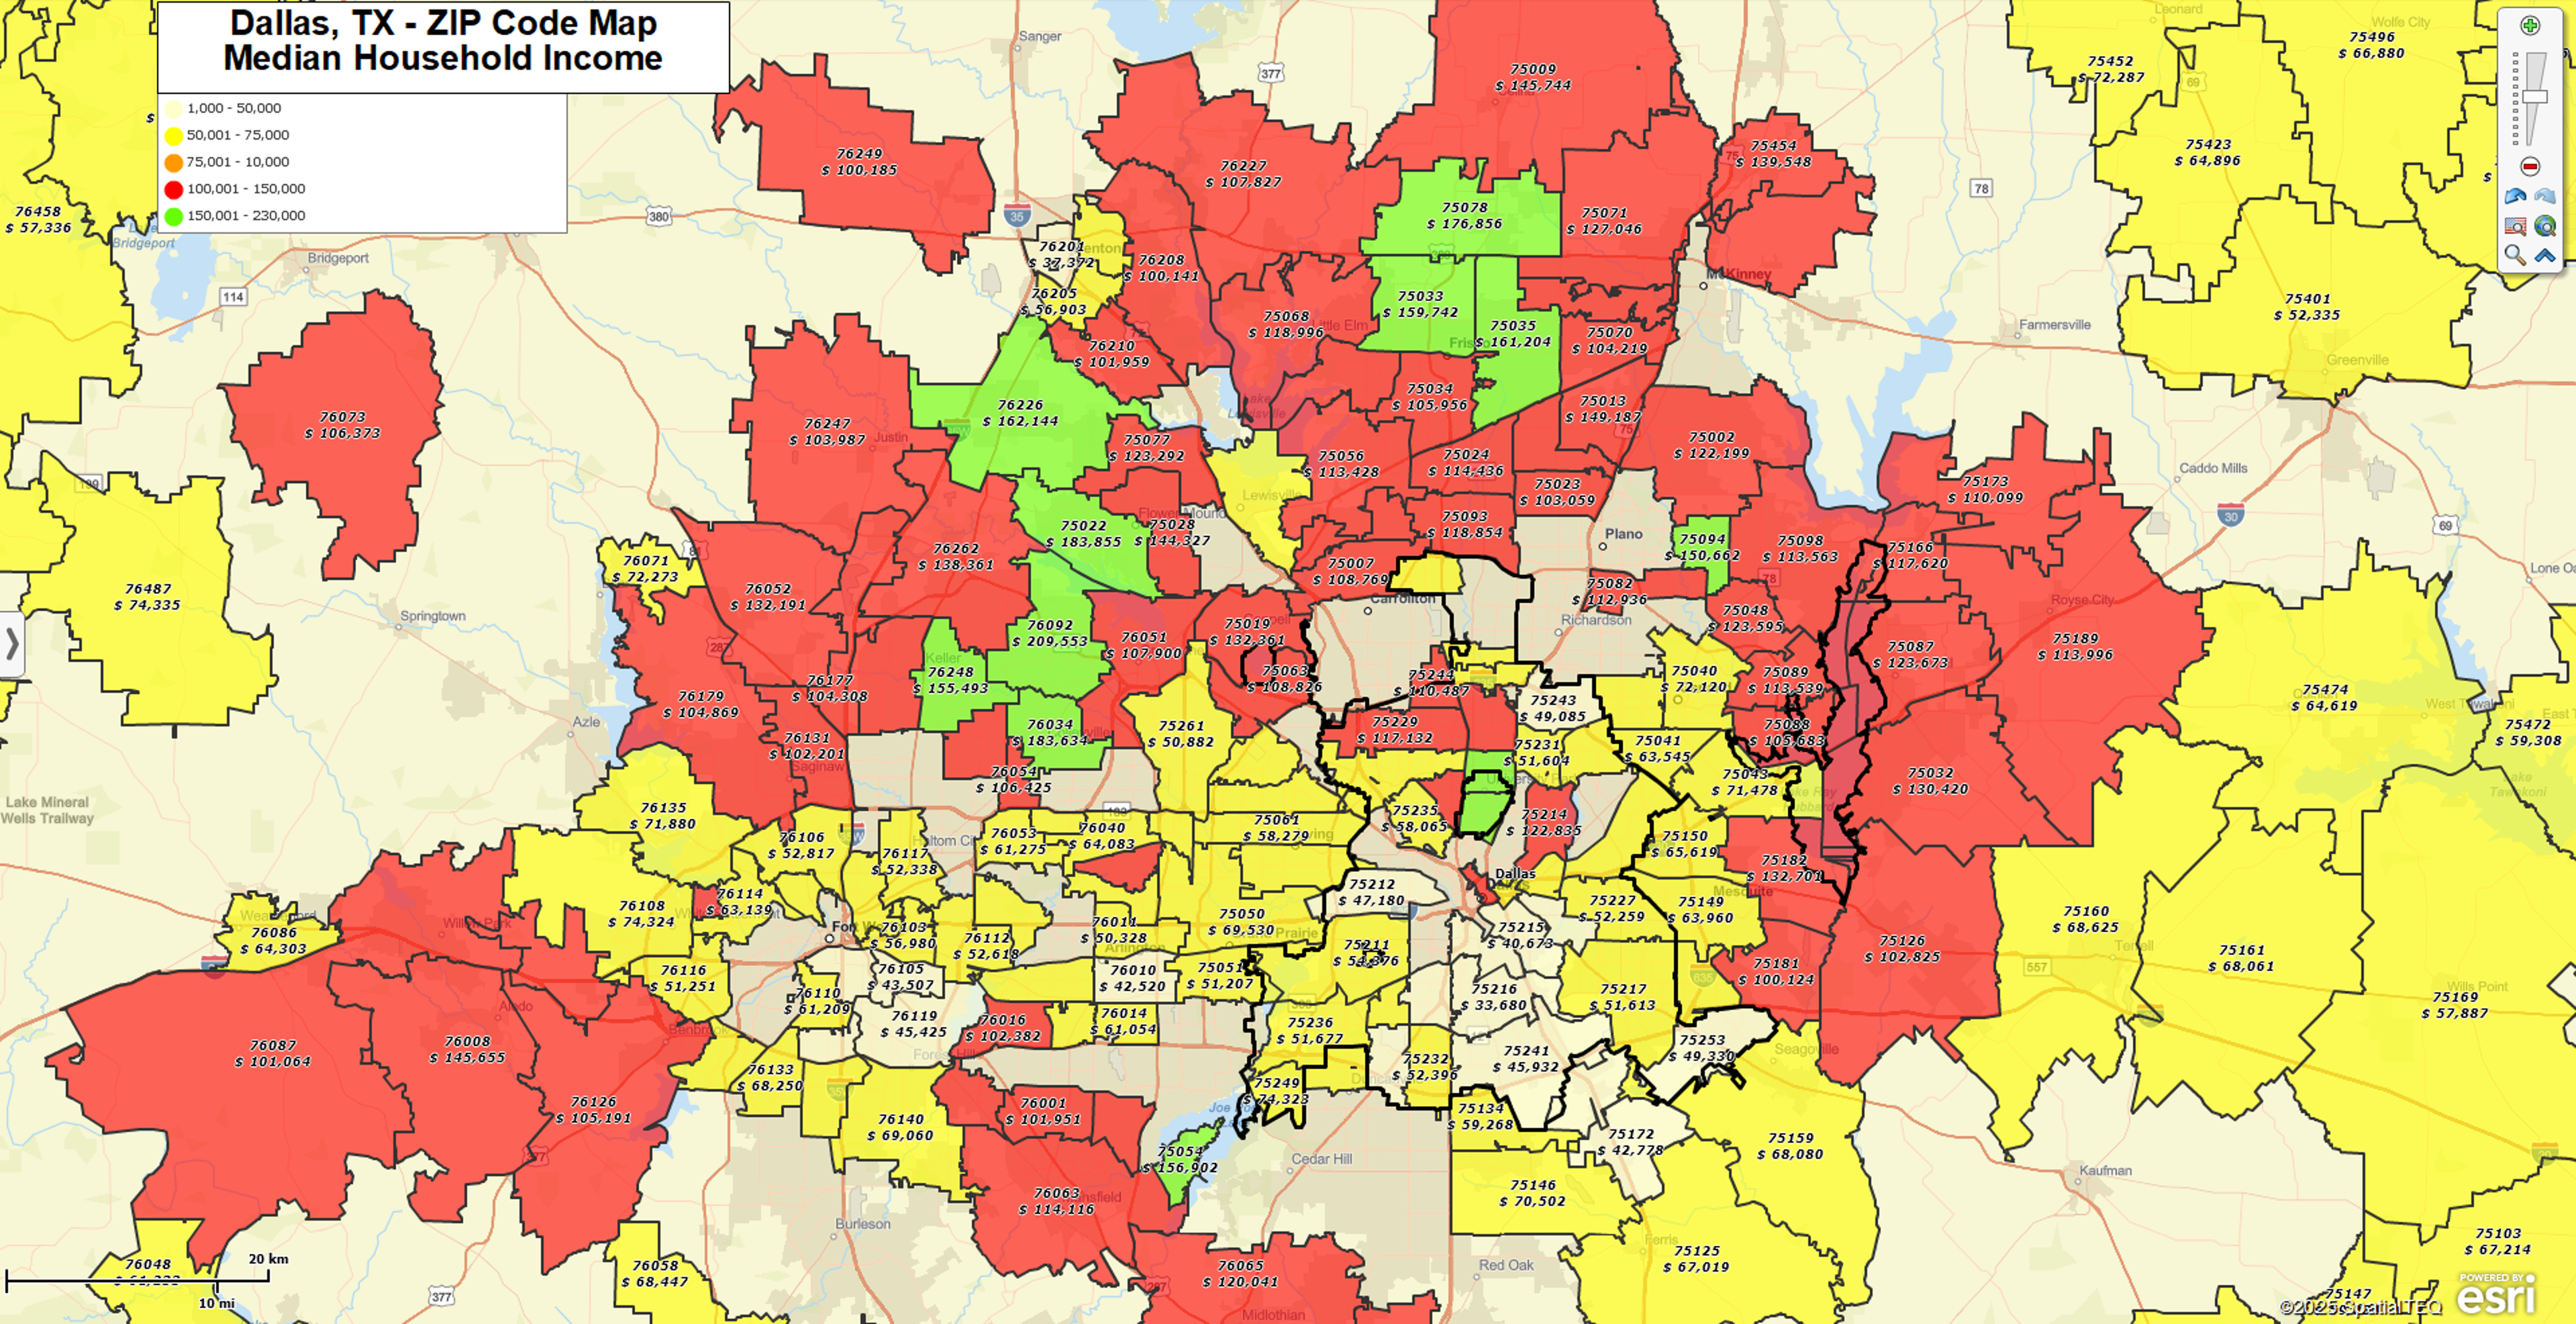
Choose up to five demographic variables to append (e.g., Median Household Income, Population, Average Household Size).
Now each ZIP Code label can display key demographic stats at a glance.
Step 5: Enrich with Business or Customer Data
Beyond Census demographics, MapBusinessOnline lets you overlay your own business data:
-
Import customer or prospect lists from Excel (address or ZIP Code level).
-
Append demographic values to your customer locations.
-
Add business listings to identify competitors or generate leads.
-
Create heat maps or dot-density maps for deeper analysis.
This combination of demographics + your data creates a complete picture of your market.
Step 6: Share and Export Your Demographic Maps
Once your map is ready, you can:
-
Share interactive maps with teammates.
-
Export the map as a high-resolution image for reports or presentations.
-
Print large format maps for field use or planning sessions.
Why Demographics by ZIP Code Matter
ZIP Codes are one of the most familiar geographic units for business users. We all know our own ZIP Code, and most people think of it as their town or neighborhood. That makes them a natural frame for analyzing:
-
Customer locations
-
Sales territories
-
Market opportunities
-
Coverage gaps
Demographic maps by ZIP Code allow you to answer questions like:
-
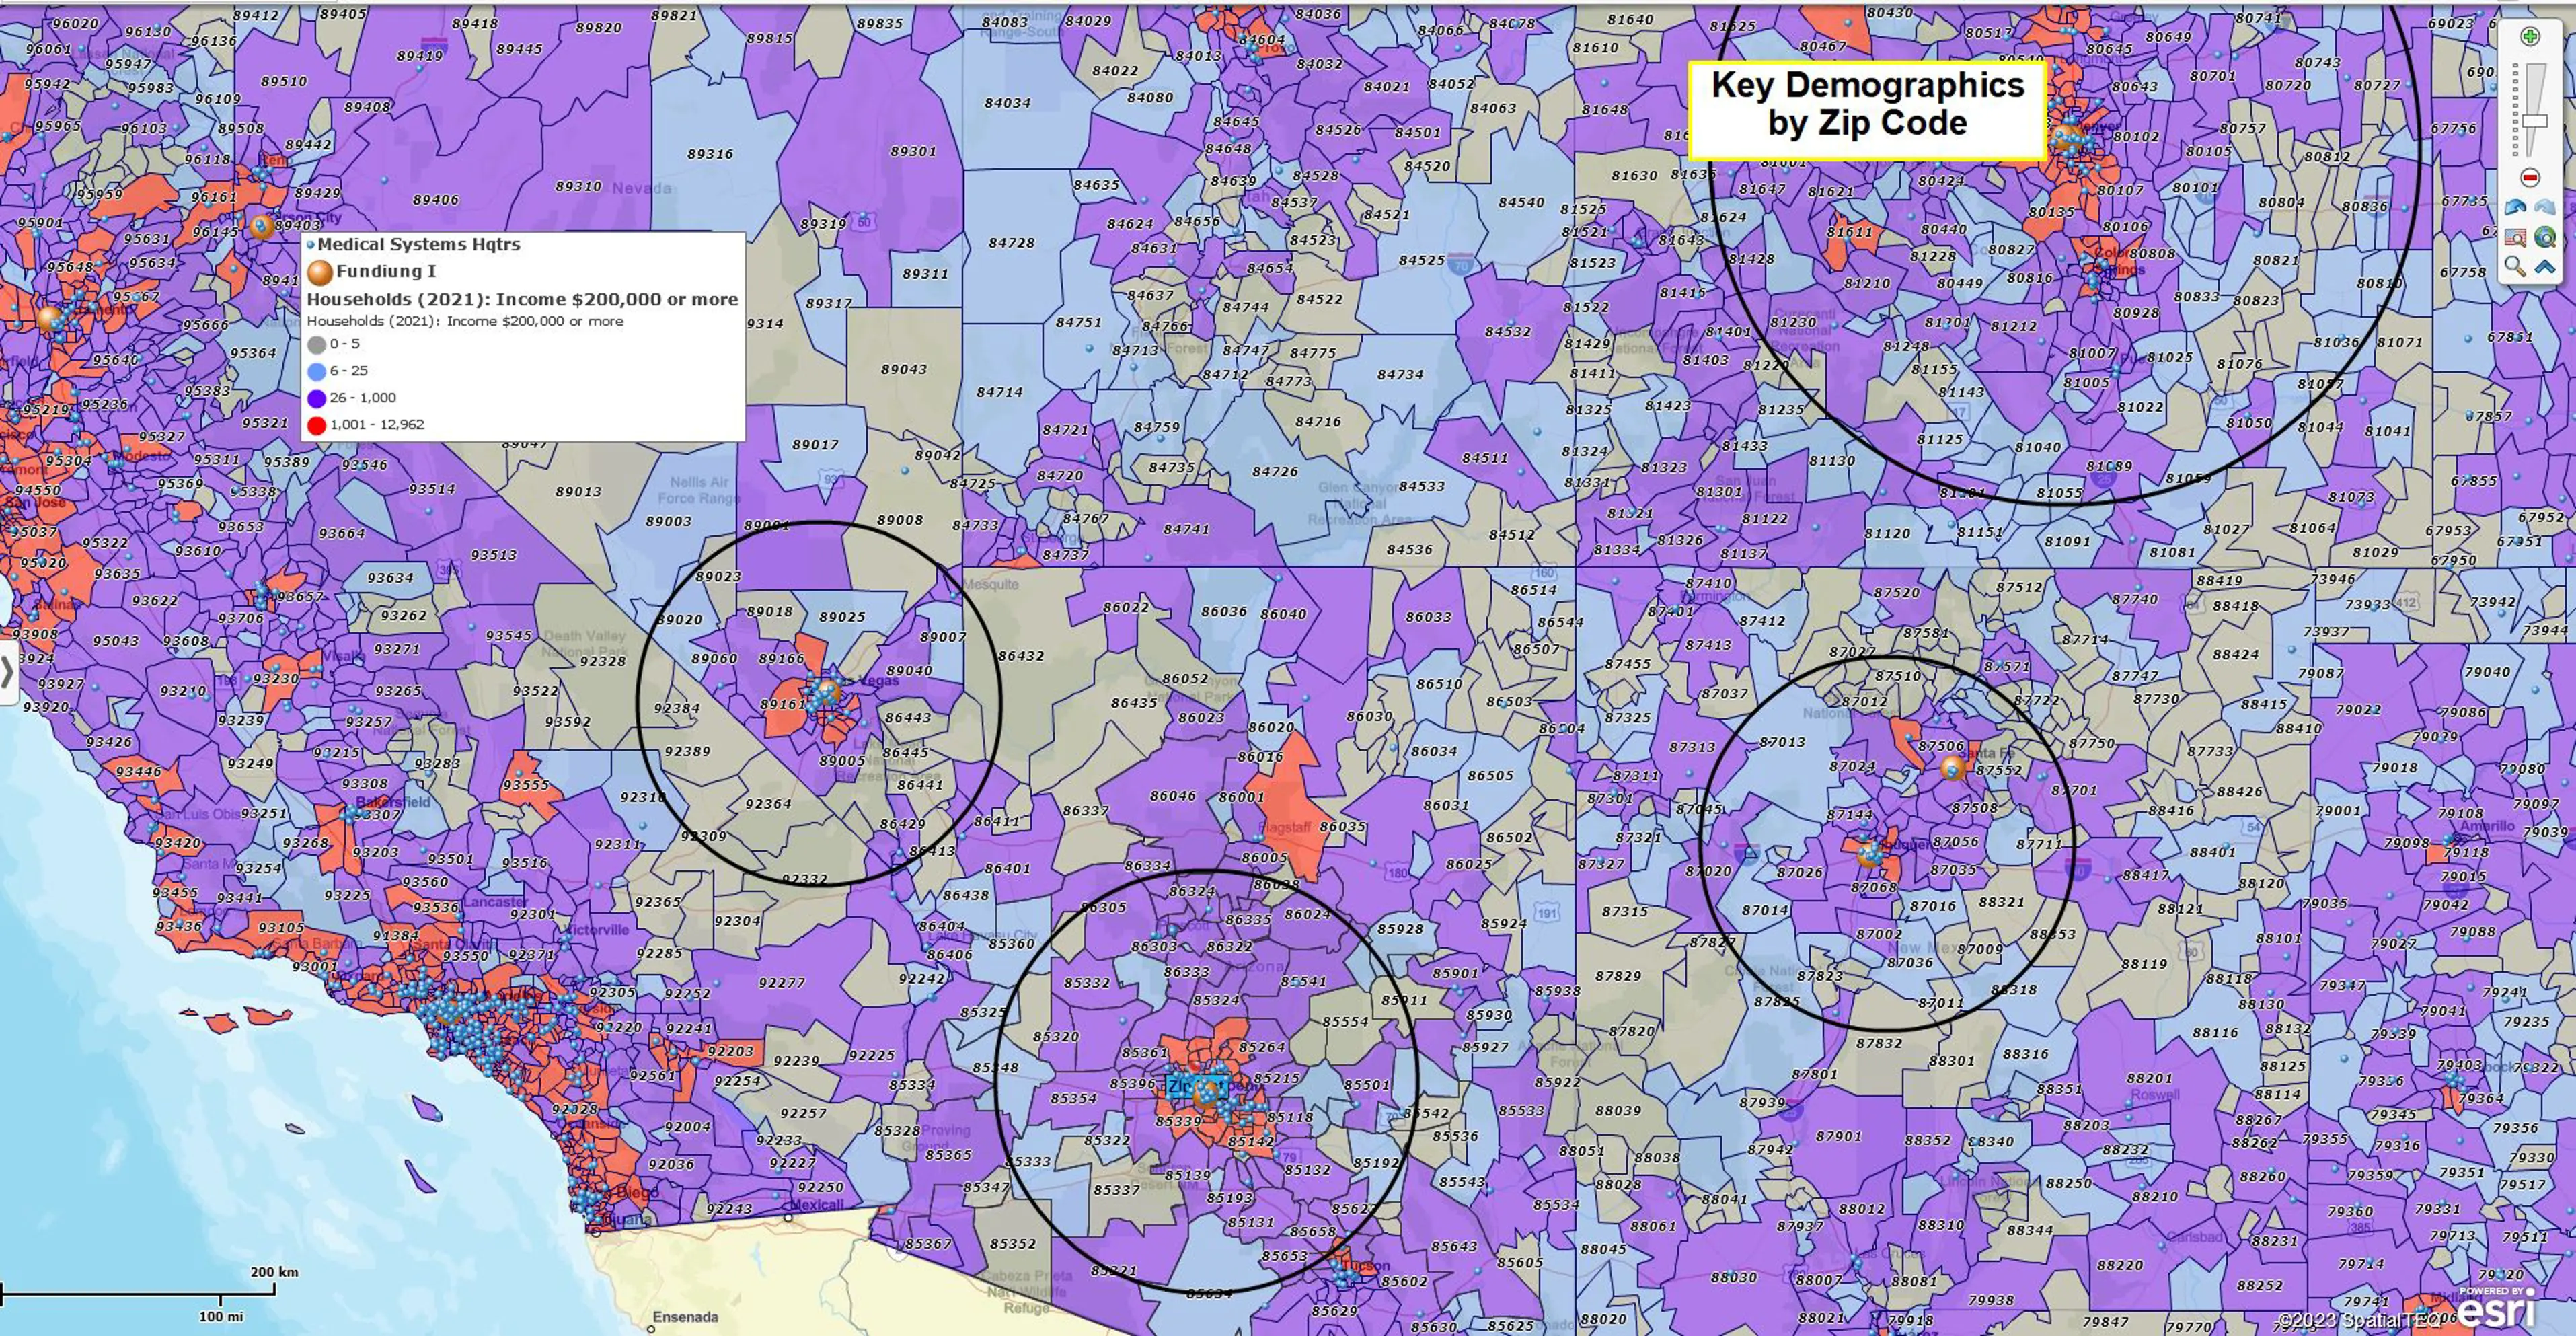
Where do high-income households live in my target market?
-
Which ZIP Codes have the largest customer base?
-
How do demographics vary across my sales territories?
Frequently Asked Questions
What is a demographic map by ZIP Code?
A demographic map by ZIP Code shows population, household income, and other Census-based data organized geographically by ZIP boundaries. It helps businesses understand where customers live and how markets differ.
How can I find demographics by ZIP Code?
In MapBusinessOnline, you can choose the ZIP Code map layer and add demographic variables like population or income. This lets you instantly visualize demographic trends across different ZIP Codes.
What demographic data is available?
MapBusinessOnline includes hundreds of variables, including total population, households, median household income, average household size, and age groups. You can also enrich your own customer datasets with these values. Read more about included data here.
Can I export or share demographic ZIP Code maps?
Yes. Maps can be exported as images for reports, printed in large format, or shared interactively.
Related Solutions
Get Started Today
Creating a demographic map by ZIP Code doesn’t require GIS expertise. With MapBusinessOnline, you can start in minutes:
-
Build maps with population, household, and income data
-
Enrich your own datasets with demographics and business listings
-
Share maps across your team for better planning and collaboration


